Increased Circulating T Lymphocytes Expressing HLA-DR in Kidney Transplant Recipients with Microcirculation
Inflammation
We consecutively enrolled 82 kidney transplant recipients (KTRs) with stable renal function and 24 KTRs who underwent indication biopsy to compare the histological grading of renal allografts with the activity of circulating T lymphocyte subsets and monocytes determined by flow cytometry, which were obtained at 2 weeks after kidney transplantation (KT) and at the time of indication biopsy, respectively. The sum of the scores of glomerulitis (g) + peritubular capillaritis (ptc), inflammation (i) + tubulitis (t), interstitial fibrosis (ci) + tubular atrophy (ct), and fibrointimal thickening (cv) + arteriolar hyaline thickening (ah) was used to assign a histological grade to the renal allograft samples. The frequencies of CD4+HLA- DR+/CD4+ T cells and CD8+HLA-DR+/CD8+ T cells were significantly increased in KTRs with a microcirculation inflammation (MI) sum score ≥ 1 when compared with KTRs with an MI sum score = 0 as well as stable KTRs. In these 2 subsets, only CD4+HLA-DR+/CD4+ T cells were positively correlated with MI sum scores. Analysis using the receiver operating characteristic (ROC) curve showed that antibody-mediated rejection (AMR) could be predicted with a sensitivity of 80.0% and a specificity of 94.7%, using a cutoff value of 29.6% frequency of CD4+HLA-DR+/CD4+ T cells. MI was significantly associated with an increased frequency of activated T lymphocytes expressing human leukocyte antigen- antigen D related (HLA-DR). Further studies should focus on validating the utility of circulating CD4+HLA-DR+/CD4+ T cells as a noninvasive, immunologic monitoring tool for the prediction of AMR.
Keywords: Microcirculation Inflammation; T Lymphocyte; Kidney Transplantation;
Antibody-Mediated Rejection Hee-Yeon Jung,1 Yong-Jin Kim,2
Ji-Young Choi,1 Jang-Hee Cho,1 Sun-Hee Park,1 Yong-Lim Kim,1 Hyung-Kee Kim,3 Seung Huh,3 Dong Il Won,4 and Chan-Duck Kim1
1Department of Internal Medicine, Kyungpook National University School of Medicine, Daegu, Korea; 2Department of Pathology, Kyungpook National University School of Medicine, Daegu, Korea; 3Department of Surgery, Kyungpook National University School of Medicine, Daegu, Korea;
4Department of Clinical Pathology, Kyungpook National University School of Medicine, Daegu, Korea
Received: 9 December 2016 Accepted: 19 March 2017 Address for Correspondence:
Chan-Duck Kim, MD, PhD
Division of Nephrology, Department of Internal Medicine, Kyungpook National University School of Medicine, 130 Dongdeok-ro, Jung-gu, Daegu 41944, Republic of Korea E-mail: [email protected]
Funding: This research was supported by a grant from the Korea Health Technology R & D Project through the Korea Health Industry Development Institute (KHIDI), funded by the Ministry of Health & Welfare, Republic of Korea (No. HI13C1232, HI15C0001).
https://doi.org/10.3346/jkms.2017.32.6.908 • J Korean Med Sci 2017; 32: 908-918
INTRODUCTION
Despite the advances in post-operative patient management and the availability of new immunosuppressive agents, overcoming and monitoring immune responses in kidney transplant recipi- ents (KTRs) to ensure renal allograft survival remains a critical challenge for clinicians. Antibody-mediated rejection (AMR), rather than pure T cell mediated rejection (TCMR), is a major cause of late kidney transplant failure (1). Microcirculation in- flammation (MI), defined as the sum of the glomerulitis (g) and peritubular capillaritis (ptc) scores, is a crucial histologic find- ing in AMR (2) and is associated with a poor prognosis for graft survival in KTRs (3).
Previous studies analyzing the immunohistological aspects of allograft rejection have demonstrated that human leukocyte antigen-antigen D related (HLA-DR) expressing cells and T lym- phocytes (4,5), HLA-DR expressing monocytes (6), or macro-
phage infiltration (7) were increased in renal allografts with TCMR.
Studies examining the immune status of peripheral blood have also reported increased circulating CD4+CD25+ and CD8+HLA- DR+ T lymphocytes (8), altered levels of circulating CD4+CD25+ regulatory T cells (9), and increased frequencies of circulating monocytes (7) in KTRs with TCMR. These immune reactions occurring in the renal allograft or peripheral blood ultimately result in tissue damage and renal allograft dysfunction.
Previous studies have demonstrated the clinical significance of MI, T lymphocytes, and monocytes in KTRs with acute rejec- tion. However, there is limited information available on the as- sociation between MI in allograft biopsy and the activity of pe- ripheral blood T lymphocytes and monocytes. The aim of the present study was to compare the histological grading of renal allografts, according to the Banff score, with the activity of cir- culating T lymphocyte subsets and HLA-DR-positive monocytes in KTRs.
ORIGINAL ARTICLE
Cell Therapy & Organ Transplantation
2017-03-16 https://crossmark-cdn.crossref.org/widget/v2.0/logos/CROSSMARK_Color_square.svg
MATERIALS AND METHODS Study population and sample collection
Patients who underwent a major surgery within one month, patients with active infection, including HIV and viral hepatitis, and patients with autoimmune or hematologic disorders were excluded. We consecutively enrolled 82 KTRs with stable renal function at 2 weeks after kidney transplantation (KT) and 24 KTRs with acute renal allograft dysfunction who underwent in- dication biopsy. Circulating T lymphocyte subsets and HLA-DR positive monocytes were collected at 2 weeks after KT and at the time of indication biopsy, respectively. T lymphocytes and HLA-DR-positive monocytes were isolated from the peripheral blood samples. Data on the demographics, immunological sta- tus, and clinical characteristics at the time of KT and biopsy were collected. Donor-specific antibody (DSA) was determined by Luminex assays and expressed as mean fluorescence intensity (MFI).
Immunosuppressive treatment
Induction treatment with intravenously administered basilix- imab was performed to all the patients. Patients received im- munosuppressive treatment including corticosteroid, calcineu- rin inhibitor (CNI), and mycophenolate mofetil. Corticosteroid treatment included 500 mg intravenous methylprednisolone at the time of surgery and was tapered to 5 mg/day oral predniso- lone after 6 months. The dosages of tacrolimus were adjusted to achieve the trough level of 8–12 ng/mL in the first 3 months and 5–8 ng/mL thereafter. The dosages of cyclosporine were adjust- ed to keep the trough level of 250–300 ng/mL in the first 3 months and 100–150 ng/mL thereafter. Mycophenolate mofetil was ad- ministered daily at a fixed dose of 1.0–2.0 g.
Histopathology
All biopsies were obtained before the treatment of the presump- tive diagnosis. A total of 24 biopsy specimens were reviewed, according to the Banff 2013 classification. All assessments were made by a renal pathologist and a nephrologist, without any knowledge of the clinical and immunological status of the KTRs.
Definitions of the terms used in the Banff 2013 classification system are as follows: g describes the percentage of glomeruli with increased infiltrating mononuclear cells, or the occlusion of the glomerular capillary by mononuclear cells and endothe- lial enlargement (range 0–3); ptc indicates the number of infil- trating neutrophils or mononuclear cells in > 10% affected cor- tical peritubular capillaries (range 0–3); MI is the sum of g + ptc (range 0–6); interstitial inflammation (i) indicates the percent- age of mononuclear inflammation in the nonfibrotic area, ex- cept the subcapsular cortex and perivascular area (range 0–3);
tubulitis (t) indicates the number of mononuclear cells in the most severely inflamed tubule; for longitudinal sections, it is the
count per 10 tubular epithelial nuclei (range 0–3); interstitial fi- brosis (ci) indicates the percentage area of the cortex with fibro- sis (range 0–3); tubular atrophy (ct) indicates the percentage area of the cortex with atrophic tubules (range 0–3); arterial fi- brointimal thickening (cv) indicates the percentage of the lu- men of most severely affected (range 0–3); and arteriolar hya- line thickening (ah) indicates the number of circumferential or non-circumferential focal hyaline deposits (range 0–3). Peritu- bular capillary deposition of C4d has been determined. The histologic grading of renal allograft was classified according to the sum of scores of g + ptc (MI), i + t, ci + ct, and cv + ah, based on Banff 2013 scheme as described above.
Flow cytometric analysis of T lymphocyte and monocyte subsets
The frequencies of peripheral blood CD4+, CD8+, CD25+, and HLA-DR+ T lymphocytes, and HLA-DR-positive monocytes were determined by flow cytometry. Whole blood was stained with fluorochrome-conjugated monoclonal antibodies for 20 min- utes at room temperature, protected from light. The following antibodies (BD Biosciences, San Jose, Ca, USA) were used: anti- CD25-FITC, anti-CD8-PE-Cy5, anti-CD3-PE, anti-CD4-PE-Cy5, anti-CD14-PE, and anti-HLA/DR-FITC. The values were de- scribed as a percentage and as the MFI. RBCs were lysed (DN RBC Lysis Buffer; DiNonA Inc., Seoul, Korea) after incubation with fluorochrome-conjugated antibodies. Cells were washed once with and resuspended in phosphate buffered saline and were analyzed on a FACSCalibur Flow cytometer using the Cel- lQuest software (both from BD Biosciences).
Immunohistochemistry
The number of CD3+ T cells and CD68+ macrophages in glomer- ular and peritubular capillaries was assessed by immunoperox- idase staining. Tissue sections were incubated with rabbit poly- clonal CD3 (Prediluted, clone 2GV6; Ventana, Tucsan, AZ, USA) or antihuman CD68 (1:50, clone PG-M1; DAKO, Carpenteria, CA, USA) primary antibody. Absolute numbers of intracapillary positive cells in 5 glomerular and peritubular capillaries were counted and mean number of positive cells per glomerular and peritubular capillary was presented.
Statistical analysis
Continuous variables are expressed as mean ± standard devia- tion (SD) for normally distributed data and as the median with range when the values were not normally distributed. Differ- ences in T lymphocyte subsets and monocyte percentages be- tween the 2 groups based on histological scores and in mean numbers of positive cells for CD3 and CD68 according to the histological diagnosis were analyzed using the Mann-Whitney U test because of the non-normal distribution of all parameters.
Correlations between the MI sum scores, the MFI of de novo
DSA, and T lymphocyte subsets and HLA-DR-positive mono- cytes were measured using Spearman’s correlation coefficient (r). The ability of CD4+HLA-DR+/CD4+ T cells to predict acute AMR was analyzed using the receiver operating characteristic (ROC) curves. Statistical analysis was performed using the SPSS version 19.0 (SPSS Inc., Chicago, IL, USA). P values < 0.05 were considered statistically significant.
Ethics statement
The Institutional Review Board of Kyungpook National Univer- sity Hospital reviewed and approved the study protocol (No.
KNUH-09-1015). All clinical investigations were conducted in accordance with the guidelines of the 2008 Declaration of Hel- sinki. All the patients provided written informed consent prior to enrollment.
RESULTS
Demographics of KTRs who underwent indication biopsy and grouping
The mean age of the KTRs at the time of biopsy was 46.1 years and 66.7% of the KTRs were male. Patients’ clinical characteris- tics are detailed in Table 1. Chronic glomerulonephritis was the most common cause of end-stage renal disease (58.3%). One patient (4.2%) and 2 patients (8.3%) underwent crossmatch-pos- itive KT and ABO-incompatible KT, respectively. Three patients
(12.5%) had pre-existing anti-human leukocyte antigen (HLA) antibody prior to KT. Among these 3 KTRs, 1 patient had DSA.
The median time from KT to biopsy was 14 (range 0–94) months.
All KTRs (n = 24) were divided into 2 groups according to the sum scores of g + ptc (MI), i + t, ci + ct, and cv + ah assessed on the renal allograft biopsy specimens (MI = 0 vs. MI ≥ 1; i + t = 0 vs. i + t ≥ 1, ci + ct = 0 vs. ci + ct ≥ 1, cv + ah = 0 vs. cv + ah ≥ 1).
Clinical and immunologic characteristics of stable KTRs and KTRs who underwent indication biopsy based on MI sum scores
There were no significant differences in age, sex, KT types, and the number of HLA mismatches between the MI ≥ 1 group (n = 13) and the normal control group (n = 82; Table 2). No signifi- cant differences in the clinical and immunologic characteristics were observed between the 2 groups based on their MI sum scores (Table 2). Two KTRs (20.0%) in the MI = 0 group and 6 KTRs (46.2%) in the MI ≥ 1 group developed de novo DSA. There was a trend for higher median MFI of DSA in the MI ≥ 1 group compared with MI = 0 group, although the difference did not reach statistical significance. The mean of g + ptc was 3.08 ± 1.55 in the MI ≥ 1 group. In the MI ≥ 1 group (n = 13), 5 (38.5%) were acute AMR, 1 (7.7%) was chronic active AMR, 5 (38.5%) had TC- MR, 1 (7.7%) had acute and chronic interstitial nephritis, and 1 (7.7%) had a non-specific diagnosis. In the MI = 0 group (n = 11), 1 (9.1%) had TCMR, 6 (54.5%) had a non-specific diagnosis, and 2 (18.2%) had chronic CNI toxicity, 1 (9.1%) had BK virus neph- ropathy, and 1 (9.1%) had chronic transplant glomerulopathy.
Among 6 KTRs with AMR, 2 were C4d positive AMR and 4 were C4d negative AMR. There was a significant difference in the his- tological diagnosis of renal allograft between 2 groups (P = 0.004).
Comparisons of T lymphocyte subsets and HLA-DR- positive monocyte between the stable KTRs and 2 groups of KTRs who underwent indication biopsy according to the sum scores of MI
The frequencies of CD4+HLA-DR+/CD4+ T cells and CD8+HLA- DR+/CD8+ T cells at the time of biopsy were significantly incre- ased in KTRs with an MI sum score ≥ 1 (n = 13), when compared with KTRs with an MI sum score = 0 (n = 11) (26.2% [range 5.0%–
42.7%] vs. 10.3% [range 4.1%–24.1%] and 51.9% [range 18.6%–
71.8%] vs. 27.9% [range 6.2%–64.7%]; P = 0.018 and P = 0.037, respectively; Fig. 1). No significant differences were observed in the percentage of CD4+CD25+/CD4+ T cells, CD8+CD25+/CD8+ T cells, and HLA-DR+ monocytes, and HLA-DR+ monocytes MFI between the 2 groups based on the sum score of MI (MI ≥ 1 vs.
MI = 0; 6.5% [range 0.1%–12.4%] vs. 4.3% [range 0.8%–25.6%];
0.2% [range 0.0%–2.3%] vs. 0.3% [range 0.0%–2.0%]; 99.0% [range 84.0%–100.0%] vs.100.0% [range 87.0%–100.0%]; and 276.0 [range 49.0–596.0] vs. 278.0 [range 65.0–490.0], respectively; Fig. 1). The frequencies of CD4+HLA-DR+/CD4+ T cells and CD8+HLA-DR+/ Table 1. Baseline characteristics of KTRs who underwent indication biopsy
Variables Findings (n = 24)
Male sex 16 (66.7)
Mean age, yr 46.1 ± 12.4
Underlying kidney disease Chronic glomerulonephritis Diabetes
Hypertensive nephrosclerosis Cystic disease
Others
14 (58.3) 3 (12.5) 1 (4.2) 4 (16.7) 2 (8.3)
Living donor transplantation 16 (66.7)
Cross-match positive KT 1 (4.2)
ABO incompatible KT 2 (8.3)
Pre-transplant PRA positive 3 (12.5)
The median time from KT to biopsy, mon 14 (0–94) HLA mismatch number
Total
DR 3 (0–6)
1 (0–2) Induction treatment
Basiliximab 24 (100.0)
CNI Tacrolimus Cyclosporine
21 (87.5) 3 (12.5) Values are shown as mean ± standard deviation, median (range), or frequency (per- centage). The percentage PRA and antibody specificity were determined by Luminex assays and PRA > 10% was considered as positive.
KTRs = kidney transplant recipients, KT = kidney transplantation, PRA = panel reac- tive antibody, HLA = human leukocyte antigen, DR = antigen D related, CNI = calcineurin inhibitor.
CD8+ T cells were also significantly increased in KTRs with an MI sum score ≥ 1 (n = 13) compared to KTRs in the normal con- trol group (n = 82) (26.2% [range 5.0%–42.7%] vs. 13.2% [range 2.6%–39.3%] and 51.9% [range 18.6%–71.8%] vs. 37.8% [range 7.3%–73.5%]; P = 0.015 and P = 0.038, respectively; Fig. 1). How- ever, the flow cytometric results showed no difference between the MI = 0 group (n = 11) and the normal control group (n = 82).
Comparisons of T lymphocyte subsets and HLA-DR- positive monocytes by the sum scores of i + t, ci + ct, and cv + ah
When the enrolled KTRs who underwent indication biopsy were categorized according to the sum scores of i + t, ci + ct, and cv + ah, there were no significant differences in circulating T lympho- cyte subsets and HLA-DR-positive monocytes between the 2 groups (Fig. 2). The frequencies of CD4+HLA-DR+/CD4+ T cells and CD8+HLA-DR+/CD8+ T cells between the 2 groups based on the sum scores of i + t, ci + ct, and cv + ah are as follows: 1) i + t ≥ 1 vs. i + t = 0; 15.8% (range 5.0%–39.2%) vs. 10.6% (range 4.1%–
42.7%) and 49.0% (range 18.6%–71.8%) vs. 32.1% (range 6.2%–
69.9%), respectively; 2) ci + ct ≥ 1 vs. ci + ct = 0; 12.3% (range 4.1%–36.1%) vs. 22.0% (range 5.3%–42.7%) and 41.4% (range 6.2%–71.8%) vs. 41.3% (range 36.4%–69.9%), respectively; and 3) cv + ah ≥ 1 vs. cv + ah = 0; 18.5% (range 5.0%–36.1%) vs. 13.7%
(range 4.1%–42.7%) and 53.1% (range 18.6%–71.8%) vs. 36.2%
(range 6.2%–69.9%), respectively (Fig. 2).
Correlation between MI sum scores, the MFI of de novo DSA, and T lymphocyte subsets/HLA-DR positive monocytes
When we analyzed the correlations between the MI sum scores and T lymphocyte subsets/HLA-DR-positive monocytes, CD4+ HLA-DR+/CD4+ T cells were only positively correlated with MI sum scores (P = 0.016; Table 3). The MFI of de novo DSA showed a trend for an increased frequency of CD4+HLA-DR+/CD4+ T cells, although this association did not reach statistical significance (P = 0.058; Table 3).
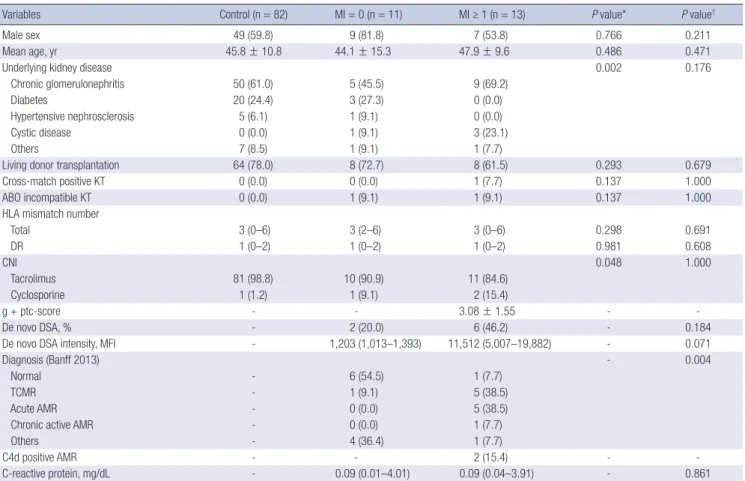
Table 2. Baseline characteristics of KTRs with stable renal function and KTRs who underwent indication biopsy based on the sum scores of MI
Variables Control (n = 82) MI = 0 (n = 11) MI ≥ 1 (n = 13) P value* P value†
Male sex 49 (59.8) 9 (81.8) 7 (53.8) 0.766 0.211
Mean age, yr 45.8 ± 10.8 44.1 ± 15.3 47.9 ± 9.6 0.486 0.471
Underlying kidney disease 0.002 0.176
Chronic glomerulonephritis 50 (61.0) 5 (45.5) 9 (69.2)
Diabetes 20 (24.4) 3 (27.3) 0 (0.0)
Hypertensive nephrosclerosis 5 (6.1) 1 (9.1) 0 (0.0)
Cystic disease 0 (0.0) 1 (9.1) 3 (23.1)
Others 7 (8.5) 1 (9.1) 1 (7.7)
Living donor transplantation 64 (78.0) 8 (72.7) 8 (61.5) 0.293 0.679
Cross-match positive KT 0 (0.0) 0 (0.0) 1 (7.7) 0.137 1.000
ABO incompatible KT 0 (0.0) 1 (9.1) 1 (9.1) 0.137 1.000
HLA mismatch number
Total 3 (0–6) 3 (2–6) 3 (0–6) 0.298 0.691
DR 1 (0–2) 1 (0–2) 1 (0–2) 0.981 0.608
CNI 0.048 1.000
Tacrolimus 81 (98.8) 10 (90.9) 11 (84.6)
Cyclosporine 1 (1.2) 1 (9.1) 2 (15.4)
g + ptc-score - - 3.08 ± 1.55 - -
De novo DSA, % - 2 (20.0) 6 (46.2) - 0.184
De novo DSA intensity, MFI - 1,203 (1,013–1,393) 11,512 (5,007–19,882) - 0.071
Diagnosis (Banff 2013) - 0.004
Normal - 6 (54.5) 1 (7.7)
TCMR - 1 (9.1) 5 (38.5)
Acute AMR - 0 (0.0) 5 (38.5)
Chronic active AMR - 0 (0.0) 1 (7.7)
Others - 4 (36.4) 1 (7.7)
C4d positive AMR - - 2 (15.4) - -
C-reactive protein, mg/dL - 0.09 (0.01–4.01) 0.09 (0.04–3.91) - 0.861
Values are shown as mean ± standard deviation (Student’s t-test), median (range; Mann-Whitney U test), or frequency (percentage). Others include chronic CNI toxicity (n = 2), acute and chronic interstitial nephritis (n = 1), BK virus nephropathy (n = 1), and chronic transplant glomerulopathy (n = 1).
KTRs = kidney transplant recipients, MI = microcirculation inflammation, KT = kidney transplantation, HLA = human leukocyte antigen, DR = antigen D related, CNI = calcineurin inhibitor, g = glomerulitis, ptc = peritubular capillaritis, DSA = donor-specific antibody, MFI = mean fluorescence intensity, TCMR = T cell mediated rejection, AMR = antibody- mediated rejection.
*Significance of the difference between normal control and MI ≥ 1; †Significance of the difference between MI = 0 and MI ≥ 1.
Identifying the intraluminal cell types in glomeruli and peritubular capillaries by immunohistochemistry
We have performed immunohistochemical cell counting in 1 TCMR with MI = 0, 4 TCMR with MI ≥ 2, and 4 AMR with MI ≥ 2.
Immune-stain for CD68+ have revealed that AMR with MI ≥ 2 have more CD68+ macrophages in glomerular and peritubular capillary compared to TCMR with MI ≥ 2 (21.1 ± 5.2 vs. 6.0 ± 2.2;
P = 0.029; Fig. 3). In contrast, the average number of CD3+ T cells in glomerular and peritubular capillary was higher in TCMR with MI ≥ 2 compared to AMR with MI ≥ 2 (22.0 ± 6.5 vs. 0.6 ± 0.5;
P = 0.029; Fig. 3). In addition, CD3+ T cells and CD68+ macro- phages in TCMR with MI = 0 were not detected in glomeruli and peritubular capillaries. Representative figures for CD3+ T cells and CD68+ macrophages in glomeruli and peritubular cap- illaries according to the histological diagnosis were presented
in the Fig. 3.
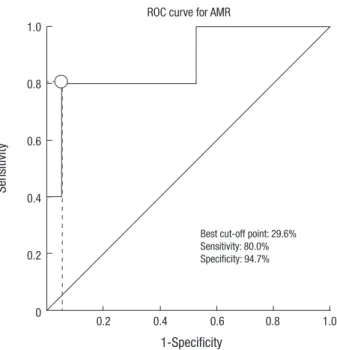
Analysis using the ROC curve for predicting AMR
Analysis using the ROC curve showed that AMR could be pre- dicted with a sensitivity of 80.0% and a specificity of 94.7% us- ing a cutoff value of 29.6% frequency of CD4+HLA-DR+/CD4+ T cells. The areas under the curve of circulating CD4+HLA-DR+/ CD4+ T cells for predicting AMR were 0.874 (Fig. 4).
DISCUSSION
The present study investigated the association between immune activation in the peripheral blood at the time of biopsy and his- topathological findings of renal allografts in KTRs who under- went indication biopsy. We found that KTRs with MI had an in- Fig. 1. Comparisons of T lymphocyte subsets and HLA-DR-positive monocyte between the stable KTRs and 2 groups of KTRs according to the sum scores of MI. The frequen- cies of CD4+HLA-DR+/CD4+ T cells and CD8+HLA-DR+/CD8+ T cells at the time of biopsy were significantly increased in KTRs with MI sum score ≥ 1 (n = 13) in KTRs with an MI sum score = 0 (n = 11; P = 0.018 and P = 0.037, respectively) as well as KTRs in the normal control group (P = 0.015 and P = 0.038, respectively).
HLA-DR = human leukocyte antigen-antigen D related, KTRs = kidney transplant recipients; MI = microcirculation inflammation, DR = antigen D related, MFI = mean fluores- cence intensity.
*P < 0.05.
% CD4+ T cells
Control
(n = 82) MI = 0
(n = 11) MI ≥ 1 (n = 13) 30
20
10
0
CD4+25+/CD4+ T cells
% CD8+ T cells
Control
(n = 82) MI = 0
(n = 11) MI ≥ 1 (n = 13) 10
8 6 4 2 0
CD8+25+/CD8+ T cells
% CD4+ T cells
Control
(n = 82) MI = 0
(n = 11) MI ≥ 1 (n = 13) 50
40 30 20 10 0
CD4+DR+/CD4+ T cells
*
*
% Monocytes
Control
(n = 82) MI = 0
(n = 11) MI ≥ 1 (n = 13) 100
95 90 85 80
DR* Monocytes
% CD8+ T cells
Control
(n = 82) MI = 0
(n = 11) MI ≥ 1 (n = 13) 80
60 40 20 0
CD8+DR+/CD8+ T cells
* *
MFI
Control
(n = 82) MI = 0
(n = 11) MI ≥ 1 (n = 13) 600
400
200
0
DR* Monocyte MFI
creased frequency of activated T lymphocytes expressing HLA- DR in the circulation compared with KTRs without MI as well as KTRs with stable renal function. However, the flow cytomet- ric analysis of circulating T lymphocyte subsets and monocytes was not found to be associated with the sum of scores of i + t, ci + ct, and cv + ah.
AMR is a major obstacle for maintaining long-term graft sur- vival in KTRs. Although the DSA titer is most commonly used
for diagnosing AMR, it has limitations as a non-invasive moni- toring tool for AMR. Not all KTRs with DSA develop AMR and certain DSA do not activate the complement cascade that drives the formation of the membrane attack complex, which damag- es the renal allograft endothelium. Therefore, more reliable, non- invasive immunologic monitoring tools for predicting AMR are needed to improve renal allograft survival.
The main target of AMR is the microcirculation endothelium Fig. 2. Comparisons of T lymphocyte subsets and HLA-DR-positive monocytes between 2 groups according to the sum scores of i + t, ci + ct, and cv + ah. When 2 groups were categorized according to the sum scores of i + t, ci + ct, and cv + ah, serum T lymphocyte subsets and HLA-DR positive monocytes showed no significant differences be- tween 2 groups.
HLA-DR = human leukocyte antigen-antigen D related, i = inflammation, t = tubulitis, ci = interstitial fibrosis, ct = tubular atrophy, cv = fibrointimal thickening, ah = arteriolar hyaline thickening, DR = antigen D related, MFI = mean fluorescence intensity.
% CD8+ T cells
i+t = 0 (n = 10)
ci+ct = 0 (n = 10)
cv+ah = 0 (n = 15) i+t ≥ 1 (n = 14)
ci+ct ≥ 1 (n = 14)
cv+ah ≥ 1 (n = 9) 2.5
2.0 1.5 1.0 0.5 0
CD8+25+/CD8+ T cells
% CD4+ T cells
i+t = 0 (n = 10)
ci+ct = 0 (n = 10)
cv+ah = 0 (n = 15) i+t ≥ 1 (n = 14)
ci+ct ≥ 1 (n = 14)
cv+ah ≥ 1 (n = 9) 30
20
10
0
CD4+25+/CD4+ T cells
% CD4+ T cells
i+t = 0 (n = 10)
ci+ct = 0 (n = 10)
cv+ah = 0 (n = 15) i+t ≥ 1 (n = 14)
ci+ct ≥ 1 (n = 14)
cv+ah ≥ 1 (n = 9) 50
40 30 20 10 0
CD4+DR+/CD4+ T cells
% Monocytes
i+t = 0 (n = 10)
ci+ct = 0 (n = 10)
cv+ah = 0 (n = 15) i+t ≥ 1 (n = 14)
ci+ct ≥ 1 (n = 14)
cv+ah ≥ 1 (n = 9) 100
95 90 85 80
DR+ Monocytes
% CD8+ T cells
i+t = 0 (n = 10)
ci+ct = 0 (n = 10)
cv+ah = 0 (n = 15) i+t ≥ 1 (n = 14)
ci+ct ≥ 1 (n = 14)
cv+ah ≥ 1 (n = 9) 80
60 40 20 0
CD8+DR+/CD8+ T cells
MFI
i+t = 0 (n = 10)
ci+ct = 0 (n = 10)
cv+ah = 0 (n = 15) i+t ≥ 1 (n = 14)
ci+ct ≥ 1 (n = 14)
cv+ah ≥ 1 (n = 9) 600
400
200
0
DR+ Monocyte MFI
Table 3. Correlation between T lymphocyte subsets/HLA-DR positive monocytes and MI and the MFI of de novo DSA
Cell subsets
MI MFI of de novo DSA
Coefficient
of correlation P value Coefficient of correlation P value CD4+CD25+/CD4+ T cells 0.062 0.774 0.071 0.867 CD8+CD25+/CD8+ T cells 0.130 0.545 −0.229 0.586 CD4+HLA-DR+/CD4+ T cells 0.486 0.016 0.690 0.058 CD8+HLA-DR+/CD8+ T cells 0.344 0.099 0.595 0.120
HLA-DR+ monocytes, % −0.360 0.084 0.246 0.558
HLA-DR MFI on monocytes −0.018 0.934 0.168 0.691
HLA-DR = human leukocyte antigen-antigen D related, MI = microcirculation inflam- mation, MFI = mean fluorescence intensity, DSA = donor-specific antibody.
Fig. 3. Intraluminal cell types in glomeruli and peritubular capillaries by immunohistochemistry. (A-D) Representative figures for CD3+ T cells (A) and CD68+ macrophages (B) in AMR with MI ≥ 2 and CD3+ T cells (C) and CD68+ macrophages (D) in TCMR with MI ≥ 2 (immunoperoxidase, original magnification × 200). (E) Comparisons of mean numbers of positive cells for CD3 and CD68 in glomerular and peritubular capillaries in biopsies with AMR with MI ≥ 2 (n = 4) versus TCMR with MI ≥ 2 (n = 4) versus TCMR with MI = 0 (n = 1). The average numbers of CD3+ T cells and CD68+ macrophages were significantly increased in TCMR with MI ≥ 2 biopsies (P = 0.029) and AMR with MI ≥ 2 biopsies (P = 0.029), respectively.
AMR = antibody-mediated rejection, MI = microcirculation inflammation, TCMR = T cell mediated rejection.
CD68 CD3
A B
CD3
C
CD68
D E
Mean number of positive cells per glomerular and peritubular capillaries
MI = 0 TCMR (n = 1)
MI = 0 TCMR (n = 1) MI ≥ 2
TCMR (n = 4)
MI ≥ 2 TCMR (n = 4) MI ≥ 2
AMR (n = 4)
MI ≥ 2 AMR (n = 4) 30
20
10
0
P = 0.029 P = 0.029
CD3+ CD68+
Fig. 4. Analysis using the ROC curve. AMR could be predicted with a sensitivity of 80.0%
and a specificity of 94.7% using a cutoff value of 29.6% frequency of CD4+HLA-DR+/ CD4+ T cells. The areas under the curve of circulating CD4+HLA-DR+/CD4+ T cells for predicting AMR was 0.874.
ROC = receiver operating characteristic, AMR = antibody-mediated rejection.
Sensitivity
1-Specificity
0.2 0.4 0.6 0.8 1.0 1.0
0.8
0.6
0.4
0.2
0
Best cut-off point: 29.6%
Sensitivity: 80.0%
Specificity: 94.7%
ROC curve for AMR
of the donor’s peritubular and glomerular capillaries (10). Local immune responses, such as antibody ligation, initiation of the complement system activation, recruitment of immune cells, endothelial damage, loss of vascular integrity, and increased coagulation occur in the microcirculation endothelium (10).
Previous studies have attempted to assess and diagnose AMR by using a microarray-based test of tissue from renal allografts (11-16). Gene expression microarray studies have reported con- sistent results that gene transcriptions related to endothelial ac- tivation and injury, T lymphocyte, natural killer cells, macropha-
ges, and cytokines were increased in AMR biopsy specimens (11-16). However, microarray-based assessment of AMR is dif- ficult to apply in clinical practice and is an invasive procedure.
Therefore, in the present study, we sought to establish a signifi- cant link between the systemic immune response and local his- topathologic injury of tissue from renal allografts.
A number of studies have attempted to discover the convinc- ing biomarkers in KTRs with acute rejection. Studies regarding messenger RNA profiles using real-time polymerase chain re- action have reported that expression of Granzyme B and perfo- rin in the peripheral blood, which are the cytotoxic T-cell mark- ers, was up-regulated during acute rejection in KTRs (17-22).
However, a recent meta-analysis regarding the significance of Granzyme B and perforin as noninvasive diagnostic biomark- ers for acute rejection have demonstrated that neither Granzyme B nor perforin alone could be a reliable noninvasive diagnostic biomarker for acute rejection in KTRs (23). Several studies have reported that pretransplant donor-specific interferon-γ-produc- ing cells detected by enzyme-linked immunosorbent spot assay (24-26), sCD30 protein before and 15-day after transplant eval- uated by enzyme-linked immunosorbent assay (27), and pre- transplant antiendothelial cell (anti-Tie-2) antibodies detected by flow cytometry (28) were associated with the development of acute rejection in KTRs. However, these peripheral blood bio- markers have not been used in clinical practice.
In our study, the frequencies of CD4+HLA-DR+/CD4+ T cells and CD8+HLA-DR+/CD8+ T cells in the peripheral blood were significantly increased in KTRs with MI but not in KTRs with i + t ≥ 1, ci + ct ≥ 1, and cv + ah ≥ 1. The sum scores of MI and i + t indicate AMR-related lesions and TCMR-related lesions, respec- tively. The sum scores ci + ct and cv + ah indicate atrophy-scar- ring-related lesions, suggesting chronic histopathological chan- ges. The results of the flow cytometric analysis of peripheral blood T lymphocyte subsets and monocytes suggest that MI is the most acute and active histopathological finding and influenced by the systemic immune response. Significant difference of the flow cytometric results between KTRs with MI and KTRs with stable renal function also confirms this result. In these 2 sub- sets, only CD4+ T lymphocytes expressing HLA-DR correlated strongly with the sum scores of MI. The ROC analysis demon- strated that circulating CD4+HLA-DR+/CD4+ T cells could be considered to be a good predictor for AMR.
According to Banff 2013 classification, as long as there are se- rologic evidence of DSAs and C4d staining in peritubular capil- laries, AMR can be diagnosed with an MI sum score ≥ 1 (g > 0 and/or ptc > 0) (2). In the study by Sis et al. (29) including 329 indication biopsies from 251 renal allograft recipients, any de- gree of MI (g + ptc > 0) in late kidney transplant biopsies strong- ly indicates presence of DSA and predicts progression to graft failure. Loupy et al. (30) have reported that KTRs with C4d-neg- ative subclinical AMR at 3 months (defined as g + ptc > 0) had
more ptc and ci and ct and a lower glomerular filtration rate at 1 year compared to those without subclinical lesions at 3 months.
Like these, previous studies have demonstrated the clinical sig- nificance of any degree of MI. And so, we used an MI sum score
≥ 1 as a cutoff value. Moreover, in our study, the frequencies of CD4+HLA-DR+/CD4+ T cells at the time of biopsy were also sig- nificantly increased in KTRs with an MI sum score ≥ 2 (n = 9), when compared with KTRs with an MI sum score = 0 (n = 11) (30.5% vs. 10.3%; P = 0.038).
Among KTRs with MI ≥ 1, 5 patients (38.5%) were diagnosed with acute AMR and 5 patients (38.5%) were diagnosed with TCMR. This result reflects that MI is not a specific histopatho- logical feature for AMR and increased activities of T lymphocyte do not always confirm the presence of AMR. Therefore, the mon- itoring of circulating CD4+HLA-DR+/CD4+ T cells in conjunc- tion with DSA could maximize the assessment and diagnosis of AMR in KTRs.
T lymphocytes, especially CD4+ T cells, are activated by the recognition of donor major histocompatibility complex antigens displayed by the endothelium, and subsequently contribute to the production of alloantibodies. Activation of the complement cascade by DSA leads to the formation of C3b, C3a, C5b, and C5a. These major effector molecules result in the formation of the membrane attack complex and activation of endothelial cells and T lymphocytes, which further amplifies the immune response (31-33). This immune process can eventually cause histopathological changes and injury in renal allografts. Among circulating immune cells, T lymphocytes are closely related to renal parenchymal damage, considering the crucial role of this cell-type which plays in the initiation and amplification of the overall immune response. Hayde et al. (11) have reported in- creased serum immune activities involving the activation, regu- lation, and differentiation of T lymphocytes only in DSA-posi- tive/AMR-positive KTRs, but not in DSA-positive/AMR-nega- tive KTRs. These findings are in agreement with those from our study, in that increased immune activity in the peripheral blood is a crucial trigger that alters histopathological findings in the renal allograft in KTRs. Taken together, these results suggest that systemic immune activation might precede the active intragraft immune response.
Previous studies dealing with the intragraft immune reaction in KTRs have demonstrated the infiltration of T cells, monocytes, and HLA-DR expressing cells in renal allografts with rejection (4-6). In rejected renal allografts, the extent of infiltrates of T lym- phocytes in the glomerulus and vascular endothelium and mono- cytes expressing HLA-DR increased with the severity of rejec- tion (5,6). Expression of HLA-DR antigens in the graft was con- sidered to be an indicator of immune inflammation and a start- ing point for the rejection response. Previous studies assessing the immune status of peripheral blood reported that a low ex- pression of HLA-DR antigens in the peripheral monocytes was
associated with increased infectious complications in solid or- gan transplant recipients, which implied that decreased HLA- DR expression is an indicator of generalized monocyte dysfunc- tion (34,35). These results correspond to those from other im- munohistological studies, in that a significant connection exists between the expression of HLA-DR and an activated immune status. However, the clinical relevance of HLA-DR expressing immune cells in the peripheral blood, which might precede the local immune changes in KTRs with allograft dysfunction, is not well known.
We performed immunohistochemical cell counting for CD3+ and CD68+ to identify how these immune cells in the biopsies correlate with HLA-DR+ T cells in the peripheral blood. Among biopsy specimens with higher MI sum scores which mean in- creased circulating T lymphocytes expressing HLA-DR, the av- erage numbers of CD3+ T cells and CD68+ macrophages were significantly increased in TCMR and AMR, respectively. Our find- ings of immunohistochemical stain showed consistent with the results of previous studies. Previous studies conducted by Sis et al. (29) and Hidalgo et al. (14) have also demonstrated that CD3+ T cells in glomeruli or peritubular capillaries were predominant in TCMR biopsies and CD68+ macrophages in AMR biopsies.
This result can be explained by interactions between CD4+ T cells and macrophages. Interferon-γ produced by CD4+ T cells, along with tumor necrosis factor from antigen-presenting cells, can induce classically activated macrophages, which secrete interleukin-1 (IL-1), IL-6, IL-12, IL-18, and IL-23 (36). Activated macrophages during acute rejection promote inflammation and induce tissue damage by secreting a large number of cyto- kines, nitric oxide, and superoxide (37). Although multiple cell types infiltrated renal allografts, macrophage infiltration was associated with renal allograft dysfunction (6,38) and renal tu- bular stress, as indicated by HLA-DR expression, while T cell infiltration was not (6). It is possible to speculate that the rela- tionship between activated T cells and macrophage give rise to microvascular injury of renal allografts in KTRs with AMR.
Though the findings from our study are clinically significant, this study is not without limitations. First, the sample size is small.
Further large-scale, multicenter studies are needed to confirm the results of our study. Second, the alteration of systemic im- mune activity and histopathologic findings after treatment of acute rejection were not defined. Further studies are needed to demonstrate the changes of the immune activity in peripheral blood and histopathologic findings by performing serial blood sampling and protocol biopsy. Third, the best cutoff point of CD4+HLA-DR+/CD4+ T cells have not been validated in a sepa- rate independent cohort. Further validation of this immunolog- ic marker is needed in large-scale cohort. Fourth, we did not perform protocol biopsies for KTRs with stable renal function, which would have yielded more useful results. Therefore, we cannot completely exclude the possibility that MI and chronic
scarring changes can be present in KTRs with stable renal func- tion. However, the strength of this study is that we demonstrat- ed the association between the histopathological findings of al- lograft and systemic immune activation at the time of indica- tion biopsy and identified a useful, noninvasive immunologic monitoring tool for the prediction of AMR in KTRs. To the best of our knowledge, this is the first report to reveal the significant association between MI and an increased frequency of circulat- ing CD4+ T lymphocytes expressing HLA-DR.
In conclusion, HLA-DR expressing CD4+ T lymphocytes in the peripheral blood are an index of systemic immune activa- tion in KTRs and are associated with histopathological injury of renal allografts. Early diagnosis and prompt treatment are es- sential for rescuing grafts with suspected AMR. Monitoring and detection of circulating CD4+HLA-DR+/CD4+ T cells with DSA in KTRs could reduce the burden of graft damage induced by AMR. This study provides the basis for future investigations deal- ing with activated T lymphocytes as a monitoring tool and po- tential therapeutic target for AMR in KTRs.
ACKNOWLEDGMENT
The abstract of this study has been selected as one of the top oral abstracts by trainees for the American Society of Nephrology Kid- ney Week 2015 Annual Meeting, November 5–8 in San Diego, CA, USA.
DISCLOSURE
The authors have no potential conflicts of interest to disclose.
AUTHOR CONTRIBUTION
Conceptualization: Jung HY, Kim CD. Data curation: Choi JY, Cho JH, Park SH, Kim YL, Kim HK, Huh S. Formal analysis: Jung HY, Kim YJ, Won DI, Kim CD. Funding acquisition: Kim YL, Kim CD. Investigation: Jung HY, Kim YJ, Won DI, Kim CD. Writing - original draft: Jung HY, Kim CD. Writing - review & editing: Jung HY, Kim CD.
ORCID
Hee-Yeon Jung http://orcid.org/0000-0003-0232-7202 Yong-Jin Kim http://orcid.org/0000-0002-9867-0752 Ji-Young Choi http://orcid.org/0000-0002-9774-3665 Jang-Hee Cho http://orcid.org/0000-0002-7031-5214 Sun-Hee Park http://orcid.org/0000-0002-0953-3343 Yong-Lim Kim http://orcid.org/0000-0002-1344-3455 Hyung-Kee Kim http://orcid.org/0000-0002-4436-7424 Seung Huh http://orcid.org/0000-0002-0275-4960 Dong Il Won http://orcid.org/0000-0002-1983-2515
Chan-Duck Kim http://orcid.org/0000-0002-4648-0324
REFERENCES
1. Einecke G, Sis B, Reeve J, Mengel M, Campbell PM, Hidalgo LG, Kaplan B, Halloran PF. Antibody-mediated microcirculation injury is the major cause of late kidney transplant failure. Am J Transplant 2009; 9: 2520-31.
2. Haas M, Sis B, Racusen LC, Solez K, Glotz D, Colvin RB, Castro MC, Da- vid DS, David-Neto E, Bagnasco SM, et al. Banff 2013 meeting report: in- clusion of c4d-negative antibody-mediated rejection and antibody-asso- ciated arterial lesions. Am J Transplant 2014; 14: 272-83.
3. de Kort H, Willicombe M, Brookes P, Dominy KM, Santos-Nunez E, Galli- ford JW, Chan K, Taube D, McLean AG, Cook HT, et al. Microcirculation inflammation associates with outcome in renal transplant patients with de novo donor-specific antibodies. Am J Transplant 2013; 13: 485-92.
4. Tufveson G, Forsum U, Claesson K, Klareskog L, Larsson E, Karlsson-Par- ra A, Frödin L. T-lymphocyte subsets and HLA-DR-expressing cells in re- jected human kidney grafts. Scand J Immunol 1983; 18: 37-40.
5. Bishop GA, Hall BM, Duggin GG, Horvath JS, Sheil AG, Tiller DJ. Immu- nopathology of renal allograft rejection analyzed with monoclonal anti- bodies to mononuclear cell markers. Kidney Int 1986; 29: 708-17.
6. Girlanda R, Kleiner DE, Duan Z, Ford EA, Wright EC, Mannon RB, Kirk AD. Monocyte infiltration and kidney allograft dysfunction during acute rejection. Am J Transplant 2008; 8: 600-7.
7. Le Meur Y, Jose MD, Mu W, Atkins RC, Chadban SJ. Macrophage colony- stimulating factor expression and macrophage accumulation in renal al- lograft rejection. Transplantation 2002; 73: 1318-24.
8. Beik AI, Bateman WJ, Morris AG, Higgins RM, Lam FT. Monitoring of T- lymphocyte subsets in acute renal allograft rejection. Transplant Proc 1998; 30: 168-71.
9. Kim SH, Oh EJ, Ghee JY, Song HK, Han DH, Yoon HE, Choi BS, Yoon SK, Choi JY, Moon IS, et al. Clinical significance of monitoring circulating CD4+
CD25+ regulatory T cells in kidney transplantation during the early post- transplant period. J Korean Med Sci 2009; 24 Suppl: S135-42.
10. Sis B, Halloran PF. Endothelial transcripts uncover a previously unknown phenotype: C4d-negative antibody-mediated rejection. Curr Opin Or- gan Transplant 2010; 15: 42-8.
11. Hayde N, Broin PO, Bao Y, de Boccardo G, Lubetzky M, Ajaimy M, Pull- man J, Colovai A, Golden A, Akalin E. Increased intragraft rejection-asso- ciated gene transcripts in patients with donor-specific antibodies and normal biopsies. Kidney Int 2014; 86: 600-9.
12. Mueller TF, Einecke G, Reeve J, Sis B, Mengel M, Jhangri GS, Bunnag S, Cruz J, Wishart D, Meng C, et al. Microarray analysis of rejection in hu- man kidney transplants using pathogenesis-based transcript sets. Am J Transplant 2007; 7: 2712-22.
13. Sis B, Jhangri GS, Bunnag S, Allanach K, Kaplan B, Halloran PF. Endothe- lial gene expression in kidney transplants with alloantibody indicates an- tibody-mediated damage despite lack of C4d staining. Am J Transplant 2009; 9: 2312-23.
14. Hidalgo LG, Sis B, Sellares J, Campbell PM, Mengel M, Einecke G, Chang J, Halloran PF. NK cell transcripts and NK cells in kidney biopsies from pa- tients with donor-specific antibodies: evidence for NK cell involvement in antibody-mediated rejection. Am J Transplant 2010; 10: 1812-22.
15. Sellarés J, Reeve J, Loupy A, Mengel M, Sis B, Skene A, de Freitas DG, Kree-
pala C, Hidalgo LG, Famulski KS, et al. Molecular diagnosis of antibody- mediated rejection in human kidney transplants. Am J Transplant 2013;
13: 971-83.
16. Halloran PF, Pereira AB, Chang J, Matas A, Picton M, De Freitas D, Brom- berg J, Serón D, Sellarés J, Einecke G, et al. Microarray diagnosis of anti- body-mediated rejection in kidney transplant biopsies: an international prospective study (INTERCOM). Am J Transplant 2013; 13: 2865-74.
17. Aquino-Dias EC, Joelsons G, da Silva DM, Berdichevski RH, Ribeiro AR, Veronese FJ, Gonçalves LF, Manfro RC. Non-invasive diagnosis of acute rejection in kidney transplants with delayed graft function. Kidney Int 2008;
73: 877-84.
18. Graziotto R, Del Prete D, Rigotti P, Anglani F, Baldan N, Furian L, Valente M, Antonello A, Marchini F, D’Angelo A, et al. Perforin, granzyme B, and fas ligand for molecular diagnosis of acute renal-allograft rejection: anal- yses on serial biopsies suggest methodological issues. Transplantation 2006; 81: 1125-32.
19. Veale JL, Liang LW, Zhang Q, Gjertson DW, Du Z, Bloomquist EW, Jia J, Qian L, Wilkinson AH, Danovitch GM, et al. Noninvasive diagnosis of cel- lular and antibody-mediated rejection by perforin and granzyme B in re- nal allografts. Hum Immunol 2006; 67: 777-86.
20. Simon T, Opelz G, Wiesel M, Ott RC, Süsal C. Serial peripheral blood per- forin and granzyme B gene expression measurements for prediction of acute rejection in kidney graft recipients. Am J Transplant 2003; 3: 1121-7.
21. Sabek O, Dorak MT, Kotb M, Gaber AO, Gaber L. Quantitative detection of T-cell activation markers by real-time PCR in renal transplant rejection and correlation with histopathologic evaluation. Transplantation 2002;
74: 701-7.
22. Townamchai N, Safa K, Chandraker A. Immunologic monitoring in kid- ney transplant recipients. Kidney Res Clin Pract 2013; 32: 52-61.
23. Heng B, Li Y, Shi L, Du X, Lai C, Cheng L, Su Z. A meta-analysis of the sig- nificance of granzyme b and perforin in noninvasive diagnosis of acute rejection after kidney transplantation. Transplantation 2015; 99: 1477- 86.
24. Näther BJ, Nickel P, Bold G, Presber F, Schönemann C, Pratschke J, Volk HD, Reinke P. Modified ELISPOT technique--highly significant inverse correlation of post-Tx donor-reactive IFNgamma-producing cell frequen- cies with 6 and 12 months graft function in kidney transplant recipients.
Transpl Immunol 2006; 16: 232-7.
25. Augustine JJ, Siu DS, Clemente MJ, Schulak JA, Heeger PS, Hricik DE. Pre- transplant IFN-gamma ELISPOTs are associated with post-transplant re- nal function in African American renal transplant recipients. Am J Trans- plant 2005; 5: 1971-5.
26. Nickel P, Presber F, Bold G, Biti D, Schönemann C, Tullius SG, Volk HD, Reinke P. Enzyme-linked immunosorbent spot assay for donor-reactive interferon-gamma-producing cells identifies T-cell presensitization and correlates with graft function at 6 and 12 months in renal-transplant re- cipients. Transplantation 2004; 78: 1640-6.
27. Sengul S, Keven K, Gormez U, Kutlay S, Erturk S, Erbay B. Identification of patients at risk of acute rejection by pretransplantation and posttransplan- tation monitoring of soluble CD30 levels in kidney transplantation. Trans- plantation 2006; 81: 1216-9.
28. Breimer ME, Rydberg L, Jackson AM, Lucas DP, Zachary AA, Melancon JK, Von Visger J, Pelletier R, Saidman SL, Williams WW Jr, et al. Multicenter evaluation of a novel endothelial cell crossmatch test in kidney transplan- tation. Transplantation 2009; 87: 549-56.
29. Sis B, Jhangri GS, Riopel J, Chang J, de Freitas DG, Hidalgo L, Mengel M, Matas A, Halloran PF. A new diagnostic algorithm for antibody-mediated microcirculation inflammation in kidney transplants. Am J Transplant 2012; 12: 1168-79.
30. Loupy A, Suberbielle-Boissel C, Hill GS, Lefaucheur C, Anglicheau D, Zu- ber J, Martinez F, Thervet E, Méjean A, Charron D, et al. Outcome of sub- clinical antibody-mediated rejection in kidney transplant recipients with preformed donor-specific antibodies. Am J Transplant 2009; 9: 2561-70.
31. Stegall MD, Chedid MF, Cornell LD. The role of complement in antibody- mediated rejection in kidney transplantation. Nat Rev Nephrol 2012; 8:
670-8.
32. Heeger PS, Kemper C. Novel roles of complement in T effector cell regu- lation. Immunobiology 2012; 217: 216-24.
33. Dunkelberger JR, Song WC. Role and mechanism of action of complement in regulating T cell immunity. Mol Immunol 2010; 47: 2176-86.
34. Haveman JW, van den Berg AP, van den Berk JM, Mesander G, Slooff MJ, de Leij LH, The TH. Low HLA-DR expression on peripheral blood mono- cytes predicts bacterial sepsis after liver transplantation: relation with pred- nisolone intake. Transpl Infect Dis 1999; 1: 146-52.
35. Hoffman JA, Weinberg KI, Azen CG, Horn MV, Dukes L, Starnes VA, Woo MS. Human leukocyte antigen-DR expression on peripheral blood mono- cytes and the risk of pneumonia in pediatric lung transplant recipients.
Transpl Infect Dis 2004; 6: 147-55.
36. Mosser DM, Edwards JP. Exploring the full spectrum of macrophage acti- vation. Nat Rev Immunol 2008; 8: 958-69.
37. Rowshani AT, Vereyken EJ. The role of macrophage lineage cells in kidney graft rejection and survival. Transplantation 2012; 94: 309-18.
38. Tinckam KJ, Djurdjev O, Magil AB. Glomerular monocytes predict worse outcomes after acute renal allograft rejection independent of C4d status.
Kidney Int 2005; 68: 1866-74.