INTRODUCTION
Atherosclerosis is a complex of chronic inflammation of vessel wall. It primarily affects large elastic arteries (e.g., aorta) and medium-sized muscular arteries (e.g., coronary arteries).
Atherosclerosis of large elastic arteries has been known to antedate those of muscular arteries. It progressively develops degeneration of the vessel wall. In case of abdominal aorta, atherosclerosis seldom causes symptomatic aneurysms and infrequently it ruptures, especially in elderly men. Rupture of an abdominal aortic aneurysm causes 1-2% of all deaths in men over 65 yr of age in developed countries (1). However, aneurysm in elderly women reveals a higher rupture rate and more severe than in men (2). Nevertheless women are gen- erally not considered for aneurysmal rupture since they not only have a lower prevalence of the disease and but also devel- op the disease later in life (3, 4). It has generally been consid- ered that Korean people have few atherosclerotic disease com- pared to Western countries. However, atherosclerosis-associ- ated diseases such as coronary heart disease and stroke be- come a leading cause of morbidity and mortality in Korea since there has been substantial changes in lifestyle influenced by the Western culture. Atherosclerosis-related epidemic pro-
portion may enough to increase socioeconomic burden and many serious problems especially in the young and middle- aged people, but the data on atherosclerosis in women in Korea are limited.
Atherosclerotic vascular changes may be associated with various risk factors. Age, gender (estrogen deficiency), cigarette smoking, obesity, physical inactivity, lipid disorders, hyper- tension, and insulin resistance are known risk factors that accelerate the development of atherosclerosis (5, 6). Among these factors, obesity, high body weight, and weight gain have been related to an increased risk of clinical events of athero- sclerotic diseases (7-9). A recent report described that west- ernization of Korean lifestyle may increase the prevalence of weight gain or overall obesity and resultant cardiovascular diseases (10). However, there have been few well-designed autopsy-based comparative as well as population-based quan- titative studies on atherosclerotic lesions for Korean women regarding the association of biological variables including age and body size.
The objectives of the present study were to determine re- gional differences of atherosclerotic lesion in the aorta and to assess the relationship between biological variables and athe- rosclerosis of the aorta in Korean women.
Joong Seok Seo, Sang Yong Lee*, Ho-dirk Kim�
Department of Forensic Medicine, National Institute of Scientific Investigation, Seoul; Institute of Forensic Medicine*, Pusan National University School of Medicine, Busan; Department of Anatomy (Cardiovascular Research Unit)�, Sungkyunkwan University School of Medicine, Suwon, Korea
Address for correspondence Ho-dirk Kim, M.D.
Department of Anatomy, Sungkyunkwan University School of Medicine, Suwon 440-746, Korea Tel : +82.31-299-6071, Fax : +82.31-299-6089 E-mail : [email protected]
*The present study was supported in part by the Samsung Biomedical Research Institute (Grant No.
B-A4-301), 2004-2005, Seoul, Korea.
536
Quantitative Analysis of Aortic Atherosclerosis in Korean Female:
A Necropsy Study
To assess the regional difference and influence of the biological variables on athe- rosclerosis in female, we analyzed 7 segments of aorta (2 ascending, 3 thoracic, and 2 abdominal) from 90 superficially healthy Korean women (39±±14 yr of age) who died from external causes. Tissue specimens were macroscopically examined and histopathologically divided into 7 grades for scoring (ATHERO, from 0=intact, to 6=thrombi formation). Lumen diameter (LD), wall thickness (WT), intima thickness (INT), and media thickness (MED) were obtained by computed morphometry. Athe- rosclerosis was common in the distal infrarenal (C2), proximal thoracic (B1), and proximal ascending (A1) segments. Total 95.6% of all subjects had atherosclerosis of variable degree in one or more segments, but an aneurysmal change was not found. The number of atherosclerotic segments and atherosclerosis score in the 7 segments increased with aging. However, the body size did not affect the aortic size and ATHERO. With aging, LD and INT of the A1, B1 and C2 increased (p<
.00001); WT of the B1 and C2 increased (p<.01); and MED of C2 decreased (p<
.01). LD and WT of the B1 and C2 (p<.05), INT of the A1, B1 and C2 (p<.00001) in- creased, and MED of C2 decreased (p<.01) with ATHERO. These data suggest that age is simple but a reliable parameter for estimating the progression of athe- rosclerosis.
Key Words : Age; Aorta; Atherosclerosis; Body Size; Morphometry
Received : 16 May 2006 Accepted : 27 November 2006
MATERIALS AND METHODS Preparation of aortic tissues and microscopy
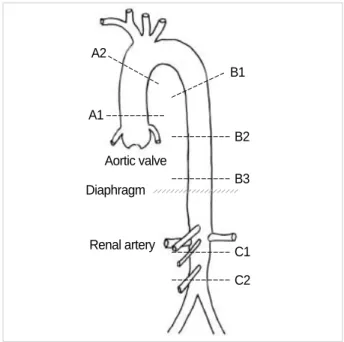
The study protocol conformed to an ethical guideline by the institutes. The study subjects consisted of 90 Korean female aged from 15 to 81 (mean±SD, 39±14) yr who died from external causes (accidental injuries, homicides, or suicides) between 1998 and 2002 (Table 1). They lived in metropolitan and urban areas. They were harvested at autop- sy within a day after death. They were superficially healthy in appearance; had no evidence of putrefaction; and did not have specific diseases or neoplasms. Aorta from the commen- cement to the level of bifurcation of common iliac arteries was investigated. The aortas were opened longitudinally, and the interiors were macroscopically examined for fatty streak, raised lesion, plaque, and thrombus. As shown in the Fig. 1, aortic tissues were carefully excised perpendicular to the long axis from 7 segments: 2.5 cm above the aortic valve (A1), 1 cm before the branching of brachiocephalic trunk (A2), bet- ween the 4th and 5th thoracic vertebrae (B1), between the 8th and 9th thoracic vertebrae (B2), upper level of 12th tho- racic vertebra (B3), proximal infrarenal (C1), and distal in- frarenal aorta. Five m-thick paraffin sections perpendicular to the long axis of the vessel were prepared and stained with hematoxylin and eosin for general examination, and with the Verhoeff-van Gieson technique for quantitative examination.
Sections were histopathologically graded for scoring: 0 (intact histology), 1 (isolated macrophage, foam cells), 2 (intracel- lular lipid accumulation), 3 (grade 2+small extracellular lipid pools), 4 (grade 2+core of extracellular lipid), 5 (lipid core and fibrotic layer, or multiple lipid cores and fibrotic layers, or mainly calcific, or mainly fibrotic, i.e., fibroatheroma), and 6 (surface defect, hematoma-hemorrhage, and thrombus, i.e., complicated lesion), according to a modified criteria adopted from a previous study (11). Sections that showed normal his- tology or histology between normal and adaptive thickening (without isolated macrophage or foam cells) in the intima were considered grade 0; sections that showed a borderline change were considered lower grade. Sections that showed intact histology were determined as ‘normal’.
The prevalence rate of atherosclerotic change, age, and
atherosclerosis score was compared between each segment of the same subject, and between numbers of segment with atherosclerotic change of different subjects. Age, gender, body height, body weight, body surface area (BSA), and body mass index (BMI) were also considered for comparison between the normal and atherosclerosis subjects.
Measurement of aortic sizes
Each Verhoeff-van Gieson-stained section was projected onto a digitizing table for computed morphometry. Contours of the lumen, internal elastic lamina, and outer media (delin- eated by external elastic lamina) were traced. Quantitative measures of the lumen circumference, internal elastic lami- na circumference, and outer (media) circumference were ob- tained. Means of the lumen diameter (LD), wall thickness (WT, i.e., intima-media thickness), intima thickness (INT), and media thickness (MED) were calculated by: circumfer- ence=diameter× . The contour of adventitia was not con- sidered for outer diameter because it was flexible by fixation (error of measurement was more than 15%). This morpho- metric method is simple but reliable to get averages of aor- tic size with lesser deviation. Measurements were made by three trained persons and a correction factor (1.07) of mea- surement was considered.
Statistics
Data were expressed as mean±SD. Data between each seg- ment and between numbers of segment with atherosclerotic change were compared by ANOVA. Differences were con- sidered significant if p values were less than .05. For deter- mination of the relationship between atherosclerosis score,
BMI, body mass index; BSA, body surface area.
Age group (yr)
Body height (cm)
Body
weight (kg) BSA (m2) BMI (kg/m2) 15-19 (n=4) 159±5 51±11 1.50±.17 20.00±3.15 20-29 (n=18) 159±5 49±7 1.48±.11 19.39±2.45 30-39 (n=29) 157±5 56±8 1.55±.11 22.47±3.43 40-49 (n=17) 157±4 55±11 1.54±.14 22.37±4.01 50-59 (n=13) 155±4 50±6 1.47±.08 21.01±2.47
>59 (n=9) 155±4 47±10 1.42±.14 19.88±4.39 Table 1.General data of subjects examined in the current study (mean±SD)
Fig. 1. Schematic illustration of the sites of specimen collection.
C2 C1 B3 B2 B1
A1
Aortic valve Diaphragm
Renal artery A2
Atherosclerosis score 6 5 4 3 2 1 0
<2020-2930-3940-4950-59>59 <2020-2930-3940-4950-59>59 <2020-2930-3940-4950-59>59 <2020-2930-3940-4950-59>59 <2020-2930-3940-4950-59>59 <2020-2930-3940-4950-59>59 <2020-2930-3940-4950-59>59
Atherosclerosis score
6 5 4 3 2 1 0
<150
150-159 >159 <150
150-159 >159 <150
150-159 >159 <150
150-159 >159 <150
150-159 >159 <150
150-159 >159 <150
150-159 >159
Atherosclerosis score
6 5 4 3 2 1 0
<4040-4950-59>60 <4040-4950-59>60 <4040-4950-59>60 <4040-4950-59>60 <4040-4950-59 >60 <4040-4950-59>60 <4040-4950-59>60
Atherosclerosis score
6 5 4 3 2 1 0
<1.4
1.4-1.491.5-1.59>1.59 <1.4
1.4-1.491.5-1.59>1.59 <1.4
1.4-1.491.5-1.59 >1.59
1.4-1.49
<1.4
1.5-1.59>1.59 <1.4
1.4-1.491.5-1.59>1.59 <1.4
1.4-1.491.5-1.59>1.59 <1.4 1.5-1.59 1.4-1.49 >1.59
Atherosclerosis score
6 5 4 3 2 1 0
<2323-25 >25 <2323-25 >25 <2323-25 >25 <2323-25 >25 <2323-25 >25 <2323-25 >25 <2323-25 >25
A1
Age (yr)
Body height (cm)
Body weight (kg)
Body surface area (m2)
Body mass index (kg/m2)
A2 B1 B2 B3 C1 C2
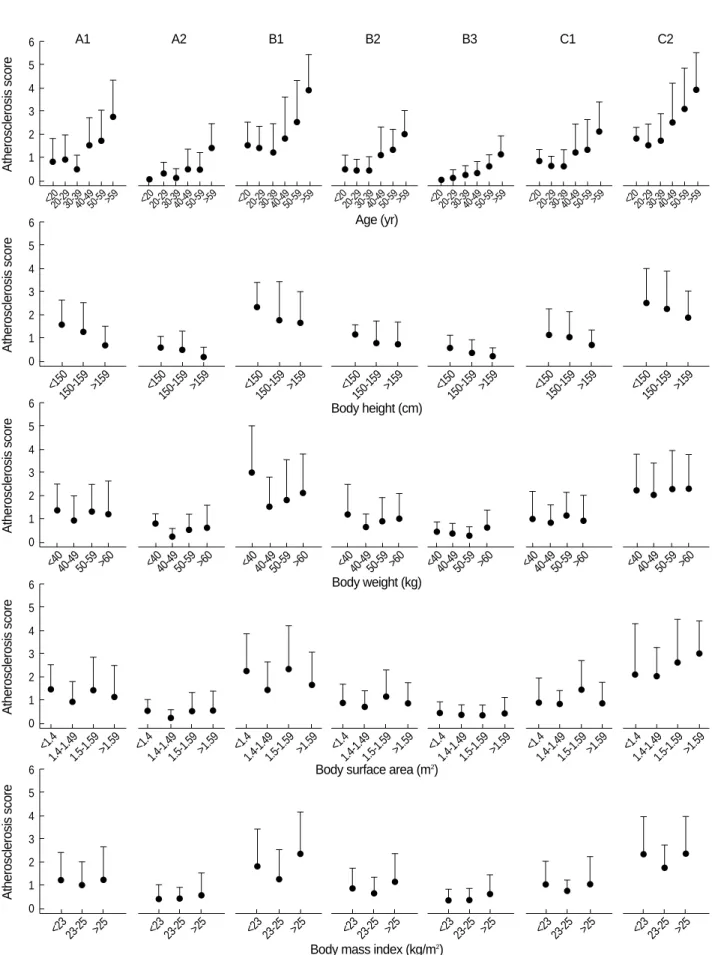
Fig. 2.Changes of the atherosclerosis score in the seven segments related with age, body height, body weight, body surface area, and body mass index (mean±SD).
age and body size, and between aortic size, age and BMI, Pearson correlation coefficients were computed and multi- ple regression analyses were done.
RESULTS Atherosclerotic change in each segment
As shown in Table 1, biological variables were not signifi- cantly different between age groups. By macroscopic exami- nation, fatty streaks were focally found but dispersed along the vessel wall in association with raised lesions and plaques with aging. Total 95.6% of all subjects had atherosclerotic changes of variable degree in one or more segments; intact histology in all segments was extremely rare. Numbers of subjects who showed an atherosclerotic change and calcified fibroatheroma according to the segment is summarized in Table 2. Atherosclerotic changes (score 1-4) were frequently seen in the A1, B1, B2, C1 and C2 segments, and fibroa- theroma (score 5-6) was frequently seen in the B1 and C2 segments. Total 23.3% of all subjects had atherosclerotic changes in 1 or 2 segments, 27.8% of subjects in 3 or 4 seg-
ments, 11.1% of subjects in 5 segments, and 44.4% of sub- jects in more than 5 segments.
As shown in table 3, plaques were found in 14 subjects (15.6%): one segment in 11 subjects (12.2%), 2 segments in 2 subjects (2.2%), and 3 segments in 1 subject (1.1%).
Thrombi were found in 3 subjects (3.3%).
As shown in Fig. 2, the atherosclerosis score had a singnifi- cant positive relationship in all segments with age (A1, r=
.52, p<.00001; A2, r=.54, p<.00001; B1, r=.49, p<.00001;
B2, r=.53, p<.00001; B3, r=.56, p<.00001; C1, r=.47, p<.00001;
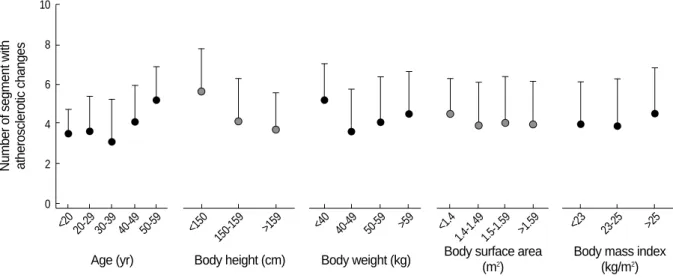
C2, r=.52, p<.00001). However, the atherosclerosis score did not show a significant relationship with body height (A1, r=-.15, p>.1; A2, r=-.12, p>.1; B1, r=-.08, p>.1; B2, r=-.05, p>.5; B3, r=-.13, p>.1; C1, r=-.06, p>.5; C2, r=-.05, p>.5), body weight (A1, r=-.03, p>.5; A2, r=-.02, p>.5; B1, r=-.03, p>.5; B2, r=-.03, p>.5; B3, r=.04, p>.5; C1, r=.01, p>.5; C2, r=.03, p>.5), BSA (A1, r=-.07, p>.5; A2, r=-.02, p>.5; B1, r=-.07, p>.5; B2, r=-.002, p>.5; B3, r=-.01, p>.1; C1, r=-.01, p>.5; C2, r=.02, p>.5) and with BMI (A1, r=.02, p>.5; A2, r=.07, p>.5; B1, r=-.01, p>.5; B2, r=.04, p>.5; B3, r=.10, p>.1; C1, r=.03, p>.5; C2, r=.05, p>.5). The number of seg- ments with atherosclerotic changes had a significant positive relationship with age (r=.52, p<.00001; Fig. 3), but it did not show a significant relationship with body height (r=-.12, p>.1), body weight (r=-.02, p>.5), BSA (r=-.06, p>.5), or
Numbers in parentheses indicate the number of subject which shows fibroatheroma.
Age (yr) Segment
A1 A2 B1 B2 B3 C1 C2
<20 2 0 3 2 0 3 4
20-29 10 5 14 8 2 11 14
30-39 12 4 18 10 6 16 23
40-49 14 (1) 6 12 (2) 9 5 11 15 (3)
50-59 11 6 10 (2) 11 8 10 13 (4)
>60 9 (2) 9 9 (2) 9 8 9 9 (3)
Table 2.Number of subjects which had atherosclerotic change
Parentheses indicate the segment that showed atherosclerotic changes.
Number of segment
Number of subjects and the segment
Plaque 1 6 (C2), 4 (B1), 1 (A1)
2 2 (B1+C2)
3 1 (A1+B1+C2)
Plaque+thrombus 1 2 (C2)
3 1 (A1+B1+C2)
Table 3.Number of subjects and site of plaque and thrombus formation according to the number of atherosclerotic segments
Fig. 3.Number of segments with atherosclerotic changes related with age and body size (mean±SD).
<2020-29 30-39 50-59 <150
150-159 >159 <40 40-49 50-59 >59 <1.4
1.4-1.49 1.5-1.59 >1.59 <23 23-25 >25
40-49
Age (yr) Body height (cm) Body weight (kg) Body surface area (m2)
Body mass index (kg/m2) Number of segment with atherosclerotic changes
10
8
6
4
2
0
with BMI (r=.02, p>.5).
Atherosclerosis and aortic size
We measured the aortic size in 3 segments, i.e., ascend- ing A1, thoracic B1, and abdominal infrarenal C2, in which atherosclerosis with fibrous atheroma was relatively preva- lent.
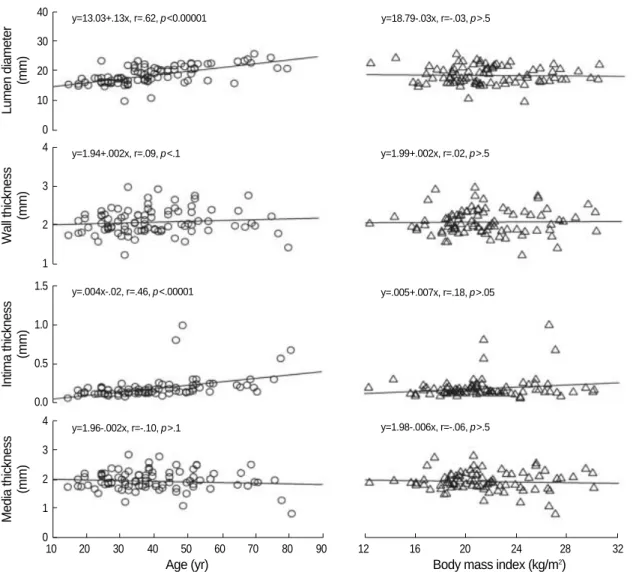
In A1 segments, LD and INT increased with age (LD, r=
.62, p<.00001; INT, r=.46, p<.00001; Fig. 4), but WT and MED was not well related with age (WT, r=-.09, p>.1; MED, r=-.10, p>.1). However, the aortic size was not well related with BMI (LD, r=-.03, p>.5; WT, r=.02, p>.5; INT, r=.18, p>.05; MED, r=-.06, p>.5; Fig. 4). In B1 segments, LD, WT and INT increased with age (LD, r=.72, p<.00001; WT, r=
.61, p<.00001; INT, r=.70, p<.00001; Fig. 5, but MED was not well related with age (r=.17, p>.1). However, the aortic size was not well related with BMI (LD, r=.07, p>.1; WT, r=.12, p>.1; INT, r=.12, p>.1; MED, r=.05, p>.5; Fig. 5).
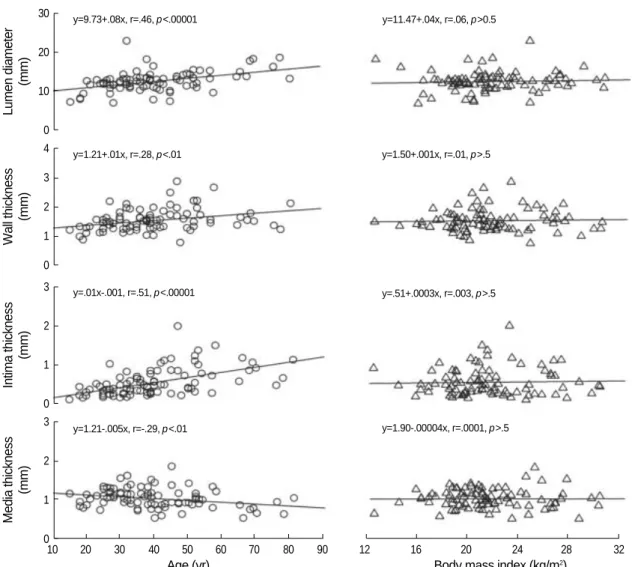
In C2 segments, LD, WT and INT significantly increased
(LD, r=.46, p<.00001; WT, r=.28, p<.01; INT, r=.51, p<
.00001), and MED decreased (r=-.29, p<.01) with increas- ing age (Fig. 6). However, the aortic size was not well relat- ed with BMI (LD, r=.06, p>.5; WT, r=.01, p>.5; INT, r=
.003, p>.5; MED, r=.007, p>.5; Fig. 6).
In A1 segments, LD and INT had a significant positive relationship with the atherosclerosis score (LD, r=.25, p<.05;
INT, r=.54, p<.00001), but WT and MED were not well related with the atherosclerosis score (WT, r=.17, p>.1; MED, r=-.06, p>.5; Fig. 7). In B1 segments, LD, WT and INT had a strong positive correlation with the atherosclerosis score (LD, r=.39, p<.0005; WT, r=.54, p<.00001; INT, r=.68, p<.00001; Fig. 7), but MED was not well related with the atherosclerosis score (r=.03, p>.1). In C2 segments, LD, WT and INT had a strong positive comelation (LD, r=.22, p<.05;
WT, r=.35, p<.001; INT, r=.57, p<.00001), and MED had a negative comelation (r=-.28, p<.01) with the atherosclero- sis score (Fig. 7).
Lumen diameter (mm) 40 30 20 10 0
Wall thickness (mm) 4
3
2
1
Intima thickness (mm) 1.5
1.0
0.5
0.0
Media thickness (mm) 4 3 2 1 0
Fig. 4.Scatter plots of age- and body mass index-related changes in the aortic size of the A1 (proximal ascending) segment.
y=13.03+.13x, r=.62, p<0.00001
y=1.94+.002x, r=.09, p<.1
y=.004x-.02, r=.46, p<.00001
y=1.96-.002x, r=-.10, p>.1
10 20 30 40 50 60 70 80 90
Age (yr)
12 16 20 24 28 32
Body mass index (kg/m2)
y=18.79-.03x, r=-.03, p>.5
y=1.99+.002x, r=.02, p>.5
y=.005+.007x, r=.18, p>.05
y=1.98-.006x, r=-.06, p>.5
DISCUSSION
Our results reveal that: 1) distal infrarenal (C2), proximal thoracic (B1), and proximal ascending (A1) segments of the aorta are common sites of atherosclerosis in decreasing order;
2) with aging, atherosclerosis occurs in multiple segments and becomes calcified; and 3) the aortic size may largely be influenced by age but not body size.
The atherosclerotic process begins from childhood and may progress to form atheroma with some lesions becoming cal- cified. Previous studies revealed that abdominal aortic calci- fication is positively related to age (12, 13). In the study by Allison et al. (12), both the prevalence and severity of aortic calcification were significantly influenced by age: at age under 50 yr the prevalence of calcification was 16% and increased to 93% by age over 70 yr. By contrast, in the present study, 8% of subjects at age under 50 yr had calcified atheroma, and the prevalence of calcified atheroma was 31 and 32% by age over 50 and 60 yr, respectively. In addition, although athe- rosclerosis occurs in multiple lesions with aging, the preva-
lence of calcification was much lower in elderly subjects aged over 60 yr. However, the data of the present study are not sufficient to conclude that the prevalence of calcified athero- sclerosis in Korean women is much lower than that of West- ern countries because the sample size and age distribution of the two studies are quite different.
It has been generally accepted that the body size including body height, weight, BSA, and BMI may affect the aortic size. A strong correlation was found between the aortic diam- eter and body size (14, 15). However, this concept is contro- versial. In the present study, we have found that the body size does not affect the aortic size and the atherosclerosis score.
Similar results were found in the study by Itani et al. (16).
They found a weak correlation between the aortic diameter and body size. The reason for these discrepancies is unclear.
Differences in sample size and quantitative method might have influenced the results. The small sample size could not allow standardization of the results. Among the body size, BMI (kg/m2) is frequently referred as an index of body fat (obesity). Obesity, high body weight, and weight gain have
Lumen diameter (mm) 30
20
10
0
Wall thickness (mm) 5 4 3 2 1 0
Intima thickness (mm) 2.0 1.5 1.0 0.5 0.0
Media thickness (mm) 3
2
1
0
Fig. 5.Scatter plots of age- and body mass index-related changes in the aortic size of the B1 (proximal thoracic) segment.
y=9.73+.13x, r=.72, p<.00001
y=1.10+.02x, r=.61, p<.00001
y=.02x-.20, r=.70, p<.00001
y=1.30+.004x, r=.17, p>.1
10 20 30 40 50 60 70 80 90
Age (yr)
12 16 20 24 28 32
Body mass index (kg/m2)
y=13.81+.05x, r=.07, p>.1
y=1.53+.01x, r=.12, p>.1
y=.17+.01x, r=.12, p>.1
y=1.90-.00004x, r=.0001, p>.5
been related to an increased risk of clinical events of athero- sclerotic diseases (5, 17). Lakka et al. (18) described that ab- dominal obesity is commonly associated with accelerated pro- gression of atherosclerosis, and obesity is an important car- diovascular risk factor. A recent study has demonstrated that apolipoprotein receptors have profound consequences for athe- rosclerotic susceptibility associated with obesity (19). How- ever, BMI did not well correlated with the atherosclerosis score in the present study. Asians have a lower BMI but higher per- centage body fat than whites and have a different fat distribu- tion from whites (20, 21). This means increased health risks associated with obesity appear to occur at a lower BMI in Asians. A recent population-based study (10) has shown that the risks of hypertension and diabetes mellitus occurred at much lower levels of BMI. However, BMI is not significantly different between normal and atherosclerosis subjects in the present study. When our data are compared to the lower cut- off point of BMI (20), 30% of normal subjects and 25% of atherosclerosis subjects are overweight, and 20% of normal subjects and 22% of atherosclerosis subjects are obesity. These
results indicate that BMI may be no longer a suitable indica- tor of body fat, as previously described that BMI is a doubt- ful index for representing adiposity accurately (22).
Atherosclerosis is common in the A1, B1, and C2 segments of the aorta, particularly in the C2 segment, but the reason is unclear. In case of the C2 segment, anatomical consideration may be helpful to understand the reason. Two or three pairs of the right and left lumbar arteries and the median sacral artery usually arise in order from the dorsolateral side of the infrarenal aorta between the level of the inferior mesenteric artery and the level of bifurcation into common iliac arteries.
These are smaller parietal branches of the infrarenal aorta, and their diameter averages less than 2 mm. A thick intima, i.e., adaptive thickening to maintain lumen sizes for optimal blood flow, is frequently seen at the mouth of these branch vessels where it is focal and eccentric. Adaptive thickening may be a prerequisite for retention and accumulation of lipid, and thus, for nidus of an atherosclerotic lesion. These mor- phological and structural characteristics could explain why the distal segment of the infrarenal aorta is highly suscepti-
Lumen diameter (mm) 30
20
10
0
Wall thickness (mm) 4 3 2 1 0
Intima thickness (mm) 3
2
1
0
Media thickness (mm) 3
2
1
0
Fig. 6.Scatter plots of age- and body mass index-related changes in the aortic size of the C2 (distal infrarenal) segment.
y=9.73+.08x, r=.46, p<.00001
y=1.21+.01x, r=.28, p<.01
y=.01x-.001, r=.51, p<.00001
y=1.21-.005x, r=-.29, p<.01
10 20 30 40 50 60 70 80 90
Age (yr)
12 16 20 24 28 32
Body mass index (kg/m2)
y=11.47+.04x, r=.06, p>0.5
y=1.50+.001x, r=.01, p>.5
y=.51+.0003x, r=.003, p>.5
y=1.90-.00004x, r=.0001, p>.5
ble for atherosclerosis. However, this hypothesis is not always true since an advanced lesion can develop at other locations without adaptive thickening when atherogenic lipoprotein levels are very high.
In the B1 and C2 segments, the mean age of early athero- sclerosis was 39±14 yr. Fibrous atheroma with calcification was evident by 50±10 yr of age. These data mean that, as shown in Fig. 2, silent (subclinical) atherosclerosis can sponta- neously be progressed into clinical atherosclerosis within 10 yr. The mean age of fibrous atheroma is nearly the same as that of menopause. The menopause is known to have an unfa- vorable influence on conventional atherosclerotic risk factors (23). Recently, Zaydun et al. (24) reported that estrogen defi- ciency may, at least in part, augment the age-related increase in arterial stiffness during the early postmenopausal phase.
They observed a significant relationship between the meno- pause and brachial-ankle pulse-wave velocity from examina- tion of 3,149 women (21-94 yr of age) in an annual health screening. However, the relationship between atherosclerosis and estrogen deficiency is not yet fully understood. Clinically severe atheroma may cause aneurysmal change and sudden rupture. Male gender, older age, heavy smoking, high blood pressure, serum cholesterol, impaired glucose metabolism, and body habitus are known factors for the increased risk of abdominal aortic aneurysm rupture. However, we could not find an aneurysmal change even in elderly subjects. Clinically, women are usually not considered for abdominal aortic aneu- rysm screening because the prevalence is lower. In developed
countries, prevalence is about 1.1% in elderly women (25).
By contrast, Itani et al. (16) have found that only two out of 3,124 (.03%) women (aged 60±12 yr) had asymptomatic aortic aneurysm in their screening using a mobile helical CT.
Therefore, it is doubtful whether we could find cases of aneu- rysm when the number of elderly subjects aged over 65 is close at least to that of younger age.
As shown in Fig. 4-6, the aortic size changed with aging as in previous studies (26-28). LD, WT, and INT of B1 and C2 segments have a strong positive correlation, and MED of the C2 segment had a negative correlation with aging. To the best of our knowledge, however, quantitative studies on the aortic size in women is extremely rare, and therefore, we could not compare our data with others. LD of infrarenal aorta of ours (12.5±1.2 mm) is similar to a result (12.5±1.2 mm in 43±11 yr of age) from helical CT images (27) but is sma- ller than a result (14.5±4.4 mm in age 30-39 yr) using pres- sure-fixed tissue (26). Pressure-fixation can provide accurate dimension; however, we did not use pressure-fixation, since our purpose was not to obtain exact dimension. By the fact that the size of the thoracic aorta of ours is not different from other study (28), it is likely that pressure-fixation is not always in necessity for morphometry. CT scan or magnetic resonance provides highly reproducible measures of aortic anatomy and atherosclerosis, but the aortic size could be over- or under- estimated even by an experienced examiner because the lu- men of the vessel is not absolutely round, and furthermore, the vessel wall structure could not be clearly differentiated.
Fig. 7.Scatter plots of the atherosclerosis score-related changes in aortic size of the A1 (proximal ascending, left), B1 (proximal thoracic, center), and the C2 (distal infrarenal, right) segments.
Lumen diameter (mm) 40 30 20 10 0
Wall thickness (mm) 4 3 2 1 0
y=17.43+.63x, r=.25, p<.5 y=13.79+.61x, r=.39, p<.0005 y=11.57+.38x, r=.22, p<.05
y=1.97+.05x, r=.17, p>.1 y=1.57+.14x, r=.54, p<.00001 y=1.33+.04x, r=.35, p<.001
y=.08+.06x, r=.54, p<.00001 y=.16+.12x, r=.68, p<.00001 y=.22+.14x, r=.57, p<.00001
y=1.88-.02x, r=-.06, p<.5 y=1.41+.02x, r=.03, p>.1 y=1.10-.05x, r=-.28, p<.01
1 2 3 4 5 6
Atherosclerosis score
0 1 2 3 4 5 6
Atherosclerosis score
0 1 2 3 4 5 6
Atherosclerosis grade Media thickness (mm)
4 3 2 1 0 Intima thickness (mm)
2
1
0
Therefore, we calculated the means of aortic sizes from trac- ing the contours of lumen, internal elastic lamina, and outer media. Well-designed correction calculated from pre-fixa- tion and post-fixation would help obtaining more accurate measurements.
Previous studies showed that arteries enlarge as atheroscle- rotic plaques develop (29). Zarins et al. (28) described that plaque formation in the infrarenal aorta is associated with aortic enlargement and decreased media thickness in men.
They concluded that these changes may be predisposing fac- tors for the preferential development of subsequent aneurys- mal dilation. Progressive intimal thickening may cause nar- rowing of the vessel lumen. However, luminal narrowing was scarcely found in the present study. Derangement of the medial elastic lamella pattern was inevitably found, particu- larly in the atheroma subjects; elastic fibers became thin, frag- mented and flattened (loss of waviness and fibrillation) as atherosclerosis progressed. Progressive medial degeneration and increased tensile strength could result in compensatory enlargement of the lumen to overcome narrowing. As shown in Fig. 6, in the C2 segment, the most common site of athe- rosclerosis in the present study, LD, WT and INT increased approximately .08, .01 and .01 mm/yr, and MED decreased .005 mm/yr, respectively. As shown in Fig. 7, in the C2 seg- ment, LD, WT and INT increased approximately .38, .04, and .14 mm, respectively, and MED decreased .05 mm, as the increase of the atherosclerosis score. These changes could reverse the intima thickness-to-media thickness ratio.
Our findings strongly support that the atherosclerotic change is primarily affected by age rather than other biolog- ical variables. However, a certain relationship between athe- rosclerosis and other biological variables except age cannot be completely excluded, since age-associated number of sub- ject in the present study is not evenly distributed and num- bers of younger and elderly subjects are relatively thin. And, furthermore, we did not consider other important risk fac- tors such as lipid metabolism, smoking, blood glucose, coro- nary heart disease, and estrogen deficiency, since medical his- tory and recent clinical data of the subjects were too small to statistically compare. These limit a compatible explana- tion of our results. However, population-based screening, proper treatment, monitoring and continuing education, especially in elderly women, were thought to be important for the prevention of progression of atherosclerosis.
REFERENCES
1. Johansen K, Kohler TR, Nicholls SC, Zieler RE, Clowes AW, Kaz- imers A. Ruptured aortic aneurysm: the Harborview experience. J Vasc Surg 1991; 13: 240-7.
2. Brown PM, Zelt DT, Sobolev B. The risk of rupture in untreated aneurysms: the impact of size, gender, and expansion rate. J Vasc Surg 2003; 37: 280-4.
3. Newman AB, Arnold AM, Burke GL, O’Leary DH, Manolio TA.
Cardiovascular disease and mortality in older adults with small ab- dominal aortic aneurysms detected by ultrasonography: the cardio- vascular health study. Ann Intern Med 2001; 134: 82-90.
4. Bengtsson H, Bergqvist D, Sternby NH. Increasing prevalence of abdominal aortic aneurysms. A necropsy study. Eur J Surg 1992;
158: 19-23.
5. Jousilahti P, Tuomilehto J, Vartiainen E, Pekkanen J, Puska P. Body weight, cardiovascular risk factors, and coronary mortality: 15-year follow-up of middle-aged men and women in eastern Finland. Cir- culation 1996; 93: 1372-9.
6. Duvall WL, Vorchheimer DA. Multi-bed vascular disease and athe- rothrombosis: scope of the problem. J Thrombo Thrombolys 2004;
17: 51-61.
7. Stern MP, Haffner SM. Body fat distribution and hyperinsulinemia as risk factors of diabetes and cardiovascular disease. Arterioscle- rosis 1986; 6: 123-30.
8. Calle EE, Thun MJ, Petrelli JM, Rodriguez C, Heath CW Jr. Body- mass index and mortality in a prospective cohort of U.S. adults. N Engl J Med 1999; 34: 1097-105.
9. McGill Jr HC, McMahan CA, Herderick EE, Zieske AW, Malcom GT, Tracy RE, Strong JP. Obesity accelerates the progression of coro- nary atherosclerosis in young men. Circulation 2002; 105: 2712-8.
10. Moon OR, Kim NS, Jang SM, Yoon TM, Kim SO. The relationship between body mass index and the prevalence of obesity-related dis- eases based on the 1995 National Health Interview Survey in Korea.
Obesity Rev 2002; 3: 191-6.
11. Stary HC, Chandler AB, Dinsmore RE, Fuster V, Glagov S, Insull W Jr, Rosenfeld ME, Schwartz CJ, Wagner WD, Wissler RW. A def- inition of advanced types of atherosclerotic lesions and a histologi- cal classification of atherosclerosis. A report from the committee on vascular lesions of the council on atherosclerosis, American Heart Association. Circulation 1995; 92: 1355-74.
12. Allison MA, Criqui Mh, Wright CM. Patterns and risk factors for systemic calcified atherosclerosis. Arterioscler Thromb Basc Biol 2004; 24: 331-6.
13. Miwa Y, Tsushima M, Arima H, Kawano Y, Sasaguri T. Pulse pres- sure is an independent predictor for the progression of aortic wall calcification in patients with controlled hyperlipidemia. Hyperten- sion 2004; 43: 536-40.
14. Liddington MI, Heather BP. The relationship between aortic diam- eter and body habitus. Eur J Vasc Surg 1992; 6: 89-92.
15. Sonneson B, Laenne T, Hansen F, Sandgren T. Infrarenal aortic dia- meter in healthy person. Eur J Vasc Surg 1994; 8: 89-95.
16. Itani Y, Watanabe S, Masuda Y, Hanamura K, Asakura K, Sone S, Sunami Y, Miyamoto T. Measurement of aortic diameters and detec- tion of asymptomatic aortic aneurysms in a mass screening program using a mobile helical computed tomography unit. Heart Vessels 2002;
16: 42-5.
17. Rexrode KM, Hennekens CH, Willett WC, Colditz GA, Stampfer MJ, Rich-Edwards JW, Speizer FE, Manson JE. A prospective study of body mass index, weight change, and risk of stroke in women.
JAMA 1997; 277: 1539-45.
18. Lakka TA, Lakka HM, Salonen R, Kaplan GA, Salonen JT. Abdomi-
nal obesity is associated with accelerated progression of carotid atherosclerosis in men. Atherosclerosis 2001; 154: 497-504.
19. Schreyer SA, Lystig TC, Vick CM, LeBoeuf RC. Mice deficient in apolipoprotein E but not LDL receptors are resistant to accelerated atherosclerosis associated with obesity. Atherosclerosis 2003; 171:
49-55.
20. Wang J, Thornoton JC, Russel M, Burastero S, Heymsfield S, Pier- son RN Jr. Asians have lower body mass index but higher percent body fat than do whites: comparison of anthropometric measurement.
Am J Clin Nutr 1994; 60: 23-38.
21. Ko GT, Chan JC, Cockram CS, Woo J. Prediction of hypertension, diabetes, dyslipidemia or albuminuria using simple anthropometric indexes in Hong Kong Chinese. Int J Obesity 1999; 23: 1136-42.
22. Nevill AM, Stewart AD, Olds R, Holt T. Relationship between adi- posity and body size reveals limitations of BMI. Am J Phys Anthro- pol 2006; 129: 151-6.
23. Do KA, Green A, Guthrie JR, Dudley EC, Burger HG, Dennerstein L. Longitudinal study of risk factors for coronary heart disease across the menopausal transition. Am J Epidemiol 2000; 151: 584-93.
24. Zaydun G, Tomiyama H, Hashimoto H, Arai T, Koji Y, Yambe M, Motobe K, Hori S, Yamashina A. Menopause is an independent fac- tor augmenting the age-related increase in arterial stiffness in the early postmenopausal phase. Atherosclerosis 2006; 184: 137-42.
25. Wanhainen A, Lundkvist J, Bergqvist D, Bjorck M. Cost-effective- ness of screening women for abdominal aortic aneurysm. J Vasc Surg 2006; 43: 908-14.
26. da Silva ES, Rodrigues AJ Jr, de Tolosa EM, Pereira PR, Zanoto A, Martins J. Variation of infrarenal aortic diameter: a necropsy study.
J Vasc Surg 1999; 29: 920-7.
27. Fleischmann D, Hastie TJ, Dannegger FC, Paik DS, Tillsch M, Zarins CK, Rubin GD. Quantitative determination of age-related geomet- ric changes in the normal abdominal aorta. J Vasc Surg 2001; 33:
97-105.
28. Zarins CK, Xu C, Glagov S. Atherosclerotic enlargement of the hu- man abdominal aorta. Atherosclerosis 2001; 155: 157-64.
29. Zarins CK, Weisenberg E, Kolettis G, Stankunavicius R, Glagov S.
Differential enlargement of artery segments in response to enlarg- ing atherosclerotic plaques. Vasc Surg 1988; 7: 386-94.