2005, Vol. 16, No. 1, pp. 157∼163
Designing Summary Tables for Mining Web Log Data
Jeong Yong Ahn 1)
Abstract
In the Web, the data is generally gathered automatically by Web servers and collected in server or access logs. However, as users access larger and larger amounts of data, query response times to extract information inevitably get slower. A method to resolve this issue is the use of summary tables. In this short note, we design a prototype of summary tables that can efficiently extract information from Web log data. We also present the relative performance of the summary tables against a sampling technique and a method that uses raw data.
Keywords : Association rules, Preprocessing, Summary tables, Web data mining
1. Introduction
With the advances of the Web, it is being used for many commercial purposes.
Electronic commerce(EC) is increasing by leaps and bounds and is critical for business. EC enhances the competitiveness of organizations by lowering transaction costs, focusing on differentiating their products and services (Lederer et al., 1998; Lin, 2000), and providing a rich source of information about the customers. According to the strength of EC, the development of new business models supported by information technology, for example CRM(customer relationship management) and BI(business intelligence), has become an important issue in the business community (Wang, 2001).
Web-based organizations often generate and collect large volumes of data such as Web logs in their daily operations. The organizations are looking for easy to use, powerful ad hoc query, reporting and analysis solutions that will empower their staff and customers to access the information they need from corporate data
1)) Associate Professor, Division of Mathematics and Statistical Informatics, Chonbuk National University, Chonbuk, 561-756 Korea.
E-mail : [email protected]
warehouses, departmental data marts or online transaction processing systems, in order to make informed business decisions. However, as users access larger and larger amounts of data, query response times inevitably get slower.
A method to resolve this issue is the use of summary tables. A summary table pre-computes the answer to frequently asked queries so that the results can be returned over and over again, avoiding recalculation of the same results. Summary database tables can create not only different results in both query response times and database architecture compared to traditional relational databases but also many advantages for users within a CRM/BI environment, and are able to support a variety of data mining tasks (Hou, 1999).
There are many efforts towards mining information from log data (Cooley et al., 1999; Pei et al., 2000; Lee and Kim, 2003; Koh and Lee, 2004). However, most studies are focused to extract some information, and usually provide little or no design concepts and implementations of summary tables. In this article, we design summary tables that can efficiently extract information from Web log data. With the summary tables, we can get more effective results such as efficiency of time and producing the data information without loss of generality. We also present experimental results of applying the summary tables against a sampling technique and a method that uses raw data.
2. Design of summary tables
Web log data are usually large volumes of data. Log data more than tens or hundreds of giga-bytes are accumulated per day in cases of big Web site, although there are many differences according to each Web site. Therefore, we must consider the property for the first time when we analyze log data.
One of the methods for the analysis of large volumes of data is to use sampling techniques from a statistical viewpoint. The method is very significant because most statistical information can be replaced by approximate information. Recently, the advance of information technology and sampling algorithms from databases offers an environment that can take advantage of this method more easily, and we expect many studies in this field in the future. However, the method can not be free from large amounts of data.
Another method is to use summary tables. Summary tables hold pre-aggregated and pre-joined data. In addition they hold results of frequently run queries that take a long time to complete. Therefore, the method can improve query response times (Chen et al., 1988; Han, 1998). Log data has the features in which include redundant or irrelevant data in addition to large volumes, and additional information is required for analysis.
When we consider these features, the method is more appropriate than the other methods. The summary tables designed in this study have pre-computed/
aggregated/joined summary information for analysis of log data. We remove
redundant data, store necessary information on summary tables, and use it in the analysis. The main concepts to design summary tables are as follows: (a) The summary tables integrate all additional information such as WHOIS information, Web administrator, Web search engine and so on. (b) All processes to summarize and aggregate the data are automatically conducted in step by step. It is an evolution process to update the summary tables. For this work, we use the agent functions for data management of DBMS. (c) The summary information is available to end users. The users obtain information using the SELECT access.
Users Log data
cleaning
filtering Info. for cleaning
Info. for filtering
extracting info.
Users extracing info.
Raw data table
Document type Manager info.
Session info.
Info.(summary) tables Whois info.
Info.(summary) tables
<Fig. 1> Data flow diagram
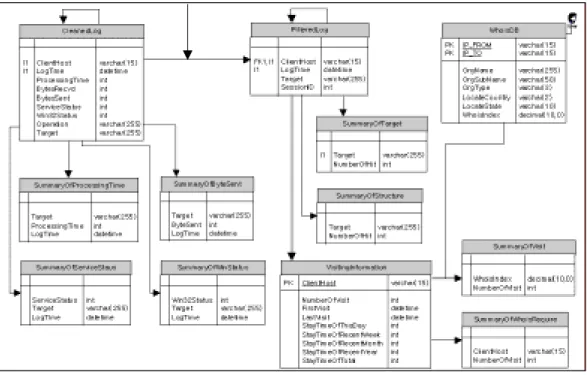
<Fig. 2> Design of summary tables - I
Fig. 1 is a data flow diagram that present the process to make summary tables from log data. First, log data is stored in a table. The stored data have to pass the process of data cleaning. Data cleaning is performed by using the several information such as document type, manager information, and so on. We extract some information from the cleaned data. After then, cleaned data have the process of filtering. In the process, cleaned data have to be partitioned into logical clusters that represent a single user transaction. We can extract some information from the filtered data.
Fig. 2 and Fig. 3 present the structure of summary tables designed in this study. A quadrangle in the figure is a table. For example, first quadrangle is a table called 'InetLog'. The summary tables are designed as follows: All transactions (log entries, raw data) are stored in InetLog table. In other words, the data of the table are ones that did not undergo any preprocessing. The table, CleanedLog, has the data cleaned from InetLog. Data cleaning is performed by checking the suffix of the URL name and using the information of several tables such as information of document types, managers, Web robot, and so on.
<Fig. 3> Design of summary tables - II
The table, FilteredLog, has the information of sessions (logical clusters) that
represent a single user transaction and the visiting time of Web pages. One of the
significant factors which distinguish Web data mining from other data mining
activities is the process for identifying user log entries (Ahn, 2002; Mobasher et
al., 1996), and this process requires much time. SummaryTarget stores the information of the visiting number of Web pages. SummaryServiceStatus and SummaryWinStatus have the information of traffics, and VisitingInformation has the information of visiting time for a week, a month, and a year recent.
3. Performance
To assess the relative performance of the method that uses summary tables, we performed some experiments on an IBM PC(Pentium IV) with a CPU clock rate of 1.5GHz and 1.5GB of main memory. For experiments, we use 3 data sets. The number of transactions of the data sets is approximately 0.6, 1.2, 1.8 million respectively. And the number of sessions is approximately 15,100, 33,500, 51,700 respectively.
The experiments compare the performance of the three methods that use summary tables, raw data, and sampling technique. Fig. 4 and Fig. 5 show the execution time for hit counts of Web pages from SummaryTarget and discovering association rules from FilteredLog respectively. Association rule is a data mining technique to extract relationships from data collected by Web servers. We use the rules to discover the visiting propensity to Web pages of users. For example, we can discover the following relationships: 30% of users who accessed the Web page with URL /compstat/default.htm, also accessed the page /compstat/resource/link/
list.asp.
295 555
0.1 0.2 0.2
93 180 164
318
0 200 400 600 800
0.6 1.2 1.8
Trans actions (million)
Time (sec)
S ummary tables S ampling data Raw data
296 571
9 16 4
164
93
327
184
0 200 400 600 800
0.6 1.2 1.8
Trans actions (million)
Time (sec)
S ummary tables S ampling data Raw data