Ⅰ. Introduction
Images/videos shot from outdoor scenes usually suffer noticeable loss in contrast and color fidelity. Thus, image processing algorithms were developed to improve the visual perception of degraded scenes [1]. These algorithms, nonetheless, caused quality degradation in the low-light areas of the input image in general. Accordingly, intensity restoration preprocessing algorithms could be utilized to address this problem. The widely applied technique is histogram equalization (HE), but it might lead to undesirable noise or
artifacts [2]. To tackle this issue, another method improving upon HE was proposed [3]. The processed image was enhanced to a certain degree, but the enhancement was insignificant. In recent years, with the development in convolutional neural networks (CNN), a CNN- based contrast enhancement method was developed and its performance was relatively good in comparison to traditional approaches [1]. The requirement of huge training database and its computationally intense characteristic made it inappropriate to real-time applications, nevertheless. The Photoshop curve adjustment (PSCA) in Adobe Photoshop
Preprocessing for High Quality Real-time Imaging Systems by Low-light Stretch Algorithm
Dat Ngo*, Bongsoon Kang*★
Abstract
Consumer demand for high quality image/video services led to growing trend in image quality enhancement study. Therefore, recent years was a period of substantial progress in this research field. Through careful observation of the image quality after processing by image enhancement algorithms, we perceived that the dark region in the image usually suffered loss of contrast to a certain extent. In this paper, the low-light stretch preprocessing algorithm is, hence, proposed to resolve the aforementioned issue. The proposed approach is evaluated qualitatively and quantitatively against the well-known histogram equalization and Photoshop curve adjustment. The evaluation results validate the efficiency and superiority of the low-light stretch over the benchmarking methods. In addition, we also propose the 255MHz-capable hardware implementation to ease the process of incorporating low-light stretch into real-time imaging systems, such as aerial surveillance and monitoring with drones and driving aiding systems.
Key words:image enhancement, low-light stretch, histogram equalization, Photoshop curve adjustment, real-time;
Field Programmable Gate Array
* Dept. of Electronics Engineering, Dong-A University
★ Corresponding author
E-mail:[email protected], Tel:+82-51-200-7703
※ Acknowledgment
This research was supported by Basic Science Research Program through the National Research Foundation of Korea (NRF) funded by the Ministry of Education (NRF-2015R1D1A1A01060427).
Manuscript received Aug, 18. 2018; Sep. 12, 2018; accepted Sep. 18. 2018
This is an Open-Access article distributed under the terms of the Creative Commons Attribution Non-Commercial License (http://creativecommons.org/licenses/by-nc/3.0) which permits unrestricted non-commercial use, distribution, and reproduction in any medium, provided the original work is properly cited.
64
Creative 2018, applied to RGB components to enhance the contrast and brightness of input image by first analyzing all pixels and then performing a content-aware monochromatic enhancement, was considered as an alternative method [4].
In this paper, the lightweight and tunable algorithm named low-light stretch (LLS) is presented. It takes the image’s intensity as input and then performs enhancement based on input parameters including the applied intensity range and the weight. Thus, LLS can be fine-tuned to achieve the best enhancement effect. In addition, the hardware architecture for this algorithm is also presented. Our proposed design is wrapped as an intellectual property core to be suitable for various purposes. The synthetic result shows that it is compact and capable of operating at the maximum frequency of 255MHz, which is highly appropriate to real-time applications.
The rest of this paper is organized as follows.
Section II introduces mapping curves for image enhancement. Section III presents the qualitative and quantitative evaluations. Section IV describes the proposed hardware architecture and implementation results. Conclusions are drawn in section V.
Ⅱ. Mapping curves
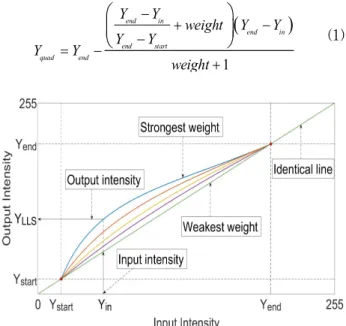
The quadric curve (QC) for enhancing image intensity is shown in Fig. 1 and is generated using equation (1) [5]. Yquad and Yin are the output and input intensities, respectively; Ystart and Yend
denotes the range in which intensity enhancement is performed; weight is used to control the degree of enhancement. The value of 0 denotes the strongest weight, while the large positive integer value denotes the weakest weight. The relation between Yquad and Yin is expressed by a quadratic equation. The constraint that the curve must intersect with the identical line at both extreme points, (Ystart, Ystart) and (Yend, Yend), is applied to find the mathematical expression of QC.
Fig. 1. Quadric curve for intensity enhancement.
( )
1
end in
end in
end start
quad end
Y Y
weight Y Y
Y Y
Y Y
weight
- + -
= - -
+
æ ö
ç ÷
è ø (1)
Fig. 2. Proposed curve of LLS algorithm.
( )( )( )
( )( )
[ ]
( )( )
2
4 1 2
2 1
2 1
in quad start end start
LLS
end start
start end quad end start
weight Y Y Y Y Y
Y
weight Y Y
Y Y Y weight Y Y
+ + - -
= + + -
+ + - - + -
(2)
The proposed curve is depicted in Fig. 2 and generated using equation (2). Yquad, Yin, Ystart, Yend, and weight are identical to those in equation (1). YLLS is the output intensity using proposed curve, which is developed from QC with the aim of shifting the slope towards the low-intensity area to achieve better enhancement effects. Ystart, Yend, and weight offer the ability to tune our proposed curve for a particular image to get the best result.
Ⅲ. Evaluation
Fig. 3. Test images for evaluation.
The 27 test images, shown in Fig. 3, are provided by M. A. Qureshi et al. [6]. Structural similarity (SSIM) and peak signal-to-noise ratio (PSNR) are employed as the metrics for evaluation [7]. SSIM is used to evaluate the structural information preserving characteristic of algorithms.
SSIM’s value ranges from 0 to 1, where 1 means that the enhanced image ideally preserves the original image structure, and vice versa. Regarding the PSNR, the higher, the better. The average SSIM and PSNR for 27 test images are calculated and illustrated in Fig. 4-5. The experiment is conducted in the MATLAB 2018a on a Core i7-6700 CPU (3.4GHz) with 8GB RAM. Since the proposed LLS possesses the highest SSIM of 0.9593 and PSNR of 29.51dB, it is superior to the other two methods, HE and PSCA.
Fig. 4. SSIM result of different algorithms.
Fig. 5. PSNR result of different algorithms.
Fig. 6-7 show the qualitative results with PSNRs when applying to (a) original image the following algorithms (b) HE, (c) PSCA, and (d) LLS. The visual quality of images enhanced by LLS is similar or even better than that of PSCA and HE.
Fig. 6. Comparison results of building image
Fig. 7. Comparison results of castle image.
Ⅳ. Hardware Implementation
Fig. 8. Proposed hardware architecture of LLS.
The proposed hardware architecture for LLS is illustrated in Fig. 8. Since LLS is applied to the intensity channel, the input RGB image is first converted to YCbCr color space. While the intensity undergoes enhancement, Cb and Cr channels must be delayed using flip-flops. Thus, utilizing YCbCr422 instead of YCbCr444 reduces the number of required flip-flops by half. Subsequently, interpolation is necessary to recover the YCbCr444 format and then the result is converted back to RGB color space for display on output devices.
The LLS system is implemented in the System-on-a-chip (SoC) evaluation board [8].
The synthetic result is summarized in Table 1.
LLS system occupies a small portion of resources in the SoC board, including 3,292 out of 437,200 registers and 4,638 out of 218,600 look-up tables.
Table 1. FPGA implementation result.
Slice Logic Utilization Available Used Utilization Registers (#) 437,200 3,292 1%
LUTs (#) 218,600 4,638 2%
Minimum period (ns) 3.918ns Maximum frequency
(MHz) 255.232MHz
* The EDA tool was supported by the IC Design Education Center (IDEC), Korea.
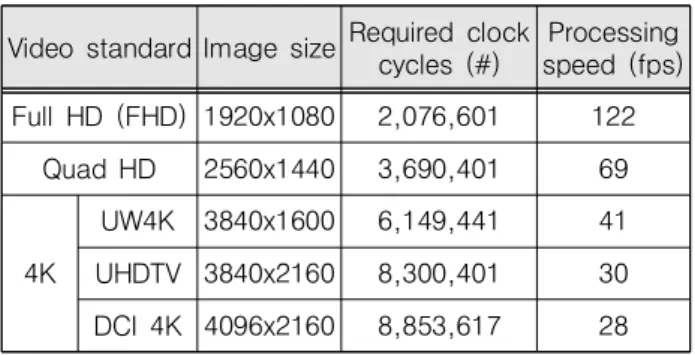
Table 2. Processing speed.
Video standard Image sizeRequired clock cycles (#)
Processing speed (fps) Full HD (FHD) 1920x1080 2,076,601 122
Quad HD 2560x1440 3,690,401 69
4K
UW4K 3840x1600 6,149,441 41
UHDTV 3840x2160 8,300,401 30 DCI 4K 4096x2160 8,853,617 28
For the input video of size H-by-W, horizontal blank HB, vertical blank VB, if the maximum operating frequency is fmax, the processing speed of frames per seconds (fps) is:
( )(max )
fps f
H VB W HB
= + + (3)
Using equation (3), the maximum processing speed is calculated and tabulated in Table 2. LLS system can work accurately with horizontal blank of 1 clock cycle and vertical blank of 1 line. Therefore, with an 1920x1080 video, it needs 2,076,601 clock cycles for processing one frame data. The processing speed is, hence, 122fps.
Since the required real-time speed is at least 25fps for video/movie applications, our proposed design is appropriate to applications with video standards ranging from FHD to 4K.
Ⅴ. Conclusion
A preprocessing algorithm for intensity restoration was presented and its hardware implementation was also provided. The qualitative and quantitative evaluations showed that the proposed LLS outperformed other two benchmarking methods.
Adding to that, the FPGA design only occupied a small chip area and reached the maximum operating frequency of 255MHz, holding many practical applications in high quality image processing. In future work, we will follow the growing trend of CNN to study another method that can outperform the current work.
References
[1] L. Tao, C. Zhu, G. Xiang, Y. Li, H. Jia, and X. Xie, “LLCNN: A convolutional neural network for low-light image enhancement,” 2017 IEEE Visual Communications and Image Processing (VCIP), 2017, pp.1-4. DOI:10.1109/VCIP.2017.8305143 [2] M. Abdullah-Al-Wadud, M. H. Kabir, M. A.
Akber, and O. Chae, “A Dynamic Histogram Equalization for Image Contrast Enhancement,”
IEEE Transactions on Consumer Electronics, vol.53, no.2, pp.593-600, May. 2007.
DOI:10.1109/TCE.2007.381734
[3] P. P. Banik, R. Saha, and K. D. Kim, “Contrast enhancement of low-light image using histogram equalization and illuminant adjustment,” 2018
International Conference on Electronics, Information, and Communication (ICEIC), 2018, pp.1-4.
[4] Helpx.adobe.com, “Using the curves adjustment in Photoshop,” http://helpx.adobe.com/photoshop/
sing/curves-adjustment.html (URL)
[5] J. J. Yang, J. H. Yook, H. C. Choi, and B. S.
Kang, “Picture quality improvement system to prevent the saturation and decoloration using skin protection algorithm (SPA) on CIE 1976 u’v’
chromaticity coordinates,” Journal of the Korea Institute of Information and Communication Engineering, vol.15, no.3, pp.589-596, Mar. 2011.
DOI:10.6109/jkiice.2011.15.3.589
[6] M. H. Qureshi, A. Beghdadi, and M. Deriche,
“Towards the design of a consistent image contrast enhancement evaluation measure,” Signal Processing:
Image Communication, vol.58, pp.212-227, Nov.
2017. DOI:10.1016/j.image.2017.08.004
[7] W. Zhou, A. C. Bovik, H. R. Sheikh, and E. P.
Simoncelli, “Image Quality Assessment: From Error Visibility to Structural Similarity,” IEEE Transactions on Image Processing, vol.13, no.4, pp.600-612, Apr. 2004. DOI:10.1109/TIP.2003.819861 [8] Xilinx, “Zynq-7000 All Programmable SoC Data Sheet: Overview,” http://www.xilinx.com/
upport/ocumentation/data_sheets/ds190-Zynq-700 0-Overview.pdf (URL)
BIOGRAPHY
Dat Ngo (Student Member)
2016:BS degree in Electronic and Telecommunication Engineering, Danang University.
2018:MS degree in Electronic Engineering, Dong-A University.
2018~present: : Pursuing PhD degree in Electronic Engineering, Dong-A University.
Bongsoon Kang (Member)
1985 : BS degree in Electronic Engineering, Yonsei University.
1987 : MS degree in Electrical Engineering, Pennsylvania University.
1990:PhD degree in Electrical and Computer Engineering, Drexel University.
1989~1999 : Senior staff researcher, Samsung Electronics.
1999~present : Professor, Dong-A University.