River Ecosystem and Floristic Characterization of Riparian Zones at the Youngjeong River, Sacheon-ci, Korea
Man Kyu Huh*
Department of Molecular Biology, College of Natural Sciences, Dong-eui University, 176 Eomgwangno, Busan 47340, Korea Received July 23, 2016 /Revised August 25, 2016 /Accepted August 25, 2016
This study is examined river naturality and vegetative composition of river riparian zones to identify their most important sources of variation. Information on plant species cover and on physical charac- teristics that occur at upper, medium, and low areas was collected for 30 riparian plots located throughout the Youngjeong River in Korea. The riparian areas of river banks are dominated by mixed sediment and the vegetation is composed of herbs, shrub, and trees. The floristic characterization of riparian at this river during 2015 season was identified with a total of 28 families, 72 genera, 75 spe- cies, 13 varieties, 23 associations. The vegetations of low water‘s edge and flood way at upper region were naturally formed various vegetation communities by natural erosion. Forty plant species were identified around the upper region, where the dominant growth form was mostly trees. The flood way vegetation at middle region was both of natural vegetation and artificial vegetation. Land uses in riparian zones river levee at low region were bush or grassland as natural floodplain. The values of cover-abundance at upper, middle, and low region were total 9.26, 7.24, and 7.56, respectively.
Grasses and forbs at the Youngjeong River have similar cover-abundance values. Recent, many ri- parian areas of this river have been lost or degraded for commercial and industrial developments.
Thus, monitoring for biological diversity of plant species of this river is necessary for an adaptive management approach and the successful implementation of ecosystem management.
Key words : Cover-abundance, riparian vegetation, river naturality, Youngjeong River
*Corresponding author
*Tel : +82-51-890-1529, Fax : +82-505-182-6870
*E-mail : [email protected]
This is an Open-Access article distributed under the terms of the Creative Commons Attribution Non-Commercial License (http://creativecommons.org/licenses/by-nc/3.0) which permits unrestricted non-commercial use, distribution, and reproduction in any medium, provided the original work is properly cited.
Journal of Life Science 2017 Vol. 27. No. 3. 301~309 DOI : https://doi.org/10.5352/JLS.2017.27.3.301
Introduction
Plants living in wetlands must be able to survive both inundation and drying as water levels may fluctuate greatly seasonally. Other plants are adapted to live predominantly beneath the water's surface (submerging), others float on the surface (floating), while others emerge from water with stiff stems holding the plants leaves above the water (emergent). River bank vegetation, ecologically termed as riparian flora which is highly dynamic, linking terrestrial and aquatic habitat, under the influence of a waterway, such as rivulet banks or riverbanks, represented by a particular type of vegetation that grows along the sides of rivers are called the river's riparian zone [5].
Riparian ecosystems have been defined simply as the cor- ridor of hydrophytic vegetation growing on the banks of
streams and rivers and having an annual evapotranspiration level that influences surface and groundwater hydrology [30]. In addition, riparian areas are transitional areas be- tween terrestrial environment and aquatic systems. Thus, virtually all rainwater runoff must pass through the riparian zones before moving into adjacent aquatic/estuarine sys- tems.
It has long been recognized that riparian zones perform important services, including improvement of surface and groundwater quality, provision of high quality habitat, re- duction of flood risk and erosion, and increased stabilization of banks [15]. Thus, riparian vegetation is increasingly being recognized for its importance in influencing the hydrology and morphology of fluvial systems [24].
Riparian wetlands, deltas and estuaries are normally seen as highly productive systems that harbor a high number of plant species [17, 29].
Riparian forest, the forest that primarily grows along riv- ers and streams, is a critical habitat type in the state.
Riparian forest provides a buffer that filters runoff into riv- ers and streams and supports a variety of wildlife species.
Riparian zones contain valuable water resources, plant com- munities, fisheries, and wildlife. Perspectives of riparian
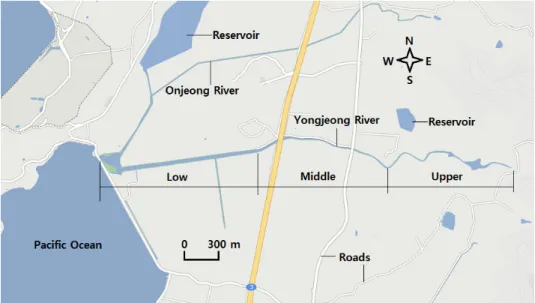
Fig. 1. Location of the study area and the three detailed internodes at the Youngjeong River.
zones based on isolated components of the terrestrial- aquatic interface are ecologically incomplete and have lim- ited application to understanding of ecosystems [16].
The critical importance of scale of observation for eco- logical studies has been illustrated by numerous inves- tigations representing many aspects of ecology [21]. These include patterns of species abundance, population density and community composition, and species richness [6, 19].
This wide recognition of the importance of scale has led to a search for an appropriate theoretical framework for studies of spatial scale [1], and specifically to the in- troduction of the concepts of grain and extent as crucial but separate aspects of spatial scale [18].
The many plants that grow along the banks of this river and her tributaries play an important role in the diverse ecosystems the river supports. Not only do the plants rely on the Youngjeong River for water, but they also play an important role in nutrient and water conservation, and their presence controls soil erosion along the banks. Water can converge on riparian zones from many directions. Precipita- tion falls on riparian zones. Some precipitation is inter- cepted by plant foliage and evaporated back to the atmos- phere, but most of it reaches the soil. Overland and subsur- face runoff from uplands flows laterally across riparian zones to streams. Overland runoff is generated when in- filtration is limited by low soil permeability or its saturation.
When forests are destroyed, the atmosphere, water bodies and the water table are all affected. Trees absorb and retain water in their roots. A large part of the water that circulates in the ecosystem of rainforests remains inside the plants.
Some of this moisture is transpired into the atmosphere.
When this process is broken, the atmosphere and water bod- ies begin to dry out. The watershed potential is compro- mised and less water will run through the rivers. Smaller lakes and streams that take water from these larger water bodies dry up. Riparian zones of Middle and low regions have been destructed in the Youngjeong River. The local level is where deforestation has the most immediate effect.
This disrupts the natural flooding cycles, reduces flows, drains wetlands, cuts rivers off from their floodplains, and inundates riparian habitats, resulting in the destruction of species, the intensification of floods and a threat to live- lihoods in the long term [13].
The purpose of this study is to investigate river ecosys- tem and the flora on the Youngjeong River at three regions.
Therefore, this survey recorded material significance for the future appears in the environment to restore or improve the problem may be.
Materials and Methods
Surveyed regionsThis study was carried out on the Youngjeong River, lo- cated at Yonghyeon-myeon province (upper region: 35°011‘
014’‘N/128°100’014‘’E, low region: 35°012‘794’‘N/128°049’
459‘’E), Sacheon-ci in Korea (Fig. 1). The river is located to the northern east of the city of Sacheon-ci. The river is approximately 4.85 kilometers in length with a varying width of between 2.1 and 31.6 meters. The flora and vegeta- tion on the Youngjeong River were investigated at three
regions and adjacent areas during four seasons. The upper area of the Youngjeong River, including one reservoir, used to be covered with moderate deciduous forest made up of pine trees and other species. Unfortunately, middle and low regions have now been deforested and heavily cultivated.
Floristic analysis
Sampling with quadrats (plots of a standard size) can be used for most plant communities [3]. Three sectors of the riparian vegetation on the Youngjeong River were chos- en to study. At these places, a floristic survey of trees, shrubs, herbs, grass and aquatic species was performed by least count quadrat method. A quadrat delimits an area in which vegetation cover can be estimated, plants counted, or species listed. Quadrats were established randomly, regu- larly, or subjectively within a study site since plants often grow in clumps, long, narrow plots often include more spe- cies than square or round plots of equal area. Each species was collected, mounted, labeled, and systematically ar- ranged in a herbarium. The system of plant classification system was followed by Lee [12]. Naturalized plants were followed by Korea National Arboretum [11]. Abundance and cover degree are usually estimated together in a single combined estimation or cover-abundance scale from Braun- Blanquet [2]. In order to relate the model to the field sit- uation in which usually Braun-Blanquet figures are re- corded, the % occupancy figures were transformed in to the ordinal transform scale from 1 (one or few individuals) to 9 (75~100% cover of total plot area, irrespective of num- ber of individuals) [4]. The relative net contribution degree (r-NCD) was obtained by summing up the NCD values for those species belonging to particular taxa under consid- eration [10].
Index of degree of river structure
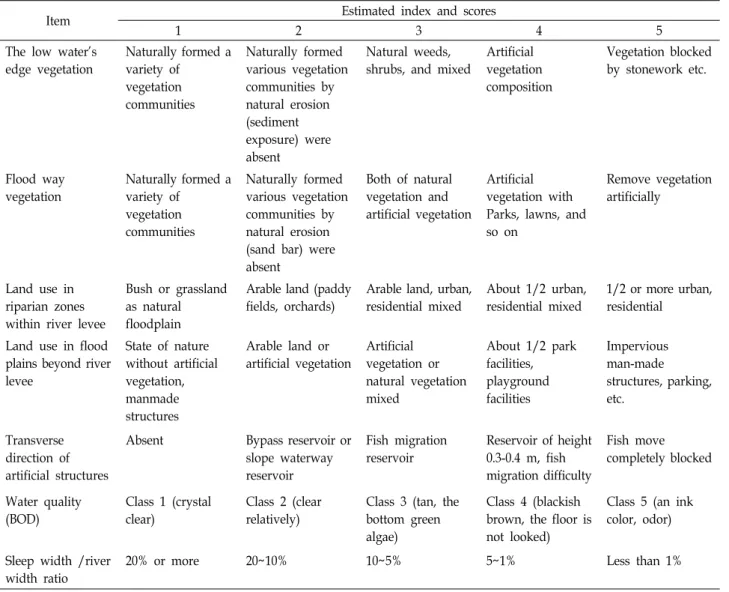
The three regions of Youngjeong River were divided by the geographic location with considering length of the river and river morphology. Index of degree of river naturality according to the environment of river was also analyzed according to Table 1. River terminology was followed by Hutchinson [9]. The test for biochemical oxygen demand (BOD) is a bioassay procedure that measures the oxygen consumed by bacteria from the decomposition of organic matter [22]. The method for BOD was used to a standard method of the American Public Health Association (APHA) and is approved by the U.S. Environmental Protection
Agency [26].
Biotic indices
Shannon–Weaver index of diversity [23]: the formula for calculating the Shannon diversity index (H') is
H' = – Σ pi ln pi
pi is the proportion of important value of the ith species ( pi = ni / N, ni is the important value index of ith species and N is the important value index of all the species).
N = eH'
The species richness of animals was calculated by using the method, Margalef’s index (R) of richness [14].
R = S-1
ln(n)
S is the total number of species in a community and n is the total number of individuals observed.
Evenness index was calculated using important value in- dex of species [7, 20].
E = H'
ln(S)
Results
Upper region (upstream)The river width at this region is about 2.1 m. The vegeta- tions of low water’s edge and flood way were naturally formed various vegetation communities by natural erosion (sediment exposure) (Table 2). Land use in riparian zones was bush or grassland as natural floodplain. Land uses of flood plains beyond river levee were arable land or artificial vegetation. Transverse direction of artificial structures was one reservoir. The average value of BOD was 2.13 mg/l.
The oxygen-demand parameter BOD at upper region was relative clear. The ratio of sleep width/river width was 5-10%. The value for index of degree of river naturality according to the environment factors was a mean of 2.0.
Riparian vegetation provides habitat for many wildlife species (Table 3). At total area, the application of the Braun-Blanquet approach for plant classification in this area is presented in the article. According to the existing phyto- sociological data, 28 families, 72 genera, 75 species, 13 vari- eties, 23 associations, and 17 communities have been identi- fied. 40 species was found in this upper region. Transition zones of this section were distributed pine vegetation and chestnut communities (Table 3). Although the river width was relative large and the depth of water was swallow,
Table 1. Index of degree of river naturality according to the environmental factors
Item Estimated index and scores
1 2 3 4 5
The low water's edge vegetation
Naturally formed a variety of
vegetation communities
Naturally formed various vegetation communities by natural erosion (sediment exposure) were absent
Natural weeds, shrubs, and mixed
Artificial vegetation composition
Vegetation blocked by stonework etc.
Flood way vegetation
Naturally formed a variety of
vegetation communities
Naturally formed various vegetation communities by natural erosion (sand bar) were absent
Both of natural vegetation and artificial vegetation
Artificial vegetation with Parks, lawns, and so on
Remove vegetation artificially
Land use in riparian zones within river levee
Bush or grassland as natural floodplain
Arable land (paddy fields, orchards)
Arable land, urban, residential mixed
About 1/2 urban, residential mixed
1/2 or more urban, residential
Land use in flood plains beyond river levee
State of nature without artificial vegetation, manmade structures
Arable land or artificial vegetation
Artificial vegetation or natural vegetation mixed
About 1/2 park facilities, playground facilities
Impervious man-made structures, parking, etc.
Transverse direction of artificial structures
Absent Bypass reservoir or slope waterway reservoir
Fish migration reservoir
Reservoir of height 0.3-0.4 m, fish migration difficulty
Fish move completely blocked
Water quality (BOD)
Class 1 (crystal clear)
Class 2 (clear relatively)
Class 3 (tan, the bottom green algae)
Class 4 (blackish brown, the floor is not looked)
Class 5 (an ink color, odor)
Sleep width /river width ratio
20% or more 20~10% 10~5% 5~1% Less than 1%
Table 2. The degrees of river naturality according to the environmental factors at the Youngjeong River
Region
The low water's edge
vegetation
Flood way vegetation
Land use in riparian zones
within river levee
Land use in flood plains beyond river
levee
Transverse direction of artificial structures
Water quality (BOD)
Sleep width /river width
ratio
Mean
Upper Middle Low
2 3 3
2 3 4
1 1 1
2 2 2
2 1 1
2 2 3
3 3 4
2.000 2.414 2.571
distributions of aquatic plants did not developed in riparian.
Riverbed area was dominated by the distribution of the wil- low (Salix gracilistyla) and Pueraria thunbergiana communities.
Riverbed area was dominated by Pueraria thunbergiana community. Dominant species in flood plains were Equise- tum arvense and Trifolium repens. The survey region was a total of 40 taxa, including 23 families, 36 species, and four varieties. Naturalized plants were six species. The total
transformed Braun-Blanquet value and r-NCD at upper area were 83 and 1,038, respectively.
The value of cover-abundance was total 9.26. Grasses and forbs have similar cover-abundance values (2.15 and 2.07, respectively) (Table 4). A Shannon-Weaver index (H´) of diversity was 3.42 across growth forms, varying from 1.77 to 2.37. Although richness indices and evenness indices were different from each other, there were not shown sig-
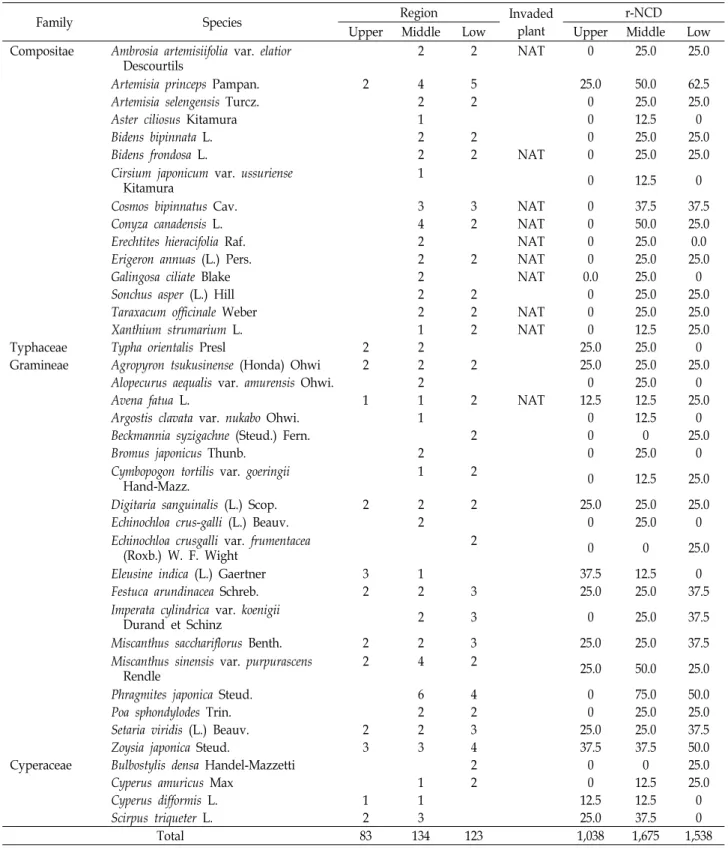
Table 3. List of vascular plants, Braun-Blanquet’s score, and r-NCD at three regions of the Youngjeong River
Family Species Region Invaded
plant
r-NCD
Upper Middle Low Upper Middle Low
Equisetaceae Equisetum arvense L. 4 2 4 50.0 25.0 50.0
Ginkoaceae Ginko biloba L. 1 1 1 12.5 12.5 12.5
Pinaceae Pinus densiflora S. et Z. 3 37.5 0 0
Pinus thunbergii Parl. 8 100.0 0 0
Cupressaceae Juniperus chinensis var. kaizuka Hort. 2 0 0 25.0
Salicaceae Salix gracilistyla Miq. 2 2 25.0 25.0 0
Fegaceae Castanea crenata Sieb. Et Zucc 4 50.0 0 0
Quercus dentata Thunb. ex Murray 2 1 25.0 0 12.5
Quercus variabilis Blume 2 25.0 0 0
Moraceae Morus alba L. 1 1 12.5 12.5 0
Cannabinaceae Humulus japonicus S. et Z. 2 4 4 25.0 50.0 50.0
Polygonaceae Persicaria blumei Gross 3 2 0 37.5 25.0
Persicaria sieboldi Ohki 4 0 0 50.0
Persicaria thunbergii H. Gross 2 0 25.0 0
Rumex acetocella L. 2 3 NAT 0 25.0 37.5
Rumex acetosa L. 2 2 0.0 25.0 25.0
Rumex conglomeratus Murr. 2 2 2 NAT 25.0 25.0 25.0
Rumex crispus L. 3 3 NAT 0 37.5 37.5
Chenopodiaceae Chenopodium album var.
centrorubrum Makino
2 3 3 25.0 37.5 37.5
Chenopodium ficifolium Smith 2 2 NAT 0 25.0 25.0
Amaranthaceae Achyranthes japonica (Miq.) Pa. 2 0 0 25.0
Amaranthus lividus L. 2 NAT 0 0 25.0
Phytolaccaceae Phytolacca americana L. 2 NAT 12.5 0 0
Ranunculaceae Ranunculus japonicus Thunb. 2 0 25.0 0
Cruciferae Capsella bursa-pastoris (L.) Medicus 3 3 0 37.5 37.5
Capsella flexuosa With. 3 2 0 37.5 25.0
Lepidium apetalum Willd. 2 3 NAT 0 25.0 37.5
Lepidium virginicum L. 2 2 NAT 0 25.0 25.0
Rorippa indica (L.) Hiern 2 3 0 25.0 37.5
Thlaspi arvense L. 3 3 NAT 0 37.5 37.5
Rosaceae Potentilla fragarioides var. major Max. 3 2 37.5 25.0 0
Prunus serrulata var. spontanea
(Max.) Wils. 1 1 1 12.5 12.5 12.5
Rubus crataegifolius Bunge 2 25.0 0 0
Rosa multiflora Thunb. 2 2 25.0 25.0 0
Leguminosae Amorpha fruticosa L. 2 NAT 0.0 25.0 0
Amphicarpaea edgeworthii var.
trisperma Ohwi
2 2 0 25.0 25.0
Kummerowia striata (Thunb.) Schindl. 2 2 0 25.0 25.0
Pueraria thunbergiana Benth. 4 50.0 0 0
Trifolium pratense L. 3 4 4 NAT 37.5 50.0 50.0
Trifolium repens L. 2 5 4 NAT 25.0 25.0 50.0
Aceraceae Acer pseudo-sibolianum (Paxton) Kom. 1 1 1 12.5 12.5 12.5
Oxalidaceae Oxalis corniculata L. 1 2 1 12.5 25.0 12.5
Violaceae Viola mandshurica W. Becker 2 25.0 0 0
Onagraceae Oenothera odorata Jacq. 2 4 2 NAT 25.0 50.0 25.0
Umbelliferae Oenanthe javanica (Bl.) DC. 2 2 2 25.0 25.0 25.0
Oleaceae Forsythia koreana Nakai 2 2 0 25.0 25.0
Plantaginaceae Plantago asiatica L. 2 2 2 25.0 25.0 25.0
Caprifoliaceae Lonicera japonica Thunb. 2 25.0 0 0
Table 3. Continued
Family Species Region Invaded
plant
r-NCD
Upper Middle Low Upper Middle Low
Compositae Ambrosia artemisiifolia var. elatior Descourtils
2 2 NAT 0 25.0 25.0
Artemisia princeps Pampan. 2 4 5 25.0 50.0 62.5
Artemisia selengensis Turcz. 2 2 0 25.0 25.0
Aster ciliosus Kitamura 1 0 12.5 0
Bidens bipinnata L. 2 2 0 25.0 25.0
Bidens frondosa L. 2 2 NAT 0 25.0 25.0
Cirsium japonicum var. ussuriense Kitamura
1 0 12.5 0
Cosmos bipinnatus Cav. 3 3 NAT 0 37.5 37.5
Conyza canadensis L. 4 2 NAT 0 50.0 25.0
Erechtites hieracifolia Raf. 2 NAT 0 25.0 0.0
Erigeron annuas (L.) Pers. 2 2 NAT 0 25.0 25.0
Galingosa ciliate Blake 2 NAT 0.0 25.0 0
Sonchus asper (L.) Hill 2 2 0 25.0 25.0
Taraxacum officinale Weber 2 2 NAT 0 25.0 25.0
Xanthium strumarium L. 1 2 NAT 0 12.5 25.0
Typhaceae Typha orientalis Presl 2 2 25.0 25.0 0
Gramineae Agropyron tsukusinense (Honda) Ohwi 2 2 2 25.0 25.0 25.0
Alopecurus aequalis var. amurensis Ohwi. 2 0 25.0 0
Avena fatua L. 1 1 2 NAT 12.5 12.5 25.0
Argostis clavata var. nukabo Ohwi. 1 0 12.5 0
Beckmannia syzigachne (Steud.) Fern. 2 0 0 25.0
Bromus japonicus Thunb. 2 0 25.0 0
Cymbopogon tortilis var. goeringii Hand-Mazz.
1 2 0 12.5 25.0
Digitaria sanguinalis (L.) Scop. 2 2 2 25.0 25.0 25.0
Echinochloa crus-galli (L.) Beauv. 2 0 25.0 0
Echinochloa crusgalli var. frumentacea (Roxb.) W. F. Wight
2 0 0 25.0
Eleusine indica (L.) Gaertner 3 1 37.5 12.5 0
Festuca arundinacea Schreb. 2 2 3 25.0 25.0 37.5
Imperata cylindrica var. koenigii
Durand et Schinz 2 3 0 25.0 37.5
Miscanthus sacchariflorus Benth. 2 2 3 25.0 25.0 37.5
Miscanthus sinensis var. purpurascens Rendle
2 4 2 25.0 50.0 25.0
Phragmites japonica Steud. 6 4 0 75.0 50.0
Poa sphondylodes Trin. 2 2 0 25.0 25.0
Setaria viridis (L.) Beauv. 2 2 3 25.0 25.0 37.5
Zoysia japonica Steud. 3 3 4 37.5 37.5 50.0
Cyperaceae Bulbostylis densa Handel-Mazzetti 2 0 0 25.0
Cyperus amuricus Max 1 2 0 12.5 25.0
Cyperus difformis L. 1 1 12.5 12.5 0
Scirpus triqueter L. 2 3 25.0 37.5 0
Total 83 134 123 1,038 1,675 1,538
NAT: Naturalized plants.
nificant differences (p<0.05).
Middle region (middle-stream)
The river width at the region is about 17.5 m. The ri-
parian areas of both the river banks are dominated by mixed sediment and the vegetation is composed of herbs, shrub, trees, climbers and macrophytes (Table 3). The low water's edge vegetation was natural weeds, shrubs, and
Table 4. Mean cover-abundance of species and diversity indices at the Youngjeong River Growth form No. species (%) Mean cover-abundance
of species Diversity (H`) Diversity (N) Richness Evenness Upper
Trees Shrubs Grasses Forbs Total
7 (17.5) 8 (20.0) 13 (32.5) 12 (30.0) 40 (100)
3.29 1.75 2.15 2.07 9.26
1.77 1.86 2.37 2.07 3.42
5.85 6.42 10.67 7.91 30.58
1.40 1.59 2.50 2.27 6.51
0.91 0.89 0.92 0.83 0.93 Middle
Trees Shrubs Grasses Forbs Total
2 (2.9) 6 (8.6) 22 (31.4) 40 (57.1) 70 (100)
1.0 1.75 2.09 2.41 7.24
0.69 1.71 2.87 3.45 4.02
1.99 5.52 17.65 31.62 55.93
0.46 1.62 4.28 7.18 11.54
0.99 0.95 0.93 0.94 0.95 Low
Trees Shrubs Grasses Forbs Total
3 (5.1) 3 (5.1) 17 (28.8) 36 (61.0) 59 (100)
1.0 1.50 2.59 2.47 7.56
1.03 1.06 1.69 3.41 3.68
2.80 2.88 5.43 30.36 39.48
0.67 0.59 1.39 6.67 8.35
0.94 0.96 0.87 0.95 0.95 mixed. The flood way vegetation was both of natural vege-
tation and artificial vegetation. Land uses in riparian zones river levee were bush or grassland as natural floodplain.
Land use in flood plains beyond river levee was arable and artificial vegetation. Transverse direction of artificial struc- tures was absent. The average value of BOD was 2.88 mg/l.
The oxygen-demand parameter BOD was relative clear. The ratio of sleep width/river width was 5-10%. The value for index of degree of river naturality according to the environ- ment factors was a mean of 2.414.
Left and right riparian areas were distributed Polygona- ceae vegetation (Persicaria blumei, Persicaria thunbergii, Rumex acetocella, Rumex acetosa, Rumex conglomeratus, and Rumex crispus) and Cruciferae vegetation (six species including Capsella bursa-pastoris) (Table 3). Land use in flood plains beyond river levee was dominated Gramineae vegetation (Zoysia japonica). Other phyla were occasionally recorded in low densities. The survey region was a total of 70 taxa, including 21 families, 59 species, and 11 varieties. Naturaliz- ed plants were 21 species. The total transformed Braun- Blanquet value and r-NCD at middle area were 134 and 1,675, respectively.
The value of cover-abundance was total 7.24 (Table 4).
A Shannon-Weaver index (H´) of diversity was 4.02 across growth forms, varying from 0.69 to 3.45. For the community as a whole, richness of trees was very low (0.46).
Low region (downstream)
The river width at the region was about 31.6 m. The low water's edge vegetation was natural weeds, shrubs, and mixed (Table 3). The flood way vegetation was artificial veg- etation with Parks, lawns, and so on. Land uses in riparian zones river levee were bush or grassland as natural floodplain. Land use in flood plains beyond river levee was arable and artificial vegetation. Transverse direction of arti- ficial structures was absent. The average value of BOD was 3.52 mg/l. The oxygen-demand parameter BOD was within acceptable levels. The ratio of sleep width/river width was 1-5%. The value for index of degree of river naturality ac- cording to the environment factors was a mean of 2.571.
Riverbed area was dominated by the distribution of the Polygonaceae communities. The left area in the river was a waterfront park and right areas were roads and residential villages. There were occurred in Equisetum arvense, Juniperus chinensis var. kaizuka, Humulus japonicas, Persicaria sieboldi, Trifolium repens, Oenothera odorata, Phragmites japonica, Artemisia princeps, and Zoysia japonica (Table 3). They domi- nated over the other phyla and were mainly recorded in high densities during summer and autumn. The survey re- gion was a total of 59 taxa, including 20 families, 51 species, and 8 varieties. Naturalized plants were 20 species. The total transformed Braun-Blanquet value and r-NCD at middle area were 123 and 1,538, respectively.
The value of cover-abundance was total 7.56 (Table 4).
A Shannon-Weaver index (H´) of diversity was 3.68 across growth forms, varying from 1.03 to 3.41. For the community as a whole, richness of trees was very low (0.46).
Discussion
A riparian buffer zone is a vegetated strip of land along the margins of a waterway. Healthy native forest riparian vegetation usually consists of a canopy of large trees accom- panied by a thick undergrowth of shrubs and grasses [27].
River bank health is a term can be used to illustrate the ecological condition of a river bank or riparian zone.
Generally, a river bank is healthy if it is competent enough to protects the river bank from erosion, can satisfy the sus- taining need of human. A healthy riverbank could be de- scribed as one in which the environment is viable, habitable and sustainable; the economy is equitable, sustainable and adequately wealthy; and the community is habitable, equi- table and hospitable. The majority of site at upper region of the Youngjeong River are in good condition, which a high diversity of native species and relatively few in- troduced compared with other riparian communities.
The Youngjeong River is started at the low mountains and ends at the Pacific Ocean. Welcomme [28] defined three major types of riparian landscapes: fringing, which are the linear riparian corridors, internal deltas, where topographic plains may flood from a combination of precipitation and over-bank flow from the river, and the coastal deltaic floodplains. The Youngjeong River is classified in fringeless type than fringing type because it is not developed many tributaries or streams. In addition, this river does not have wide basin areas. Although riparian area at upper region of the Youngjeong River is not wider than those of middle and low regions, many species are distributed in this region.
The vegetations of low water’s edge and flood way were naturally formed various vegetation communities by natural erosion (Table 2). Whereas, many cement blocks at middle and low regions of the Youngjeong River were creating in- stead river grasslands by the Direct-stream Rivers Project because of most rain falling period between June and August. This artificial action reduced the water's natural filtration action and eliminated the habitat of many animals.
Humans are affected on rivers directly or indirectly by changing land use in river morphology. They also simulta- neously accelerate and decelerate fluxes of water, sediments, and nutrients on a scale that exceeds natural filtration action
[25]. Awareness of current conditions and relationships be- tween land uses and resource goals is essential for success- ful restoration of riparian systems.
Overall this community is common and widespread, with many local area species thriving in the various environ- ments that they occupy within the study area. To a large extent introduced weed species have become naturalized within this complex, but without apparent effect on its functioning. Many exotic plants adapted or partly saturated soils in riparian areas and may potentially become problem- atic if not managed or eradiated. For example, red clover (Trifolium pratense) can take over large areas of strand and sandbars in flood runners, spreading rapidly by stolenif- erous rhizomes through the soils [8]. It regenerates quickly from these rhizomes bot after flood or soil sliding, and also seeds profusely.
Riparian zones are major determinants of both the food resources and habitats of aquatic vertebrates in streams and rivers [16]. In headwater segments of drainages, riparian zones control allochthonous and autochthonous food re- sources for invertebrate consumers, which are the food base for predaceous fish. Furthermore, riparian zones directly control the food resources of herbivorous and detritivorous fishes [16].
References
1. Allen, T. F. H. and Hoekstra, T. W. 1990. The confusion between scale-defined levels and conventional levels of or- ganization in ecology. J. Veg. Sci. 1, 5-12.
2. Braun-Blanquet, J. 1964. Pflanzensoziologie, Grundzüge der Vegetationskunde, pp. 1-865, 3rd ed., Springer, Wein, New York.
3. Cox, G. 1990. Laboratory Manual of General Ecology, 6th ed., Dubuque, WIlliam C. Brown, Iowa.
4. Dietvorst, P., Maarel, V. D. and van der Putten, H. 1982.
A new approach to the minimal area of a plant community.
Vegetario 50, 77-91.
5. Dutta, R., Baruah, D. and Sarma, S. K. 2011. Influence of riparian flora on the river bank health of a Himalayan River before being regulated by a large dam in North East India.
Ann. Biol. Res. 2, 268-280.
6. Hairston, N. G. 1959. Species abundance and community organization. Ecology 40, 404-416.
7. Hill, M. O. 1973. Diversity and evenness: a unifying nota- tion and its consequences. Ecology 54, 423-432.
8. Huh, M. K., Chung, K. T. and Jeong, Y. K. 2005. Genetic Variation of Alien Invasive Red Clover (Trifolium pratense) in Korea. Kor. J. Life Sci. 15, 273-278.
9. Hutchinson, G. E. 1975. A treatise on Limnology, Limnological
초록:사천시 용정천에서 하천 생태계와 하안단구 지역의 수변식물상 허만규*
(동의대학교 분자생물학과)
본 연구는 경상남도 사천시 용정천에서 하천의 건강도와 식생 구조를 평가하기 위해 하천의 상, 주, 하류에서 물리적 구조와 30곳의 방형구에서 식물 피도를 조사하였다. 2015년 이 하천의 전체 수변식물상은 28과 72속 75종 13변종이었다.
상류 제방의 식생은 초본, 관목, 교목의 혼합 군락이었다. 상류지역의 하안단구 식생은 자연 침식으로 형성된 식물상이 었다. 상류에서는 40종의 식물이 동정되었고 우점 군락은 교목이었다. 중류 지역에서 홍수터는 자연식생과 인공식생이 혼재하였다. 제외지는 초지가 우세하였다. 상, 중, 하류의 피도-풍부도(cover-abundance)는 각각 9.26, 7.24, 7.56이었다.
잎이 좁은 초본과 잎이 넓은 광엽 초본의 피도-풍부도는 유사한 비율을 나타내었다. 최근 이 지역의 하첨 주변은 상업 및 산업 시설이 설치되어 제외지 등에서 많은 하천변 식생이 훼손되었다. 따라서 이 하천의 지속 가능한 유지를 위해서 는 생물종 다양성에 대한 모니터링이 필요하다고 사료된다.
Botany, pp. Vol. 3, 1-660, John Wiley, New York.
10. Kim, J. W. 1996. Floristic characterization of the temper- ature oak forests in the Korean Peninsula using high-rank taxa. J. Plant Biology 39, 149-159.
11. Korea National Arboretum. 2012. Field Guide, Naturalized Plants of Korea, pp. 1-166, Korea National Arboretum, Seoul, Korea.
12. Lee, Y. N. 2007. New Flora of Korea, pp. 1-1237, Kyo-Hak Publishing Co., Seoul, Korea.
13. Lowe, W. H. and Likens, G. E. 2005. Moving headwater streams to the head of the class. BioScience 55, 196-197.
14. Magurran, A. E. 1988. Ecological Diversity and its Measurement, pp. 192, Princeton University Press, Cambridge, USA.
15. Merrill, A. G., Benning, T. L. and Fites, J. A. 2006. Factors controlling structural and floristic variation of riparian zones in a mountainous landscape of the western United States. West. Nor. Am. Natl. 66, 137-154.
16. Newbold, J. D., Elwood, J. W., O’Neill, R. W. and Van Winkle, W. 1981. Measuring nutrient spiraling in streams.
Can. J. Fish. Aquat. Sci. 38, 860-863.
17. Nilsson, C. and Berggren, K. 2000. Alterations of riparian ecosystems caused by river regulation. Bioscience 50, 783- 792.
18. Norton, D. A. and Lord, J. M. 1990. On the use of ‘grain size’ in ecology. Funct. Ecol. 4, 719.
19. Palmer, M. W. 1990. Spatial scale and patterns of species environment relationships in hardwood forests of the North Carolina piedmont. Coenoses 5, 79-87.
20. Pielou, E. C. 1966. The measurement of diversity in differ- ent types of biological collection. J. Theor. Biol. 13, 131-144.
21. Reed, R. A., Peet, R. K., Palmer, M. W. and White, P. S.
1993. Scale dependence of vegetation-environment correla- tions: A case study of North Carolina piedmont woodland.
J. Veget. Sci. 4, 329-340.
22. Sawyer, C. N. and McCarty, P. L. 1978. Chemistry for Envir- onmental Engineering, pp. 1-532, 3rd ed., McGraw-Hill Book Company, New York.
23. Shannon, C. E. and Weaver, W. 1963. The Measurement Theory of Communication, Univ. of Illinois Press, Urbana.
24. Tooth, S. and Nanson, G. C. 1999. Anabranching rivers on the Northern Plains of arid central Australia. Geomorphology 29, 211-233.
25. Tylianakis, J. and Romo, C. 2010. Natural enemy diversity and biological control: Making sense of the context- dependency. Bas. Appl. Ecol. 11, 657-668.
26. USEPA (United Stated Environmental Protection Agency).
2002. Methods for Measuring the Acute Toxicity of Effluents and Receiving Waters to Freshwater and Marine Organisms, pp.
1-275, 5th ed., U.S. Environmental Protection Agency Office of Water, Washington, DC.
27. Weir, D. A. and Wilson, J. B. 1988. Micro-pattern in an area of New Zealand alpine vegetation. Vegetatio 73, 81-88.
28. Welcomme, R. L. 1979. Fisheries Ecology of Floodplain Rivers, Longman Group Ltd, London.
29. Whittington, M., Panagos, M. D. and Malan, G. 2016.
Floristic characteristics of riparian pan vegetation from the Ndumo game reserve, South Africa. J. Anim. Plant Sci. 26, 445-456.
30. Wissmar, R. C. and Beschta, R. L. 1998. Restoration and management of riparian ecosystems: a catchment perspective.
Freshwater Biol. 40, 571-585.