Aboveground biomass estimation of Quercus glauca in evergreen forest, Kotzawal wetland, Cheju Island, Korea
Heon-Mo Jeong · Hae-Ran Kim* · Kyu-Tae Cho** · Seung-Hyuk Lee*** · Young-Sub Han***
Young-Han You**+
Ecological Adaptation Research Team, National Institute of Ecology, Chung-nam, Korea
* Warm-Temperate And Subtropical Forest Research Center, Jejudo, Korea
** Department of Biology, Kongju National University, Kongju.Korea
*** Ecological Monitoring Research Team, National Institute of Ecology, Chung-nam, Korea
제주도 곶자왈 상록활엽수 종가시나무의 생물량 추정을 위한 상대생장식
˳
Abstract
This study developed allometry equation and estimated the aboveground-biomass of Quercus glauca, a warm-temperature, evergreen broad-leaved tree, growing in Kotzawal wetland located on Jeju Island. The allometric equations between DBH(diameter at breast height) and dry weights of stems (Ws), branches (Wb), leaves (Wl) and aboveground biomass (Wab) of Q. glauca were as follows: logWs=2.4042logDBH-1.3045, logWb=2.6436logDBH-1.6232, logWl =1.5428logDBH-1.3692 and logWab=2.3324logDBH-0.9181. The allometric equations between D2H and Ws, Wb, Wl, and Wab of Q.glauca were as follows : logWs=0.853logD2H-1.4252, logWb=0.8453logD2H-1.5834, logWl=0.5328logD2H-1.4073 and logWab=0.8265log D2H-1.0327. The R2 between DBH and Ws, Wb, Wl and Wab were 0.9873, 0.9711, 0.7979 and 0.993, respectively. The R2 between D2H and Ws,Wb,Wl and Wab were 0.9841, 0.9174, 0.7537 and 0.9876, respectively. There was no significant difference between observed and calculated values of the allomatric equations from DBH and D2H(p>0.05, Kolmogorov–
Smirnov test). Thus, to estimate the aboveground biomass of Q. glauca, use of DBH and D2H as an independent variables in the allometric equation is recommended.
Key Words : Allometric equation, Biomass, Evergreen broad leaved tree, Quercus glauca 요 약
본 연구는 제주도 곶자왈습지에서 서식하는 상록활엽수인 종가시나무의 지상부 생물량에 대한 상대생장식을 개발하기 위 하여 수행되었다 그 결과 독립변수가. DBH일 때 줄기, (Ws 가지), (Wb 잎), (Wl 그리고 지상부) (Wab 의 상대생장식은 각각) logWs=2.4042logDBH-1.3045, logWb=2.6436logDBH-1.6232, logWl=1.5428logDBH-1.3692 그리고 logWab=2.3324logDBH-0.9181 이었다 독립변수가. D2H일 때 줄기, (Ws), 가지(Wb), 잎(Wl 그리고 지상부) (Wab 의 상대생장식은 각각) logWs=0.853log D2H-1.4252, logWb=0.8453logD2H-1.5834, logWl=0.5328logD2H-1.4073 그리고 logWab=0.8265logD2H-1.0327이었다 독립변수가.
일 때 줄기 가지 잎 그리고 지상부 상대생장식의
DBH , , R2값은 0.9873, 0.9711, 0.7979 그리고 0.993 이었고 독립변수가
D2H일 때 0.9841, 0.9174, 0.7537그리고 0.9876 이었다 독립변수가. DBH인 상대생장식과D2H인 상대생장식은 모두 관측 값과 예측값 사이에 통계적으로 유의한 차이가 없어 어느 상대생장식을 사용하더라도 결과에는 차이가 없었다.
핵심용어: 상대생장식 생물량 상록활엽수 종가시나무, , ,
+ Corresponding Author; Phone: +82-41-850-8508, e-mail: [email protected]
Due to global warming, there has been recent interest in the capacity of trees to sequester and store carbon (Cienciala et al. 2005). In addition, botanical biomass is an important indicator for assessing forest structure (Westman and Rogers 1977). Allometry is an alternative method of estimating plant productivity in situations where the volume of individual plants is very large or regrowth is so slow that extensive damage may be caused by complete harvesting of sample plots (Madgwick and Satoo 1975). This technique is based upon the estimation that some parameters, such as plant height, and diameter at breast height (DBH) can be correlated with biomass (Whittaker and Woodwell 1968). Trees selected as standard individuals must be harvested to determine the slope of a regression line, which may then be used to predict plant biomass from the easily measured parameter. Net primary productivity (NPP) is frequently measured by calculating the difference in annual biomass.
Quercus glauca is globally distributed from the Western Himalayas, throughout subtropical and tropical China to central Honshu in Japan (Yu 2005). Q.
glauca is a major woody species that dominates in South-Western costs and low mountain area of Jeju Island on the Korea Peninsula (Kim and Kim 2012).
Increased atmospheric CO2 concentrations associated with elevated temperatures can directly affect the growth and development of plants through physiological processes. Thus, understanding the interactive effects of elevated CO2 and temperature on plant physiological responses is essential for accurate predictions of climate change.
As a part of the National Long-Term Ecological Research Program, we studied the primary production of Quercus glauca on Kotzawal wetland, DongBaekDongSan (Mt.) of Seunheulgot in Jeju Island.
The purpose of this study was to obtain allometric equations of Q. glauca for estimation of biomass.
1. Materials and Methods
1.1. Sampling and Management of Standard Individuals
This study was conducted at a sub-tropical forests dominated by Q. glauca in Seonheul-ri Kotzawal
51.78"E). Sixteen standard individuals plants of Q.
glauca, which were healthy and visibly undamaged, were harvested between November 2012 and February 2013. Basal diameters of sampled standard individuals of Q. glauca were distributed evenly from small to large (1.4-25cm). Basal diameters (DBH) of stem and plant height (H) were measured, and the standard individuals were separated into different parts (stems, branches, and leaves) and weighed in the field.
Sub-samples of stems, branches, and leaves were brought back to the laboratory and oven-dried at 80℃
to estimate green weights using over-dry weight conversion factors. Oven-dry weights of plant parts were calculated from the conversion factors and green weights of the respective plant parts.
1.2. Development of Allometric Equations
Allometric equations of Q. glauca were developed as previously described by Kim (1969). All measured parameters were transformed to logarithm (Kerkhoff and Enquist 2009). In this study, diameter at breast height (DBH, D) and height of tree (H) were used as parameter. Using the regression model proposed by Kittredge (1994), we analyzed log-transformed data in all regressions. That model is suitable when data have a multiplicative error structure and proportional changes are of interest, as is the case here (Kerkhoff and Enquist 2009).
Log Y = A+ blog X,
where Y is estimation of the standing crop, X is the measured parameter of standard individuals, A is the point at which the regression line crosses the Y axis, and b is the slope of the regression line. The value of the constants (A and b) were determined in a preliminary harvest of standard individuals. Allometric equations were calculated using Microsoft Execl (Microsoft Office 2008).
Allometric equations were established by variance of DBH (D) and D2H,respectively.
1.3. Statistical Analysis
To examine how well an observed cumulative frequency distribution conforms to an expected
ㆍ ㆍ ㆍ ㆍ ㆍ
frequency distribution, we conducted the Kolmogorov -Smirnov Test using the SPSS program (IBM SPSS Statistics 20).
2. Results and Discussion
2.1. Allometric Equations
To develop allometric equations, DBH (D), plant height (H), D2H, and dry weight of each organ were determined in the 16 standard individuals and are summarized in Table 1. The ranges of DBH(D) and plant height(H) of the standard individuals were 1.4-19cm and 1.81-14.5m, respectively.
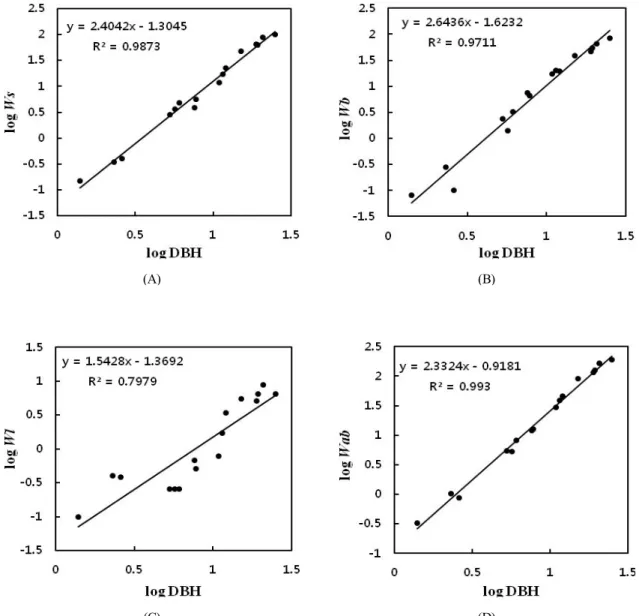
Regression lines of each organ between dry weight of stems (log Ws), branches (log Wb), leaves (log Wl), aboveground biomass (log Wab), and DBH (D) are depicted in Fig. 1. Allometric equations for estimation of biomass of each organ between dry weight and DBH are as follows:
log Ws = 2.4042logDBH-1.3045 (Fig. 1 A) log Wb = 2.6436logDBH-1.6232 (Fig. 1 B) log Wl = 1.5428logDBH-1.3692 (Fig. 1 C) log Wab = 2.3324logDBH-0.9181 (Fig. 1 D)
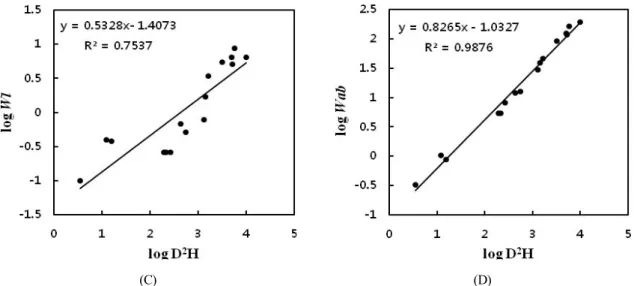
Regression lines of each organ between dry weight of stems (log Ws), branches (log Wb), leaves (log Wl), and aboveground biomass (log Wab), and D2H are depicted in Fig. 2. Allometric equations for estimation of biomass of each organ between dry weight and D2H are as follows:
log Ws = 0.9007logD2H-1.4791 (Fig. 2 A) log Wb = 0.8453logD2H-1.5834 (Fig. 2 B) log Wl = 0.5407logD2H-1.3923 (Fig. 2 C) log Wab = 0.8359logD2H-1.0277 (Fig. 2 D)
The values of the constants and R2 are summarized in Table 2. The value of R2 of the regression line for aboveground biomass was the highest in both DBH and D2H. The value of R2 of the regression line for each organ was the highest in D2H. For the relationship between DBH and dry weight, the value of R2 was the highest in aboveground biomass and lowest
in leaves. For the relationship between D2H and dry weight, the value of R2 was the highest in aboveground biomass and lowest in leaves. Value of R2 for each organs was larger in the relationship between DBH and dry weight than in the relationship between D2H and dry weight.
2.2. Statistical Analysis
As a result of the Kolmogorov-Smirnov test, allometric distributions to DBH and D2H were similar to normal distribution. There was no statistical difference between the observed value and predictive value as calculated by the allometric equations.
Traditionally, allometric equations are more accurate when more variations are considered (Yeocheon Ecological Research 2005). But when we include more variables for more exact calculation, also more time (or effort) was needed. There was no significant difference between observed and calculated values of the allometric equations from DBH (one variable) and D2H (two variable). Thus, we recommend DBH variable for rapid allometric calculation.
No. D H D2H Ws(kg) Wb(kg) Wl(kg) Wab(kg) 1 1.4 1.8 3.528 0.15 0.08 0.10 0.33 2 2.3 2.3 12.167 0.35 0.28 0.40 1.03 3 2.6 2.3 15.548 0.40 0.10 0.38 0.88 4 5.3 6.9 193.821 2.83 2.36 0.26 5.45 5 5.7 6.7 217.683 3.67 1.42 0.26 5.35 6 6.1 7.1 264.191 4.77 3.20 0.26 8.23 7 7.6 7.5 433.2 3.83 7.40 0.67 11.90 8 7.8 9 547.56 5.61 6.66 0.52 12.80 9 10.9 11 1306.91 11.70 17.05 0.78 29.53 10 11.5 10.7 1415.075 16.84 20.10 1.71 38.65 11 12.1 11.3 1654.433 22.62 19.52 3.41 45.55 12 15.1 14.1 3214.941 47.49 38.36 5.43 91.27 13 19 14.5 5234.5 65.06 46.33 5.12 116.52 14 19.4 13.5 5080.86 63.54 54.83 6.47 124.84 15 20.8 13.4 5797.376 88.99 66.01 8.74 163.74 16 25.0 16.0 10000 99.28 84.58 6.47 190.32 Table 1. D (DBH), plant height (H), D2H, and dry weight
(kg) of stems (Ws), branches (Wb), leaves (Wl) and aboveground biomass (Wab) of standard individuals of Q. gluaca.
(C) (D)
Fig. 1. Relationships between biomass components and DBH (D) of Q. glauca. Biomass components include stems (A), branches (B), leaves (C), aboveground biomass (D).
(A) (B)
ㆍ ㆍ ㆍ ㆍ ㆍ
(C) (D)
Fig. 2. Relationships between biomass components and D2H of Q.glauca. Biomass components include stems (A), branches (B), leaves (C), aboveground biomass (D).
Organ DBH(D) D2H
a b R2 a b R2
Stems -1.3045 2.4042 0.9873 -1.4252 0.853 0.9841
Branches -1.6232 2.6436 0.9711 -1.5834 0.8453 0.9174
Leaves -1.3692 1.5428 0.7979 -1.4073 0.5328 0.7537
aboveground -0.9181 2.3324 0.9930 -1.0327 0.8265 0.9876
Table 2. Comparisons of allometric coefficient b, constant a, and R2 of allometric equations for each organ of Q. glauca
Variable (DBH)
Variable (D2H)
Stems Kolmogorov-Smirnov’s Z 0.354 0.530
p-value 1.00 0.941
Branches Kolmogorov-Smirnov’s Z 0.354 0.530
p-value 1.00 0.941
Leaves Kolmogorov-Smirnov’s Z 0.707 0.707
p-value 0.699 0.699
Above-ground Kolmogorov-Smirnov’s Z 0.354 0.354
p-value 1.00 1.00
Table 3. Comparison of observed field data and calculated values of the allomatric equations used to predict aboveground biomass of Q. glauca from DBH (D) and D2H using Kolmogorov-Smirnov’s test
Acknowledgement
This study was supported by the Korean Ministry of Environment (National Long Term Ecological Research Project).
References
Cienciala, E., Cerny, M., Apltauer, J. and Exnerova, Z.
(2005). Biomass functions applicable to European
beech, J. of Forest Science, 51(4), pp. 147-154 Kerkhoff A. J., Enquist B. J. (2009). Multiplicative by
nature: why logarithmic transformation is necessary in allometry, J .of Theoretical Biology, 257, pp.
519-521
Kim JH. (1969). The studies on the estimation of the matter production by means of allometric method in the cultivated mulberry plants, Science
Education,2(1),pp. 1-10
Kim JS, Kim TY. (2012). Woody Plants of Korea Peninsula. Dolbegae Publisher,p.174. Paju, Korea
on trees and stands, J. of Forest,42(12),pp. 905-912 Madgwick HAI and Satoo T. (1975). On estimating the aboveground weights of tree stands, Ecology ,56(6), pp.1446-1450
SPSS Inc., (2011). PASW Statistics 20. IBM SPSS Inc., Chicago
Yeocheon Ecological Research. (2005). Modern Ecological Experiment. Kyomunsa, p.277. Seoul, Korea
Publisher, p.253. New Hampshire, USA
Westman, WE. and Rogers, RW. (1977). Biomass and structure of a subtropical eucalyptus forest, North Stradbroke Island, Australian J. of Botany, 25(2),pp.
171-191
Whittaker RH and Wood well GM. (1968). Dimension and production relations of trees and shrubs in the Brookhaven Forest, New York, J. of Ecol.,56(1), pp.1-25
논문접수일: 2014년02월03일
○
심사의뢰일: 2014년02월07일
○
심사완료일: 2014년02월14일
○