• 검색 결과가 없습니다.

Stock Market Response to Elections: An Event Study Method

N/A
N/A
Protected

Academic year: 2021

Share "Stock Market Response to Elections: An Event Study Method"

Copied!
10
0
0

로드 중.... (전체 텍스트 보기)

전체 글

(1)

Print ISSN: 2288-4637 / Online ISSN 2288-4645 doi:10.13106/jafeb.2020.vol7.no5.009

1

First Author and Corresponding Author. Associate Professor, College of Commerce and Business Administration, Dhofar University, Sultanate of Oman [Postal Address: P.O Box. 2509, Salalah, Sultanate of Oman, 211]. Email: [email protected]

2

Assistant Professor, College of Commerce and Business Administration, Dhofar University, Sultanate of Oman.

Email: [email protected]

3

Lecturer, College of Commerce and Business Administration, Dhofar University, Sultanate of Oman. Email: [email protected]

ⓒ Copyright: The Author(s)

This is an Open Access article distributed under the terms of the Creative Commons Attribution Non-Commercial License (http://Creativecommons.org/licenses/by-nc/4.0/) which permits unrestricted noncommercial use, distribution, and reproduction in any medium, provided the original work is properly cited.

Stock Market Response to Elections: An Event Study Method

Kavita CHAVALI

1

, Mohammad ALAM

2

, Shireen ROSARIO

3

Received: March 01, 2020 Revised: March 21, 2020 Accepted: April 03, 2020

Abstract

The research paper examines the influence of elections on the stock market. The study analyses whether the market reaction would be the same when a party wins and comes to power for the second consecutive time. The study employs Market Model Event study methodology.

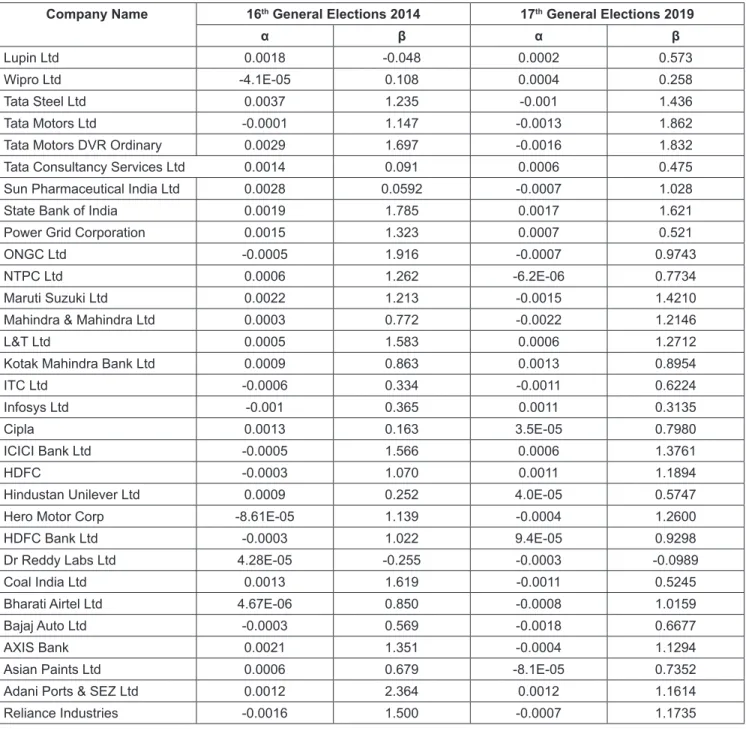
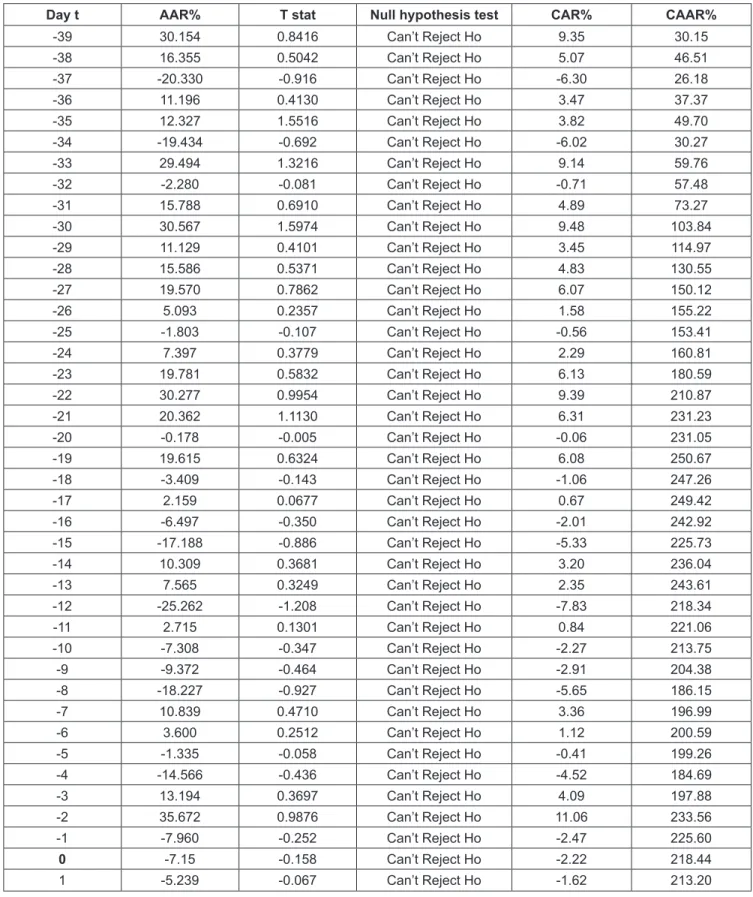
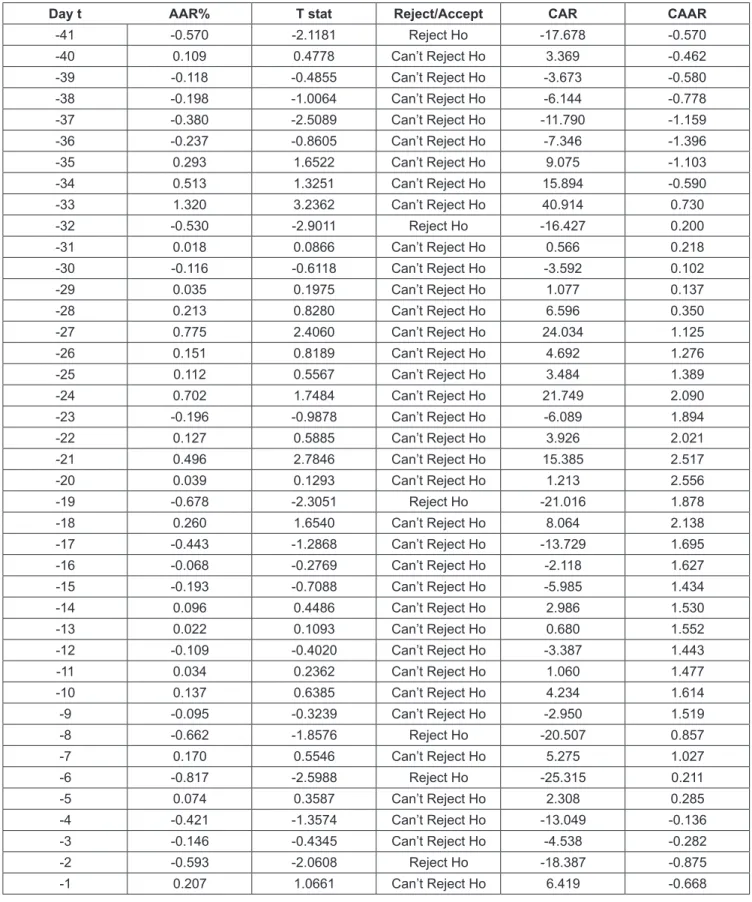
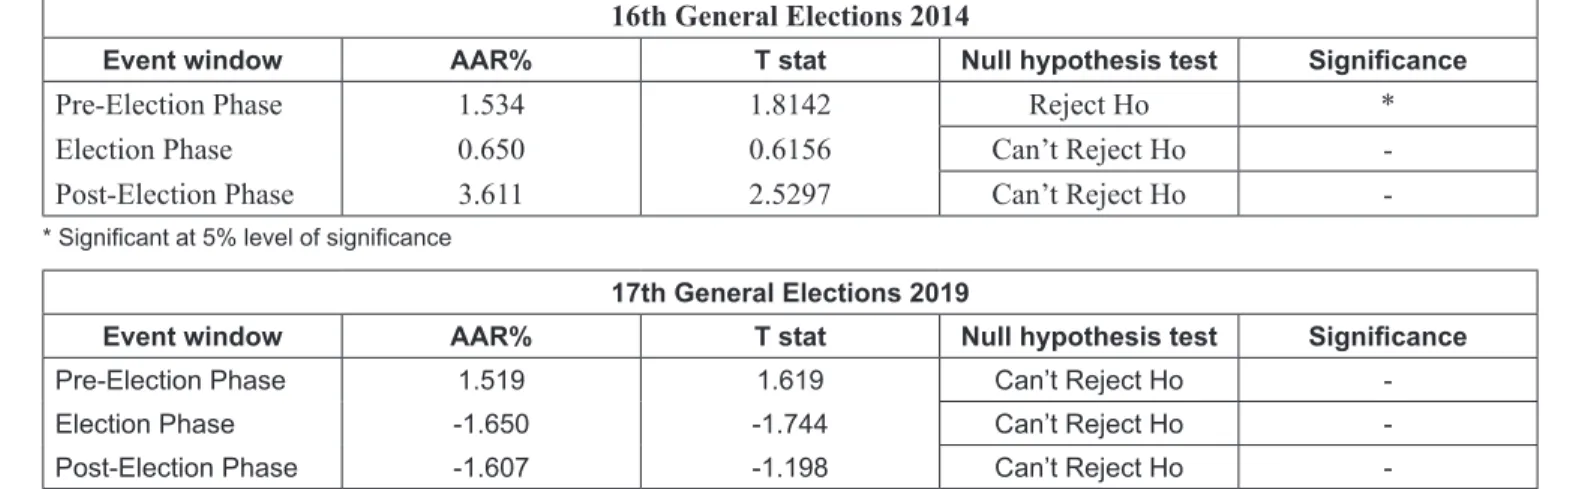
The sample period taken for the study is 2014 to 2019. A sample of 31 companies listed in Bombay Stock Exchange is selected at random for the purpose of the study. For the elections held in 2014, an event window of 82 days was taken with 39 days prior to the event and 42 days post event. The event (t0) being the declaration of the election results. For the elections held in 2019 an event window of 83 days was taken with 41 days prior to the event and 41 days post event. The results indicate that the market reacts positively with significantly positive Average Abnormal Returns. The findings of the study reveal that the impact on the market is not the same between any two elections even when the same party comes to power for the second time. The semi-strong form of efficient market hypothesis holds true in the context of emerging markets like India.

Keywords : Financial Economics, Event study, Elections, Emerging Markets, Politics JEL Classification Code : G41, D53, H11, D91

1. Introduction

The impact of politics on the stock market is a debated topic from times immemorial. India is one of the emerging economies with the largest democracy in the world, which operates in accordance with the constitution of 1950. India being the second most populous country in the world has the largest number of voters eligible to take part in elections.

In any democracy the elected officials are accountable to

the people, and to continue in office they must be elected at prescribed intervals. For that reason, as per the Constitution of India, General Elections are held every five years and an elected party comes to power. Nordhaus (1975) was one of the pioneers to study of impact of politics on the stock market. The influence of politics on the stock market is explained with the semi-strong form of market efficiency hypothesis (Fama, 1970). They are called event studies (Fama, 1991).

In an event study, we can understand and measure

how swiftly security prices react to announcements of

election results in politics. In semi-strong Efficient Market

Hypothesis, the existing market prices of stocks reflect all

information publicly available. In semi-strong form of

market efficiency, the market takes some time to reflect the

information in price. The time taken to reflect depends on

the market, on the stock and the way in which information is

shared. The stock market reacts to the most possible or likely

outcome of the election, even before the election day (Foster,

2012). This study attempts to check if there is a presence of

semi-strong form of EMH in the Indian stock market. The

authors in this study made an effort to observe the influence

of politics on the stock market and its effect on the Average

Abnormal Return on various stocks.

(2)

2. Literature Review

There is an abundance of studies in the past, which dwelled into the influence of politics on the stock markets on economies around the world (Angela & Wilson, 2007;

Bialkowski, Gottschalk, & Wisniewski, 2008; Chavali

& Zahid, 2011; Hung, 2011; Kumar, Sophia, & Maria, 2015; Liu, 2007; Wong & Hooy, 2016). The pioneers who investigated the political angle of the financial markets in academic studies are Booth and Booth (2003) and Santa- Clara and Valkanov (2003). The reason for the impact of politics and elections on stock market is probably because of the expectation in the changes in the government policies which the newly elected party or person might bring in, which might impact tax rates and thereby the corporate performance. The effect on stock markets depends on policy changes which the individual party or person who comes to power carry out and its impact on reaction and sentiments of the market (Wang, Lee, & Ling, 2008)

Governments usually engage in increased consumption, increased spending in projects with high visibility prior to elections which can cause inflation. The anticipation of policy changes and increased uncertainty result in change of investors or market sentiments during the election period (Siokis & Kapopoulos, 2007). According to Leblang and Mukherjee (2005) there are numerous ways how financial markets react to elections. Lee and Brahmasrene (2018) argue that there is no evidence of impact of global factors on the stock markets. They argue that it is the impact of macro-economic variables on stock market and stock prices in the short run rather than long run. They observed a positive relationship between macro variables and stock prices. Hong (2016) has a contrasting view and in his study argue that lack of availability of information otherwise called as information asymmetry hinders the stock prices to respond to economic conditions. The stock market volatility is because of the increase or decrease in the demand of shares when the supply is difficult to adjust in turn which alters stock prices.

Stocks become more volatile under the party that supports social equality and egalitarianism and when the market expects that party to win elections. Second, the expectations of inflation is low with a party who supports social or economic conservatism which increases demand for stocks and stimulates higher trading volume. This also leads to higher stock price volatility and higher mean. Nguyen and Nguyen (2019) in their study state that volatility increases the attractiveness of stock market for investors. Investors do not react to good and bad news in the same way. The impact on the stock market is higher for bad news compared to the good news. As per their study, it is observed that the volatility is higher when the investors perceive the news as not so good compared to good news.

Gomez and Jomo (1999) recognize the presence of a relationship between politics and companies. As per their study on an average company, which has political connections, it does better and significantly benefits during elections. It is also observed that the companies owned by Government react more to election results than private companies. This could be because during elections, politicians use companies owned by Government for political purposes (Dinc, 2005).

Huang (1985) examined and established a relation between stock market return and elections which is statistically significant. The impact on the stock markets is not the same and depends on the party that comes into power. As per their study, the stock market returns are bad in the first and second year after an election and improve in the third and fourth year. Returns are bad in the first two years because the market does not like uncertainty, which a new party brings. Siokis and Kapopoulos (2003) argues that if there are clear distinct ideological differences between the political parties in any country around the world those countries are perfect to examine the effect of General elections on financial markets. India falls into this category as there are vast differences in the ideologies of various parties. There are studies which examined the influence of elections on the stock market but studies have not explored the comparison of two General Elections in India and whether the impact on the Average Abnormal return on stocks would be the same when the same party comes to power for the second time. This study thus attempts to fill the gap by using event study methodology as an approach to examine Average Abnormal Return (AAR) and Cumulative Average Abnormal Return (CAAR) under different elections.

3. Research Methods and Materials

A sample of thirty one companies are selected at random for the research study. The data related to stock prices are taken from the Bombay Stock Exchange (BSE). The time period selected for the study was 20014 to 2019 (16th General Elections – 18th March 2014 to 15th July 2014 and 17th General Elections – 20th March 2019 to 23rd July 2019).

The BSE 30 index closing prices for the respective period are taken. The event date is the day the result of the General Elections was declared, i.e. 16 May in 2014 and 23 May in 2019, which is taken as t0. This study assumes that the information was known to the market on the event day or Election Day. In the 16th General Elections, the stock price of a total of 82 days are taken 39 days prior to the event day, event day (t0) and 42 days post-election and the event day.

In the 17th General Elections, the stock price of a total of 83 days are taken 41 days prior to the election results, event day (t0) and 41 days post-election.

The Market Model Event study methodology is used in

this study. The market model used by Fama, Fisher, Jensen,

and Roll (1969) assumes a linear relationship between the

(3)

return of the security to the return of the market portfolio. This model unlike index model and Capital Asset Pricing model is free from criticisms and detects abnormal returns better than other methodologies. Market model is proven to yield valid results (Salamudin, Ariff, & Nassir, 1999). Market model methodology is a relatively powerful methodology applicable under wide variety of situations (Brown & Warner, 1985).

The study conducted uses daily prices of 82 trading days for 16th General Election and 83 days for 17th General Election is used for calculation of the regression coefficients for the sample companies. A 82 day event window, t-39 to t+42 in the 16th General Elections and 83 event window t-41 to t+41 in the 17th General Elections where event date (t0) is the announcement of election results for calculating the abnormal returns (AR) the average abnormal returns (AAR) of the sample of 31 companies and the cumulative average abnormal returns (CAAR) around the An date of stocks in the sample. A comparison of Pre-election, Election and Post- election AAR% returns and T statistics are calculated and compared for 16th and 17th General Elections.

The study undertakes to check if there is a positive average return around General Elections dates. The study examines the extent of influence of General Elections on the Indian stock market and the impact on the market sentiments between two elections would be the same when the same party comes to power for the second time.

Null hypothesis (H0): Average Abnormal Return AAR around the election result date is positive and is statistically significant

Alternate hypothesis (Ha): Average Abnormal Return AAR around the election result date is negative and is statistically significant

Table 1 shows the list of sample companies taken from BSE to test the impact of elections on stock market.

Table 2 shows the calculated regression coefficients α and β values of the sample companies of 16th and 17th General Elections.

4. Results and Discussion

Table 3 presents results for each of the 82 days’ event window, 39 pre-election announcements, and 42 post-election announcements for the entire sample of 31 companies of the General Elections held in 2014. Table 3 reports average daily AR, AARs, CARs and CAAR for the days t−39 to t+41 along with the test statistics obtained using the MS Excel descriptive analysis tool for testing the null hypothesis. The AARs are negative on the days t-37,t-34,t-33,t-18,t-15,t- 12,t-10, t-9, t-9,t-8,t-4,t-1 t0, t1,t3, t6, t8,t11 However, it is observed that there are significantly positive AARs on most of the post-election result announcement days.

CAAR is also seen to be significantly positive in the event window. This leads to acceptance of the null hypothesis (H0). This shows that the announcement of election results did boost for majority of the return of stocks in the sample.

Indian National Congress party was in power in India for 49 long years since Independence and in the 16th General Elections in 2014 for the first time a new party (Bharatiya Janata Party) came into power. This positive market reaction in post-election can be attributed to the rapid absorption of the information and change in the party in power which is Table 1: List of sample companies

Company Name Industry

Lupin Ltd Pharmaceutical

Wipro Ltd Pharmaceutical

Tata Steel Ltd Manufacturing

Tata Motors Ltd Automobile

Tata Motors DVR Ordinary Manufacturing

Tata Consultancy Services Ltd Information Technology Sun Pharmaceutical India Ltd Healthcare

State Bank of India Banking Power Grid Corporation Power

ONGC Ltd Oil & Gas

NTPC Ltd Power

Maruti Suzuki Ltd Automobile Mahindra & Mahindra Ltd Automobile

L&T Ltd Manufacturing

Kotak Mahindra Bank Ltd Banking

ITC Ltd FMCG

Infosys Ltd Information Technology

Cipla Healthcare

ICICI Bank Ltd Banking

HDFC Finance

Hindustan Unilever Ltd FMCG

Hero Motor Corp Automobile

HDFC Bank Ltd Banking

Dr Reddy Labs Ltd Healthcare

Coal India Ltd Mining

Bharati Airtel Ltd Telecom

Bajaj Auto Ltd Automobiles

AXIS Bank Banking

Asian Paints Ltd Manufacturing

Adani Ports & SEZ Ltd Infrastructure

Reliance Industries Oil & Gas

(4)

Table 2: Firm characteristics regression coefficients using market model

Company Name 16

th

General Elections 2014 17

th

General Elections 2019

α β α β

Lupin Ltd 0.0018 -0.048 0.0002 0.573

Wipro Ltd -4.1E-05 0.108 0.0004 0.258

Tata Steel Ltd 0.0037 1.235 -0.001 1.436

Tata Motors Ltd -0.0001 1.147 -0.0013 1.862

Tata Motors DVR Ordinary 0.0029 1.697 -0.0016 1.832

Tata Consultancy Services Ltd 0.0014 0.091 0.0006 0.475

Sun Pharmaceutical India Ltd 0.0028 0.0592 -0.0007 1.028

State Bank of India 0.0019 1.785 0.0017 1.621

Power Grid Corporation 0.0015 1.323 0.0007 0.521

ONGC Ltd -0.0005 1.916 -0.0007 0.9743

NTPC Ltd 0.0006 1.262 -6.2E-06 0.7734

Maruti Suzuki Ltd 0.0022 1.213 -0.0015 1.4210

Mahindra & Mahindra Ltd 0.0003 0.772 -0.0022 1.2146

L&T Ltd 0.0005 1.583 0.0006 1.2712

Kotak Mahindra Bank Ltd 0.0009 0.863 0.0013 0.8954

ITC Ltd -0.0006 0.334 -0.0011 0.6224

Infosys Ltd -0.001 0.365 0.0011 0.3135

Cipla 0.0013 0.163 3.5E-05 0.7980

ICICI Bank Ltd -0.0005 1.566 0.0006 1.3761

HDFC -0.0003 1.070 0.0011 1.1894

Hindustan Unilever Ltd 0.0009 0.252 4.0E-05 0.5747

Hero Motor Corp -8.61E-05 1.139 -0.0004 1.2600

HDFC Bank Ltd -0.0003 1.022 9.4E-05 0.9298

Dr Reddy Labs Ltd 4.28E-05 -0.255 -0.0003 -0.0989

Coal India Ltd 0.0013 1.619 -0.0011 0.5245

Bharati Airtel Ltd 4.67E-06 0.850 -0.0008 1.0159

Bajaj Auto Ltd -0.0003 0.569 -0.0018 0.6677

AXIS Bank 0.0021 1.351 -0.0004 1.1294

Asian Paints Ltd 0.0006 0.679 -8.1E-05 0.7352

Adani Ports & SEZ Ltd 0.0012 2.364 0.0012 1.1614

Reliance Industries -0.0016 1.500 -0.0007 1.1735

perceived positively by the market and reflected in the stock prices.

Table 4 shows the results for each of the 83 days’ event window, 41 pre-election announcements, and 41 post- election announcements for the entire sample of 31 companies of the 17th General Elections conducted in 2019.

It reports the average daily AR, AARs, CARs and CAAR for the days t−41 to t+41 along with the test statistics obtained

using the MS Excel descriptive analysis tool for testing the

null hypothesis. The AARs are negative on the days t-41,t-

39,t-38,t-37,t-36,t-32,t-30, t-23, t-12,t-9, t-6,t-4,t-3, t3, t4,t5

t6, t8, t10, t11, t13,t15 ,t18 However, it is observed that

there are significantly positive AARs on most of the post-

election result announcement days. CAAR is also seen

to be significantly positive in the event window. The null

hypothesis (H0) is accepted. It indicates that post-election

(5)

Table 3: Daily Average AR and t statistics of 16th General Elections (2014) as per Market Model

Day t AAR% T stat Null hypothesis test CAR% CAAR%

-39 30.154 0.8416 Can’t Reject Ho 9.35 30.15

-38 16.355 0.5042 Can’t Reject Ho 5.07 46.51

-37 -20.330 -0.916 Can’t Reject Ho -6.30 26.18

-36 11.196 0.4130 Can’t Reject Ho 3.47 37.37

-35 12.327 1.5516 Can’t Reject Ho 3.82 49.70

-34 -19.434 -0.692 Can’t Reject Ho -6.02 30.27

-33 29.494 1.3216 Can’t Reject Ho 9.14 59.76

-32 -2.280 -0.081 Can’t Reject Ho -0.71 57.48

-31 15.788 0.6910 Can’t Reject Ho 4.89 73.27

-30 30.567 1.5974 Can’t Reject Ho 9.48 103.84

-29 11.129 0.4101 Can’t Reject Ho 3.45 114.97

-28 15.586 0.5371 Can’t Reject Ho 4.83 130.55

-27 19.570 0.7862 Can’t Reject Ho 6.07 150.12

-26 5.093 0.2357 Can’t Reject Ho 1.58 155.22

-25 -1.803 -0.107 Can’t Reject Ho -0.56 153.41

-24 7.397 0.3779 Can’t Reject Ho 2.29 160.81

-23 19.781 0.5832 Can’t Reject Ho 6.13 180.59

-22 30.277 0.9954 Can’t Reject Ho 9.39 210.87

-21 20.362 1.1130 Can’t Reject Ho 6.31 231.23

-20 -0.178 -0.005 Can’t Reject Ho -0.06 231.05

-19 19.615 0.6324 Can’t Reject Ho 6.08 250.67

-18 -3.409 -0.143 Can’t Reject Ho -1.06 247.26

-17 2.159 0.0677 Can’t Reject Ho 0.67 249.42

-16 -6.497 -0.350 Can’t Reject Ho -2.01 242.92

-15 -17.188 -0.886 Can’t Reject Ho -5.33 225.73

-14 10.309 0.3681 Can’t Reject Ho 3.20 236.04

-13 7.565 0.3249 Can’t Reject Ho 2.35 243.61

-12 -25.262 -1.208 Can’t Reject Ho -7.83 218.34

-11 2.715 0.1301 Can’t Reject Ho 0.84 221.06

-10 -7.308 -0.347 Can’t Reject Ho -2.27 213.75

-9 -9.372 -0.464 Can’t Reject Ho -2.91 204.38

-8 -18.227 -0.927 Can’t Reject Ho -5.65 186.15

-7 10.839 0.4710 Can’t Reject Ho 3.36 196.99

-6 3.600 0.2512 Can’t Reject Ho 1.12 200.59

-5 -1.335 -0.058 Can’t Reject Ho -0.41 199.26

-4 -14.566 -0.436 Can’t Reject Ho -4.52 184.69

-3 13.194 0.3697 Can’t Reject Ho 4.09 197.88

-2 35.672 0.9876 Can’t Reject Ho 11.06 233.56

-1 -7.960 -0.252 Can’t Reject Ho -2.47 225.60

0 -7.15 -0.158 Can’t Reject Ho -2.22 218.44

1 -5.239 -0.067 Can’t Reject Ho -1.62 213.20

(6)

2 7.502 0.1784 Can’t Reject Ho 2.33 220.71

3 -1.529 -0.051 Can’t Reject Ho -0.47 219.18

4 5.651 0.1641 Can’t Reject Ho 1.75 224.83

5 25.969 0.7215 Can’t Reject Ho 8.05 250.80

6 -25.448 -0.687 Can’t Reject Ho -7.89 225.35

7 4.728 0.2224 Can’t Reject Ho 1.47 230.08

8 -15.540 -0.532 Can’t Reject Ho -4.82 214.54

9 21.709 0.6864 Can’t Reject Ho 6.73 236.25

10 85.441 1.8576 Can’t Reject Ho 26.49 321.69

11 -20.304 -0.6846 Can’t Reject Ho -6.29 301.38

12 3.895 0.1039 Can’t Reject Ho 1.21 305.28

13 26.756 1.0609 Can’t Reject Ho 8.29 332.04

14 -0.505 -0.018 Can’t Reject Ho -0.16 331.53

15 41.473 1.0981 Can’t Reject Ho 12.86 373.00

16 52.163 1.2925 Can’t Reject Ho 16.17 425.17

17 15.214 0.5049 Can’t Reject Ho 4.72 440.38

18 12.577 0.3938 Can’t Reject Ho 3.90 452.96

19 10.863 0.4042 Can’t Reject Ho 3.37 463.82

20 -36.040 -1.649 Can’t Reject Ho -11.17 427.78

21 -16.785 -0.691 Can’t Reject Ho -5.20 410.99

22 10.282 0.4805 Can’t Reject Ho 3.19 421.28

23 30.313 1.2527 Can’t Reject Ho 9.40 451.59

24 15.818 0.4121 Can’t Reject Ho 4.90 467.41

25 18.664 1.0143 Can’t Reject Ho 5.79 486.07

26 33.677 0.9305 Can’t Reject Ho 10.44 519.75

27 -36.113 -1.953 Reject Ho -11.20 483.64

28 20.544 0.6784 Can’t Reject Ho 6.37 504.18

29 20.849 0.8620 Can’t Reject Ho 6.46 525.03

30 30.337 0.8674 Can’t Reject Ho 9.40 555.36

31 0.328 0.0129 Can’t Reject Ho 0.10 555.69

32 14.557 0.4735 Can’t Reject Ho 4.51 570.25

33 33.389 1.0479 Can’t Reject Ho 10.35 603.64

34 -0.949 -0.040 Can’t Reject Ho -0.29 602.69

35 -1.899 -0.112 Can’t Reject Ho -0.59 600.79

36 7.226 0.2799 Can’t Reject Ho 2.24 608.02

37 -36.867 -1.407 Can’t Reject Ho -11.43 571.15

38 -26.918 -0.977 Can’t Reject Ho -8.34 544.23

39 1.841 0.0834 Can’t Reject Ho 0.57 546.07

40 4.388 0.1456 Can’t Reject Ho 1.36 550.46

41 22.465 0.8201 Can’t Reject Ho 6.96 572.93

42 6.570 0.2593 Can’t Reject Ho 2.04 579.50

(7)

Table 4: Daily Average AR and t statistics of 17th General Elections (2019) as per Market Model

Day t AAR% T stat Reject/Accept CAR CAAR

-41 -0.570 -2.1181 Reject Ho -17.678 -0.570

-40 0.109 0.4778 Can’t Reject Ho 3.369 -0.462

-39 -0.118 -0.4855 Can’t Reject Ho -3.673 -0.580

-38 -0.198 -1.0064 Can’t Reject Ho -6.144 -0.778

-37 -0.380 -2.5089 Can’t Reject Ho -11.790 -1.159

-36 -0.237 -0.8605 Can’t Reject Ho -7.346 -1.396

-35 0.293 1.6522 Can’t Reject Ho 9.075 -1.103

-34 0.513 1.3251 Can’t Reject Ho 15.894 -0.590

-33 1.320 3.2362 Can’t Reject Ho 40.914 0.730

-32 -0.530 -2.9011 Reject Ho -16.427 0.200

-31 0.018 0.0866 Can’t Reject Ho 0.566 0.218

-30 -0.116 -0.6118 Can’t Reject Ho -3.592 0.102

-29 0.035 0.1975 Can’t Reject Ho 1.077 0.137

-28 0.213 0.8280 Can’t Reject Ho 6.596 0.350

-27 0.775 2.4060 Can’t Reject Ho 24.034 1.125

-26 0.151 0.8189 Can’t Reject Ho 4.692 1.276

-25 0.112 0.5567 Can’t Reject Ho 3.484 1.389

-24 0.702 1.7484 Can’t Reject Ho 21.749 2.090

-23 -0.196 -0.9878 Can’t Reject Ho -6.089 1.894

-22 0.127 0.5885 Can’t Reject Ho 3.926 2.021

-21 0.496 2.7846 Can’t Reject Ho 15.385 2.517

-20 0.039 0.1293 Can’t Reject Ho 1.213 2.556

-19 -0.678 -2.3051 Reject Ho -21.016 1.878

-18 0.260 1.6540 Can’t Reject Ho 8.064 2.138

-17 -0.443 -1.2868 Can’t Reject Ho -13.729 1.695

-16 -0.068 -0.2769 Can’t Reject Ho -2.118 1.627

-15 -0.193 -0.7088 Can’t Reject Ho -5.985 1.434

-14 0.096 0.4486 Can’t Reject Ho 2.986 1.530

-13 0.022 0.1093 Can’t Reject Ho 0.680 1.552

-12 -0.109 -0.4020 Can’t Reject Ho -3.387 1.443

-11 0.034 0.2362 Can’t Reject Ho 1.060 1.477

-10 0.137 0.6385 Can’t Reject Ho 4.234 1.614

-9 -0.095 -0.3239 Can’t Reject Ho -2.950 1.519

-8 -0.662 -1.8576 Reject Ho -20.507 0.857

-7 0.170 0.5546 Can’t Reject Ho 5.275 1.027

-6 -0.817 -2.5988 Reject Ho -25.315 0.211

-5 0.074 0.3587 Can’t Reject Ho 2.308 0.285

-4 -0.421 -1.3574 Can’t Reject Ho -13.049 -0.136

-3 -0.146 -0.4345 Can’t Reject Ho -4.538 -0.282

-2 -0.593 -2.0608 Reject Ho -18.387 -0.875

-1 0.207 1.0661 Can’t Reject Ho 6.419 -0.668

(8)

0 0.537 1.7188 Can’t Reject Ho 16.651 -0.131

1 0.120 0.5219 Can’t Reject Ho 3.712 -0.011

2 0.014 0.0482 Can’t Reject Ho 0.424 0.002

3 -0.189 -0.9039 Can’t Reject Ho -5.847 -0.186

4 -0.369 -1.6518 Reject Ho -11.433 -0.555

5 -0.250 -1.0807 Can’t Reject Ho -7.742 -0.805

6 -0.007 -0.0309 Can’t Reject Ho -0.206 -0.812

7 0.243 0.8880 Can’t Reject Ho 7.542 -0.568

8 -0.006 -0.0293 Can’t Reject Ho -0.199 -0.575

9 0.416 1.9421 Can’t Reject Ho 12.886 -0.159

10 -0.516 -2.8257 Reject Ho -16.007 -0.675

11 -0.050 -0.2352 Can’t Reject Ho -1.544 -0.725

12 0.021 0.0957 Can’t Reject Ho 0.643 -0.705

13 -0.002 -0.0116 Can’t Reject Ho -0.056 -0.706

14 0.040 0.2853 Can’t Reject Ho 1.255 -0.666

15 -0.090 -0.5286 Can’t Reject Ho -2.800 -0.756

16 -0.334 -1.7773 Reject Ho -10.360 -1.090

17 -0.049 -0.2602 Can’t Reject Ho -1.508 -1.139

18 -0.534 -1.7948 Reject Ho -16.555 -1.673

19 0.147 0.6200 Can’t Reject Ho 4.550 -1.526

20 0.103 0.5133 Can’t Reject Ho 3.190 -1.423

21 -0.038 -0.1609 Can’t Reject Ho -1.191 -1.462

22 0.057 0.3255 Can’t Reject Ho 1.774 -1.405

23 0.381 1.7172 Can’t Reject Ho 11.816 -1.023

24 0.270 1.0954 Can’t Reject Ho 8.373 -0.753

25 -0.038 -0.2262 Can’t Reject Ho -1.185 -0.792

26 0.059 0.2145 Can’t Reject Ho 1.827 -0.733

27 -0.281 -1.2478 Can’t Reject Ho -8.716 -1.014

28 -0.085 -0.8022 Can’t Reject Ho -2.643 -1.099

28 0.060 0.4004 Can’t Reject Ho 1.850 -1.039

30 -0.857 -2.4947 Reject Ho -26.563 -1.896

31 -0.528 -2.0366 Reject Ho -16.371 -2.424

32 0.366 1.2729 Can’t Reject Ho 11.350 -2.058

33 -0.104 -0.5124 Can’t Reject Ho -3.211 -2.162

34 0.373 1.5735 Can’t Reject Ho 11.551 -1.789

35 0.179 0.6871 Can’t Reject Ho 5.553 -1.610

36 -0.221 -0.6870 Can’t Reject Ho -6.863 -1.832

37 0.565 2.2827 Can’t Reject Ho 17.518 -1.266

38 -0.435 -2.2904 Reject Ho -13.498 -1.702

39 -0.728 -2.4580 Can’t Reject Ho -22.568 -2.430

40 -0.173 -0.7937 Can’t Reject Ho -5.377 -2.603

41 0.769 2.2467 Can’t Reject Ho 23.833 -1.835

(9)

announcements, the returns of the stocks did boost for majority of the stocks in the sample. A new party came into power the second time in the 17th General Elections.

Table 5 shows the comparison of AAR across different event windows for the 16th and 17th General Elections. In the pre-election phase stock market reaction was different for both the elections. In the 16th General Election H0 was rejected at 5-percent level of significance, but during the Election and the Post-Election phase the AAR was positive and H0 is accepted. This could be probably because the same party was in power for 49 long years and the expectation that any other party will win and gain majority was a difficult thing to believe taking the past history of Indian politics into consideration. The AAR in the Election and the post-election stage was positive probably because the people wanted the change and the reaction is shown in the returns of stock market. In the 17th General Elections, when a new party came to power for the second consecutive time, the AAR was found positive in the pre-election stage and became negative during elections and the post-election scenario. It is observed that the stock market reaction was more intense when a party came to power for the first time than the second time.

5. Conclusions

India being the largest democracy in the world, politics and elections have an important role to play. The study examines the extent of influence of General Elections on the Indian stock market and the impact on the market sentiments between two elections would be the same when the same party comes to power for the second time. A healthy economy increases the chances of re-election for an incumbent candidate or party. The study reveals that there is a positive market reaction to elections in terms of AAR%

in case of Indian stock market. A sample of 31 BSE listed companies are taken for the study. The AAR is computed for the 82 days event window around the event day – election results during 2014 and 2019. The study finds the evidence of a positive AR around the election dates and confirms that elections have a positive and a favorable impact on the stock market performance of stocks in the Indian context which is in line with the previous studies. However, it is observed that the stock market reaction was more intense when a party came to power for the first time than the second time.

The study is based on two general election cycles in India. The result holds true for the select sample and during the period considered for the study. It may not be generalized for different market environments. The implications of this study are that investors can take precautionary steps before trading in stocks in the period of General Election. Risk- averse investors can avoid trading around national elections to avoid the risk linked with volatility of stocks during the elections. The result of this study will help investors to understand the stock market better and evaluate the impact of politics on stock markets during elections.

References

Angela, K., & Ngugi, W. (2007). Stock Market Performance Before and After General Elections: A case of The Nairobi Stock Exchange (Doctoral dissertation). University of Nirobi, Nirobi, Kenya.

Bialkowski, J., Gottschalk, K., & Wisniewski, T. P. (2008). Stock market volatility around National elections. Journal of Banking

& Finance, 32(9), 1941-1953.

Booth, J. R., & Booth, L. C. (2003). Is presidential cycle in security returns merely a reflection of business conditions? Review of Financial Economics, 12(2), 131-159.

Table 5: Comparison of AAR across different event windows for the General Elections 2014 & 2019 16th General Elections 2014

Event window AAR% T stat Null hypothesis test Significance

Pre-Election Phase 1.534 1.8142 Reject Ho *

Election Phase 0.650 0.6156 Can’t Reject Ho -

Post-Election Phase 3.611 2.5297 Can’t Reject Ho -

* Significant at 5% level of significance

17th General Elections 2019

Event window AAR% T stat Null hypothesis test Significance

Pre-Election Phase 1.519 1.619 Can’t Reject Ho -

Election Phase -1.650 -1.744 Can’t Reject Ho -

Post-Election Phase -1.607 -1.198 Can’t Reject Ho -

* Significant at 5% level of significance

(10)

Brown, S. J., & Warner, J. B. (1985). Using daily stock returns: The case of event studies. Journal of Financial Economics, 14, 3–31.

Chavali, K., & Zahid, Z. (2011). Impact of stock splits on stock price performance of selected companies in Indian context.

Afro-Asian J. of Finance and Accounting, 2(3), 270-282.

Dinc, S. (2005). Politicians and banks: Political influences on government-owned banks in emerging countries. Journal of Financial Economics, 77(2), 453-459.

Fama, E., Fisher, L., Jensen, M. C., & Roll, R. (1969). The adjustment of stock prices to new information. International Economic Review, 10, 1–21.

Fama, E. (1970). Efficient capital markets: a review of theory and empirical work. The Journal of Finance, 2, 383–417.

Fama, E. (1991). Efficient capital markets II. The Journal of Finance, 46, 1575–1618.

Foster, L. (2012). Does the US Presidential Election Impact the Stock Market?

Gomez, E. T., & Jomo, K. S. (1999). Malaysia’s Political Economy:

Politics, Patronage and Profits. Cambridge, UK: Cambridge University Press.

Huang, R. D. (1985). Common stock returns and Presidential elections. Financial Analysts Journal, 41(2), 58-61.

Hung, L. C. (2011). The Presidential Election and the Stock Market in Taiwan. Journal of Business and Policy Research, 6(2), 36-48.

Hong, H. (2016). Information Cascade and Share Market Volatility:

A Chinese Perspective. Journal of Asian Finance, Economics and Business, 3(4), 17-24. https://doi.org/10.13106/jafeb.2016.

vol3.no4.17

Kumar, D. B., Sophia, S., & Maria, E. (2015). Empirical study on Effects of the Lok Sabha Elections on stock market performance.

Research Journal of Management Sciences, 14(2), 1-9.

Leblang, D., & Mukherjee, B. (2005). Government Partisanship, Elections, and the Stock Market: Examining American and British Stock Returns, 1930–2000. American Journal of Political Science, 9(4), 780–802.

Lee, J. W., & Brahmasrene, T. (2018). An Exploration of Dynamical Relationships between Macroeconomic Variables and Stock Prices in Korea. Journal of Asian Finance, Economics and Business, 5(3), 7-17. http://doi.org/10.13106/jafeb.2018.vol5.no3.7 Liu, L. F. (2007). An Empirical study of Presidential Elections

Effect on Stock Market in Taiwan, South Korea, Singapore, Philippine, and Indonesia. Research Journal of Management Sciences, 4(2), 1-9.

Nordhaus, W. (1975). The political business cycle. Review of Economic Studies. 42(2), 169-190.

Nguyen, C. T., & Nguyen, M. H. (2019). Modeling Stock Price Volatility: Empirical Evidence from the Ho Chi Minh City Stock Exchange in Vietnam. Journal of Asian Finance, Economics and Business, 6(3), 19-26. https://doi.org/10.13106/

jafeb.2019.vol6.no3.19

Salamudin, N., Ariff, M., & Nassir, A.M. (1999). Economic influence on rights issue announcement behaviour in Malaysia.

Pacific-Basin Finance Journal, 7(3), 405-427.

Santa-Clara, P., & Valkanov, R. (2003). The Presidential Puzzle:

Political Cycles and the Stock Market. The Journal of Finance, 58(5), 1841-1872.

Siokis, F., & Kapopoulos, P. (2007). Parties Functions and Stock Market Volatility: Evidence from a small open economy.

Economics and Politics, 19(1), 123-133.

Siokis, F., & Kapopoulos, P. (2003). Electoral Management, Political Risk and Exchange Rate Dynamics: The Greek Experience. Applied Financial Economics, 13, 279-285.

Wong, W. Y., & Hooy, C. W. (2016). The Impact of Election on Stock Market Returns of Government-Owned Banks: The Case of Indonesia, Malaysia and Thailand. Asian Journal of Business and Accounting, 9(1), 31-57.

Wang, Y. H., Lee, M. Y., & Ling, C. Y. (2008). General Election,

Political Change and Market Efficiency: Long and Short-Term

Perspective in Developed Stock Market. Journal of Money,

Investment and Banking, 9, 61-78.

수치

Table 1 shows the list of sample companies taken from  BSE to test the impact of elections on stock market.
Table 2: Firm characteristics regression coefficients using market model
Table 3: Daily Average AR and t statistics of 16th General Elections (2014) as per Market Model
Table 4: Daily Average AR and t statistics of 17th General Elections (2019) as per Market Model
+2

참조

관련 문서

Furthermore, a guideline will be provide you with preliminary data using Big Data to prepare for sudden price fluctuation because expected economic crisis, stock market

Second, in Korea, it is necessary to strengthen market monitoring by using supply - demand related indicators, to diagnose and assess housing markets regularly,

Abstract This study attempts to empirically investigate the excess returns of growth stocks in the Korean stock market comparing with those of value

Effects of Additional Constraints on Performance of Portfolio Selection Models with Incomplete Information : Case Study of Group Stocks in the Korean Stock