Vol. 44, No. 3, September 2018, 231-238 http://dx.doi.org/10.15230/SCSK.2018.44.3.231
1)
† 주 저자 (e-mail: [email protected]) call: 031)709-9070
기계적 평가와 이미지를 이용한 얼굴의 번들거림과 윤기의 분류 기준의 연구
장 윤 정⋅김 보 라*⋅문 태 기⋅김 남 수⋅이 선 화⋅이 혜 지†
(주)엘리드
*목원대학교 테크노과학대학 생의약화장품학부
(2018년 5월 25일 접수, 2018년 7월 3일 수정, 2018년 8월 7일 채택)
The Differentiation Criteria between Greasiness and Shininess on The Face Using Mechanical Evaluation and Image
YoonJung Jang, Bora Kim*, Tae Kee Moon, Nam Soo Kim, Sun Hwa Lee, and Hye-ji Lee†
Ellead Co., Ltd., 325 Hwangsaeul-ro, Bundang-gu, Seongnam-si, Gyeonggi-do 13950, Korea
*Division of Biomedicinal Chemistry & Cosmetics, College of Techno-sciences, Mokwon University, Daejeon 35349, Korea (Received May 25, 2018; Revised July 3, 2018; Accepted August 7; 2018)
요 약: 얼굴 피부는 신체 건강을 표현할 뿐만 아니라 매력을 결정하는 요소 중 하나이다. 특히 윤기 나는 피부는 대부분의 사람들이 선호하며 윤기 나는 피부 표현을 위해 다양한 화장품들이 만들어져왔다. 하지만 윤기 있는 피부는 주관적 평가이기 때문에 기름진 피부의 경우 기존의 피부 윤기 평가 방법으로는 명확한 윤기 있는 피부로 평가하기가 어렵다. 더욱이 윤기와 유사하게 광이 있지만 부정적으로 평가되는 번들거리는 피부와 명확한 분류 기준 또한 없는 상황이다. 본 연구에서는 피부측정 파라미터 5개[피부 광채, 피부 보습, 피부 투명도, 피부 피지, 안면 이미지]를 측정하였고, 연구대상자들이 촬영된 안면 이미지를 근거하여 각각의 윤기 있는 피부와 번들거리 는 피부의 이미지를 선별하여 피부 측정의 정량화를 통해 비교 분석하였다. 그 결과 번들거리는 피부에서 피부 광채 및 피지 증가, 투명도 감소, 보습 감소를 확인하였다. 그러나 윤기 있는 피부의 경우 피부 광채, 피지, 투명 도는 유사한 패턴을 보였지만 보습이 유의차 있게 증가하는 결과를 보였다. 본 연구에서는 기기측정 및 정량적 평가를 통해서 윤기 있는 피부와 번들거리는 피부를 분류하는 객관적 평가 기준을 제시하고자 한다.
Abstract: The facial skin condition expresses physical healthy as well as is considered one of important factors for attractiveness. Especially, most people prefer shiny skin. So various cosmetics has been manufactured for expression of shiny skin. However, shiny skin is subjectively evaluated, and difficult to evaluate clear shininess using the existing method in oily skin. Moreover, there is no clear classification criteria between shininess and glossiness, which is as- sessed negatively in the skin. So there has not been a reference value by mechanical measurement to define and classify shiny skin from greasy skin. In this study, we measured skin biophysical parameters (gloss, hydration, translucency and sebum) and facial images which are selected by volunteers using sensory evaluation. According to the measurement re- sults, the values of gloss, sebum, and translucency were similar in both shiny and greasy skin; the values of sebum and gloss increased, whereas those of translucency decreased. However only skin moisture values statistically increased in shiny skin. In conclusion, we propose objective assessment criteria for classifying shiny and greasy skin using device measurement and quantitative assessment.
Keywords: skin gloss, shiny skin, greasy skin, skin hydration, image anlaysis
1. Introduction
Healthy skin plays a primary role in protecting and pre- serving skin integrity[1]. Furthermore, skin expression is one indicator of attraction. Especially, Many people prefer shiny skin. So shiny skin is a topic of interest in cosmetics. However, the objective definition of shiny skin has been insufficiently reported. In addition, there has not been an independent standard method to define shiny skin with instruments.
Generally, glossy or shiny facial skin is attributed to the skin sebum and moisture levels. An optimal sebum level provides the facial skin with a shiny, radiant, and smooth texture. However, the overproduction of sebum causes the skin to appear oily or greasy[2-5] and can lead to breakouts (acne)[6-8]. Numerous studies have evaluated skin quality of greasiness and shininess[3,5,9]. Greasy skin has been traditionally evaluated by the amount of se- bum secretion and a visual assessment scale based on a survey. Shiny skin has been measured by the intensity of skin surface reflection. However, these methods are weak because both skin conditions are expressed by the same term (gloss), and psychological attributes influence the results. To overcome these limitations, previous study[9]
evaluated facial glossiness using sensory evaluations and quantitative methods through image processing. However, that study did not distinguish by difference between greasiness and shininess using mechanical instruments.
The aim of this study was to differentiate shininess from greasiness. We conducted experiments through sen- sory evaluation of images, measurements of various skin biological parameters, and analysis of images. Next, the volunteers selected the time at which the skin appeared the shiniest and greasiest based on their images taken at specific time points. Based on the sensory evaluation by volunteers, the quantitative data were classified into shiny and greasy skin. In addition, the distribution of gloss on the face was observed through image analysis.
2. Experimental
2.1. Volunteers and Conditions
Korean female volunteers (N = 20, aged 20-33 years old, average age; 27.10 years) participated after signing the informed consent. The criteria for participation were:
not having skin disorder, not being the period of lactation or pregnancy. All measurements and photographs were obtained in a controlled room with constant humidity and temperature (relative humidity: 40-60% and temperature 20-24 ℃). The measurements and photographs were ob- tained at baseline (T0: at 30 min after washing the volun- teer’s face) and at 1 (T1: at 1 h after washing the volun- teer’s face), 3 (T3: at 3 h after washing the volunteer’s face), and 6 (T6: at 6 h after washing the volunteer’s face) h after washing the face using the same cleansing form. It was measured on the cheek and the forehead (T-zone).
2.2. Skin Sebum
Sebumeter (SM810, Courage & Khazaka electronics, Germany) measures facial sebum secretion. This instru- ment calculates the amount of sebum per unit area (µg/cm
2) by placing an absorption tape on the skin and measuring the amount of sebum the tape absorbs using a photometric reflection method.
2.3. Skin Gloss
The skin gloss values were measured using a Skin gloss meter (Delfin Technologies Ltd, Kuopio, Finland) with a built-in 635-nm red semiconductor diode laser. The instrument shoots a laser beam into the skin surface and the reflected light is detected. The detected light then passes through the internal diffractive microstructure and the intensity of the beam is measured.
2.4. Skin Hydration
Skin hydration was evaluated with a Corneometer
(CM825, Courage & Khazaka, Germany). Its measuring
principle is based on the capacitance measurement of a
dielectric medium.
2.5. Skin Translucency
To measure skin translucency, subsurface reflection was acquired on the cheek by Translucencymeter (TLS850, Diastron Ltd, Andover, UK). The instrument measures the reflected light from the transmitted RGB LED beam to the skin. It calculates transparency values by using side- and back-scattered light.
The translucency values consist of the following pa- rameters:
Alpha: translucency exponential decay K: curve fit intercept on the vertical axis Area: total area under the curve fit
2.6. Sensory Evaluation and Image Analysis
In this study, sensory evaluations and image analysis were performed using images captured by VISIA-CR (Canfiled Imaging System, USA). The photographs were obtained using parallel-polarization mode at each time point. The volunteers evaluated greasy or shiny skin by sensory evaluation their facial images. To observe changes in the intensity and site of gloss, we extracted a gloss site from captured images by using graphic editing programs. We controlled the threshold on the extracted images and selected the pixels from gloss areas on the images for further analysis.
2.7. Statistical Analysis
Statistical evaluation was performed using SPSS stat- istical package (Release 21, SPSS Inc., Chicago, IL, USA). We analyzed statistical data by using repeated analysis of variance and Friedman and Wilcoxon sign- ed-rank test with Homl-Bonferroni correction in 95% con- fidence intervals.
3. Results and Discussion
3.1. Sensory Evaluations: Selection of Shiny or Greasy Skin Images by Volunteers
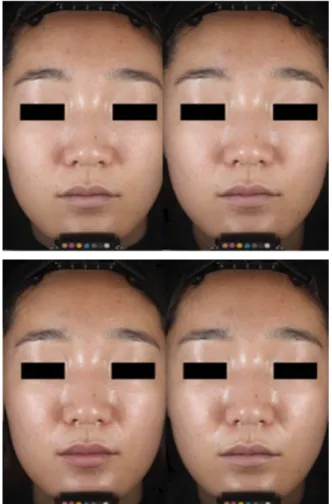
Figure 1 shows representative facial images obtained using the parallel-polarization mode of VISIA-CR at four times for 6 h. Based on the images, we had volunteers
look at their facial images and select those where they thought their skin looked greasy or shiny. In the sensory evaluations, most volunteers selected an image at 1 h after washing their face as the shiniest. However, there were slight differences in selected times; 3 of the 20 volunteers selected an image at a different time as the shiniest. All volunteers selected an image at 6 h as the greasiest. All volunteers answered their skin types. The group were div- ided in based on their answers: dry skin (n=10), neutral skin (n=4), oily skin (n=4), and complex skin (n=2).
3.2. Comparison of the Measurement Values of Shiny or Greasy Skin
To compare the condition of the skin when it looks shi-
ny or greasy, we measured the skin hydration, sebum,
Figure 1. Representative volunteer’s facial images which the parallel-polarization mode by VISIA-CR over time.gloss, and translucency values at the specific time points.
Table 1 shows the various skin parameters at each time point on the cheek and forehead (T-zone). The skin gloss and sebum values increased over time, and a similar pat- tern was observed in on both sites. Compared to these pints with T0, the gloss and sebum values at each sub- sequent time point had significant increase. In the parame- ters of the skin translucency, the alpha values increased at each time point and showed no significant differences from those at T0. In addition, values of K and area de- creased at each time point compared to those at T0, with
significant differences. This indicated that skin trans- lucency decreases over time. However, skin moisture ex- hibited different patterns. The skin moisture levels in- creased to a peak in the curve at T1 and then decreased.
The increase level from T0 to T1 was significant.
Compared to these pints with T0, the moisture values at T3 and T6 on the forehead and T3 on the cheek were not significant. Furthermore, with respect to the moisture val- ues at T0 and T6 on the cheek, the decrease in values at T6 was significant.
Table 2 describes various measurement parameter re-
Timebaseline (T0) 1 h (T1) 3 h (T3) 6 h (T6)
Skin parameters
Forehead (T-zone)
Sebum (µg/cm2) 134.250 ± 102.355 186.350 ± 20.634† 251.950 ± 114.243† 291.500 ± 109.319† Gloss (A.U.) 63.033 ± 7.050 68.702 ± 6.857*** 72.015 ± 6.306*** 76.047 ± 7.306***
Moisture (A.U.) 71.223 ± 9.015 73.015 ± 8.088* 71.810 ± 6.357 69.620 ± 6.619
Cheek
Sebum (µg/cm2) 116.050 ± 94.515 172.850 ± 111.742† 250.250 ± 122.163† 271.150 ± 115.089† Gloss (A.U.) 60.927 ± 4.904 65.625 ± 6.011*** 69.952 ± 6.940*** 75.557 ± 10.959***
Moisture (A.U.) 78.895 ± 5.532 80.877 ± 4.838** 79.223 ± 4.638 76.377 ± 5.365**
Transparency (A.U.)
Alpha 0.0283 ± 0.0010 0.0284 ± 0.0011 0.0285 ± 0.0013 0.02850 ± 0.0012 K 2088.500 ± 243.134 2040.700 ± 242.212*** 1994.717 ± 246.926*** 1971.633 ± 251.087***
Area 74754.883 ± 8532.903 73053.033 ± 8765.804*** 71109.783 ± 9007.602***70228.400 ± 8876.124***
*Significant difference between the baseline (T0) value and after various times (Repeated measures ANOVA, significant: **P < 0.01, ***P
< 0.001, Friedman and Wilcoxon signed-rank test with Holm-bonferroni correction, significant: †P < 0.05).
Table 1. The Mean Values of Various Skin Parameters on Forehead (T-zone) and Cheek
Skin appearance
Baseline Shiny skin Greasy skin
Skin parameters
Forehead (T-zone)
Sebum (µg/cm2) 134.250 ± 102.355 187.700 ± 112.786† 291.500 ± 109.319† Gloss (A.U.) 63.033 ± 7.050 68.300 ± 6.441*** 76.047 ± 7.306***
Moisture (A.U.) 71.223 ± 9.015 73.008 ± 8.504* 69.620 ± 6.619
Cheek
Sebum (µg/cm2) 116.050 ± 94.515 178.700 ± 115.597† 271.150 ± 115.089† Gloss (A.U.) 60.927 ± 4.904 65.418 ± 6.067** 75.557 ± 10.959***
Moisture (A.U.) 78.895 ± 5.532 80.743 ± 5.176** 76.377 ± 5.365**
Transparency (A.U.)
Alpha 0.0283 ± 0.001 0.0284 ± 0.001 0.0285 ± 0.001
K 2088.500 ± 243.134 2046.417 ± 245.497*** 1971.633 ± 251.087***
Area 74754.883 ± 8532.903 73128.767 ± 8786.219*** 70228.400 ± 8876.124***
*Significant difference between the baseline (T0) value and after various times (Repeated measures ANOVA, significant: **P < 0.01, ***P
< 0.001, Friedman and Wilcoxon signed-rank test with Holm-bonferroni correction, significant: †P < 0.05).
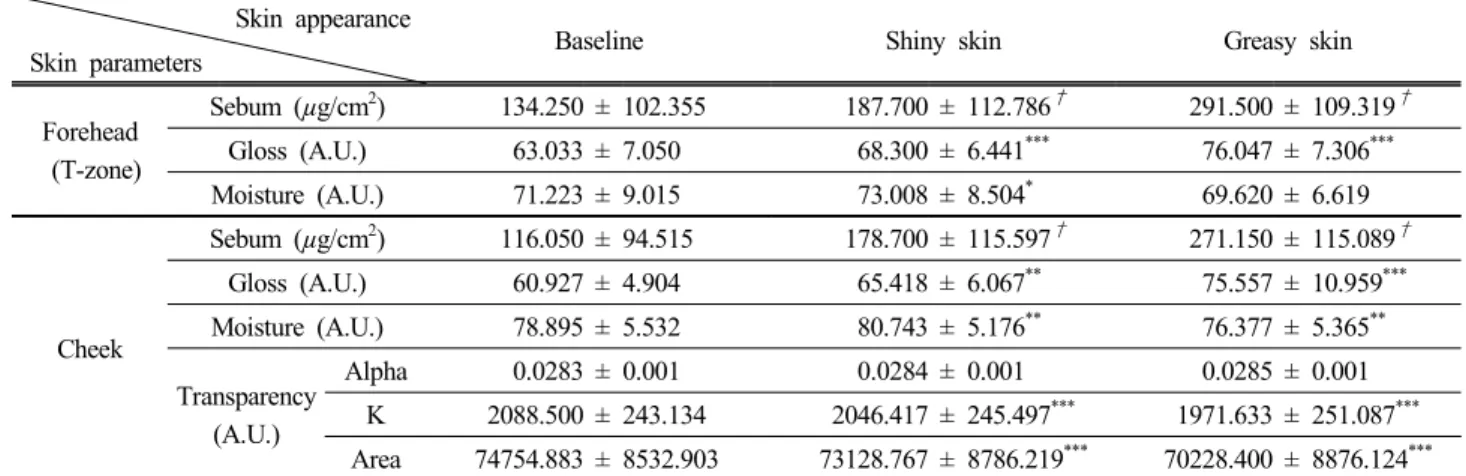
Table 2. The Mean Values of Parameter Values in Two Skin Conditions Depending on the Volunteer’s Answer
sults in two skin conditions depending on the volunteer’s answer. When volunteers thought that their skin was shi- ny and greasy, the values of gloss, sebum, and trans-
lucency showed a similar tendency; the values of sebum and gloss increased, whereas those of translucency decreased. However, skin hydration was the only factor that increased when the face looked shiny. Also, skin hy- dration decreased when the face looked greasy.
3.3. Rate of Increase in Skin Hydration and Sebum Table 3 shows the ratio of skin sebum levels to hydra- tion levels at various time points and the classification of
Forehead (T-zone) CheekTime
Baseline (T0) 1.914 ± 1.614 1.477 ± 1.196 1 h (T1) 2.584 ± 1.782 2.161 ± 1.411 3 h (T3) 3.522 ± 1.552 3.187 ± 1.572 6 h (T6) 4.206 ± 1.560 3.591 ± 1.583 Sensory evaluation
Baseline 1.914 ± 1.614 1.477 ± 1.196 Shiny skin 2.621 ± 1.661 2.258 ± 1.477 Greasy skin 4.206 ± 1.560 3.591 ± 1.583 Table 3. It Shows the Ratio of Skin Sebum Levels to Hydration Levels at Various Time Points and the Classification of Shiny or Greasy as Vulgar Fractions
Time (h) Pixel
Baseline (T0) 32010.500 ± 21857.635 1 h (T1) 68857.200 ± 55372.861**
3 h (T3) 107811.300 ± 74222.364***
6 h (T6) 131080.950 ± 83768.071***
Table 4. The Pixels from Glossy Areas on the Extracted Images Controlled Threshold
Figure 3. Overlaid images by Figure 1 and Figure 2.
Figure 2. Extracted gloss areas from parallel-polarization mode images using the graphic editing program.
shiny or greasy as vulgar fractions. As the rate of skin moisture and sebum increased, the volunteers thought their faces looked greasier. However, when the skin looked shiny, the ratio approached 2.621 on the forehead (T-zone) and 2.258 on the cheek.
3.5. Analysis of Gloss Areas from the Extracted Images In addition to image analysis, we extracted gloss areas from images by using the graphic editing programs (Figure 2). We controlled the threshold on the extracted images and selected the pixels from gloss areas on the images for further analysis (Table 4). The pixel of the gloss areas increased over time. The images in Figure 1 and Figure 2 were overlaid, resulting in another image (Figure 3). In the overlaid images, we observed that the more gloss was expanded around whole face, the greasier the face appeared.
3.6. Discussion
In this study, we measured skin hydration, sebum, gloss, and translucency levels and took the volunteers fa- cial images four times over the course of six hours. We had volunteers look at their facial images and select those where they thought their skin looked greasy or shiny. In the sensory evaluations, most volunteers identified the im- ages as shiniest at the time at which the skin hydration level was highest. Only three volunteers selected slightly different time base on their skin type. We also compared the mechanical data to the volunteers’sensory evaluations regarding greasy or shiny skin. When the skin moisture reached a low level, the volunteers felt that their skin’s condition was greasy, which was considered a negative impression. According to the measurement result, both the sebum and skin moisture values were higher in shiny skin. However, in greasy skin, the sebum increased, but the skin moisture decreased. We thought that sebum would be a key factor in differentiating greasiness from shininess, but we found that shiny skin has a significant association with skin hydration, in terms of the skin’s bio- logical factors. However, the study required to measure with more detailed measurement such as measure directly
from stratum corneum in order to exclude all the possibil- ities that affects corneometer’s the capacitance in shiny and greasy skin.
Previous studies[10-13] had suggested that skin appear- ance could be attributed to the skin’s interaction with light at the skin surface. Exceptionally moisturized skin leads to decreased scattering of light on the skin surface and an increased transmission of light into the deeper skin layers. As a result, moisturized skin has shining feature.
The most crucial factor in relation to skin moisture is the stratum corneum, which is an outer layer of the skin’s surface. Light transmittance is altered by the moisture content in the stratum corneum. Therefore, the moisture content of the stratum corneum is directly involved with the optical characteristics of the skin[11]. Additionally, it has been established that sebum levels provide the facial skin texture. Sufficient skin hydration and sebum make the skin appear smooth, soft, and shiny, whereas a lack of moisture can cause the skin to look dull and cracked, making the person appear older[14]. The skin’s condition varies depending on the skin’s hydration and sebum levels. Also, the previous study mentioned that the ratio of skin sebum levels to hydration levels is approximately 2.5 for normal skin on the T-zone of the forehead[14].
Therefore, we assumed that the optimal ratio of sebum to moisture level on facial skin exists when the skin looks shiny. Further research is required to investigate the ap- propriate ratio, because the sample size of this study was small. Furthermore, we observed that skin translucency is not a key factor in differentiating greasiness from shininess. When oil covers the surface of the skin, the transmittance of light is altered, making it difficult to measure transmittance[15].
We observed the distribution of gloss on the face
through overlaid image analysis (Figure 3). In the early
stage, gloss was observed on a three-dimensional region
on the face, like the cheekbones. However, when face be-
gan to appear greasier, gloss was observed on the concave
surface of the face, and the intensit y of gloss was gradu-
ally increased. We found that the distribution and in-
tensity of gloss on the face are crucial factors in evaluat-
ing the extent of greasiness. We confirmed that Image analysis was also an additional factor in the evaluation of greasy skin.
Consequently, we confirmed the potential of objective assessment criteria of shiny or greasy skin using the quan- titative change of measurement values in sebum and hy- dration as well as subjective assessment. But there is a fact that we cannot exclude is, the sebum and hydration level is changed depends on the age and the skin type of volunteers and this will affect the shiny and greasy skin measurement value. Therefore, the further study is needed to see whether it gives the same results or not in different skin types to compare with this study.
This study difficult to conclude it yet because the age of volunteers is concentrated in 20s and 30s, and the number of people in each skin type is small in this study.
Additional study of correlation skin types to evaluate of shiny and greasy skin is required using large number of volunteers with various age and skin type. Also, we pro- pose further study to establish the visual-grading standard of greasiness on skin through image analysis and mechan- ical evaluations.
4. Conclusion
We observed difference between shiny skin and greasy skin through the sensory evaluations and confirmed the differences by using mechanical evaluations. First, we measured skin hydration, sebum, gloss, and translucency levels for 6 h. Second, we conducted a survey to de- termine the time points at which the volunteers thought their skin seemed shiny or greasy based on their images captured during the experiment. Finally, we compared the skin’s biological parameters, which were selected as the shiniest and greasiest times. Although the facial skin looked both greasy and shiny, it could be classified ap- propriately based on the difference in skin moisture levels. We found that shiny skin had a significant associa- tion with skin hydration in terms of the skin biological factors. In image analysis, we realized that the distribution of gloss areas on the face is a additional factor in evaluat-
ing the extent of greasiness.
Additional study is required to investigate the correla- tion skin types and evaluation of shiny and greasy skin using large number of volunteers with various age and skin type. we propose a further study for establishing the visual-grading standard of greasiness on skin through im- age analysis and mechanical evaluations.
Reference
1. Skin aging handbook: an integrated approach to bio- chemistry and product development, ed. N Dayan, William Andrew, Norwich, NY (2008).
2. J. L. Burton and R. J. Pye, Seborrhoea is not a feature of seborrhoeic dermatitis, Br. Med. J., 286(6372), 1169 (1983).
3. R. Arbuckle, M. J. Atkinson, M. Clark, L. Abetz, J.
Lohs, I. Kuhagen, J. Harness, Z. Draelos, D. Thiboutot, U. Blume-Peytavi, and K. Copley-Merriman, Patient experiences with oily skin: The qualitative develop- ment of content for two new patient reported outcome questionnaires, Health Qual. Life Outcomes, 6(1), 80 (2008).
4. D. Thiboutot, Regulation of human sebaceous glands,
J. invest. dermatol., 123(1), 1 (2004).5. R. Arbuckle, M. Clark, J. Harness, N. Bonner, J. Scott, Z. Draelos, R. Rizer, Y. Yeh, and K. Copley-Merriman, Item reduction and psychometric validation of the oily skin self assessment scale (OSSAS) and the oily skin impact scale (OSIS), Value Health, 12(5), 828 (2009).
6. A. L. Zaenglein, E. M. Graber, D. M. Thiboutot, and J. Strauss, Fitzpatrick’s dermatology in general medi- cine McGraw-Hill, New York, 7, 690 (2008).
7. C. C. Zouboulis, A. Eady, M. Philpott, L. A. Goldsmith, C. Orfanos, W. C. Cunliffe, and R. Rosenfield, What is the pathogenesis of acne?, Exp. Dermatol., 14(2), 143 (2005).
8. S. W. Youn, The role of facial sebum secretion in acne pathogenesis: facts and controversies, Clinics in
dermatology, 28(1), 8 (2010).9. M. Fujii, Y. Misaki, and I. Sasaki, Application of im-
age processing technique for facial gloss evaluation,
Int. J. Cosmet. Sci., 43(3), 72 (2009).10. Z.‐X. Jiang and J. DeLaCruz, Appearance benefits of skin moisturization, Skin Res. Technol., 17(1), 51 (2011).
11. M. Ooe, K. Tanida, and T. Yamamura, Influence of hydration for optical properties of stratum corneum,
J. Sci. Cosmet. Chem. Japan, 35(4), 333 (2001).12. P. Clarys, Handbook of cosmetic science and technol- ogy, eds. A. O. Barel, M. Paye, and H. I. Maibach, 1, Informa Healthcare USA, Inc., New York (2009).
13. A. Matsubara, Z. Liang, Y. Sato, and K. Uchikawa, Analysis of human perception of facial skin radiance
by means of image histogram parameters of surface and subsurface reflections from the skin, Skin Res.
Technol., 18(3), 265 (2012).
14. A. Ezerskaia, S. F. Pereira, H. P. Urbach, R.
Verhagen, and B. Varghese, Quantitative and simulta- neous non-invasive measurement of skin hydration and sebum levels, Biomed Opt. Express, 7(6), 2311 (2016).
15. N. Kashibuchi, S. Kimura, and M. Suzuki, Visible light and cosmetics. I The effects of cream and lotion on the transparency of stratum corneum, Int. J.
Japanese Cosmet. Sci., 9, 14 (1985).