Assessment of the Relationship between Air Temperature and TOA Brightness Temperature in
Different Seasons Using Landsat-8 TIRS*
Yun-Jae CHOUNG1·Youn-In CHUNG2·Soo-Young CHOI3※
Landsat-8 위성의 열적외 센서를 활용한 대기온도와 밝기온도의 계절별 상관관계 분석*
정윤재1·정연인2·최수영3※
*)
ABSTRACT
In general, Top Of Atmosphere(TOA) brightness temperature is closely related to air temperature. Brightness temperature can be derived from the Thermal Infra-Red Sensors (TIRS) of the earth observation satellites such as the Landsat series. The TIRS instrument of the Landsat-8 satellite collects the two spectral bands (Bands 10 and 11) that measure brightness temperature. In this research, the relationship between the air temperature data measured by the weather stations in Seoul, South Korea and the brightness temperature data separately derived from Bands 10 and 11 of the Landsat-8 satellite were assessed in the different seasons through the correlation analysis. The statistical results led to the following conclusions. First, brightness temperature is closely related to air temperature in order of Spring, Autumn, Winter and Summer. Second, when air temperature increases, brightness temperature also increases in Spring, Autumn and Winter but decreases in Summer. Third, Band 10 has a closer relationship to air temperature than Band 11.
KEYWORDS : Air Temperature, TOA Brightness Temperature, Thermal Infra-Red Sensors, Landsat-8 Satellite, Correlation Analysis
2018년 3월 8일 접수 Received on March 8, 2018 / 2018년 6월 8일 수정 Revised on June 8, 2018 / 2018년 6월 18일 심사완료 Accepted on June 18, 2018
* This research was supported by a grant(18SCIP-B065985-06) from Smart Civil Infrastructure Program funded by Ministry of Land, Infrastructure and Transport (MOLIT) of Korean government.
1 ㈜ 지오씨엔아이 공간정보기술연구소 Research Institute of Spatial Information Technology, GEO C&I Co., Ltd.
2 계명대학교 공과대학 토목공학과 Dept. of Civil Engineering, Keimyung University
3 ㈜ 유앤지아이티 공간정보기술연구소 Institute of Spatial Information Technology Research, U&GIT Co., Ltd.
※ Corresponding Author E-mail: [email protected]
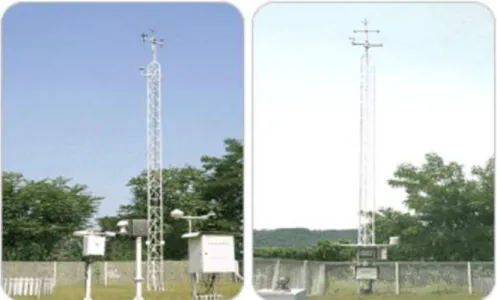
FIGURE 1. Images showing the AWS centers (KMA, 2018a)
요 약
일반적으로 밝기온도는 대기온도와 밀접한 연관이 있으며, 밝기온도는 Landsat과 같은 지구관 측위성의 열적외 센서를 활용하여 측정이 가능하다. Landsat-8 위성의 열적외 센서는 지표온도를 측정할 수 있는 두 개의 밴드 (Band 10과 Band 11)를 가지고 있다. 본 연구에서는 대한민국 서 울지역의 기상관측센터에서 측정한 대기온도와 Band 10과 Band 11로부터 각각 측정한 밝기온도 의 상관관계를 시기별(봄, 여름, 가을, 겨울)로 분석하였으며, 본 연구를 통해 다음과 같은 결과를 확인할 수 있었다. 첫째, 밝기온도와 대기온도의 상관관계는 봄, 가을, 겨울 및 여름 순으로 높았 다. 둘째, 봄, 가을 및 겨울에서는 대기온도가 증가할수록 밝기온도도 증가하였으나, 여름에서는 대기온도가 증가할수록 밝기온도는 감소하였다. 셋째, Band 10을 활용하여 측정한 밝기온도가 Band 11을 활용하여 측정한 밝기온도에 비해 대기온도와 상관관계가 높았다.
주요어 : 대기온도, 밝기온도, 열적외 센서, Landsat-8 위성, 상관관계분석
INTRODUCTION
Air temperature is defined as“the temperature of the surrounding air as measured by a dry-bulb thermometer,”
(The Free Dictionary by Farlex, 2018).
Measuring air temperature is significant because it is the important descriptor of terrestrial environmental conditions across the earth(Prihodko and Goward, 1997). In
the various countries, air temperature is observed at real times as their weather forecasting program(Australian Government, 2018). In South Korea, the air temperature data is collected by the Automatic Weather Station(AWS) centers(Korean Meteorological Administration(KMA), 2018a). Figure 1 shows the image showing the AWS centers that collect the air temperature data.
The earth observation satellites such as the Landsat series have a Thermal Infra-
FIGURE 2. Locations of the 28 AWS centers that collect the air temperature data in Seoul, South Korea
Red Sensor(TIRS) that can measure Top Of Atmosphere(TOA) brightness temperature of the earth’s surface (United States Geological Survey(USGS), 2018a). TOA brightness temperature is defined as“A measurement of radiance of the microwave radiation traveling upward from the top of the atmosphere to the satellite, expressed in units of the temperature of an equivalent black body”(Remote Sensing Systems, 2018). The Landsat-8 has the two TIRS bands(Bands 10 and 11) that can separately measure brightness temperature (USGS, 2018b).
Research on utilization of satellite remote sensed brightness temperature has been carried out. Rao et al.(1987) Shi et al.(2009) utilized brightness temperature on estimating the regional soil moisture.
Köhn and Royer(2012) also proved that brightness temperature can be the indicator of air temperature. However,
previous research has been limited to assess the detailed relationship between air temperature and brightness temperature in the different seasons(Spring, Summer, Autumn and Winter). In addition, research on assessing the relationship between air temperature and the different Landsat-8 TIRS bands(Bands 10 and 11) also has been limited.
Hence, this research assessed the two relationship: The first relationship between air temperature and brightness temperature in the different seasons(Spring, Summer, Autumn and Winter), and the second relationship between air temperature and the different Landsat-8 TIRS bands (Bands 10 and 11) through the correlation analysis.
Study Area and Data
In this research, the air temperature
(a) (b)
FIGURE 3. One scene each of Band 10 and Band 11 of the Landsat-8 TIRS data (the acquired date: May 1, 2015): (a) one scene of Band 10; (b) one scene of Band 11
data collected by the 28 AWS centers of Seoul were used because Seoul has the most number of the AWS centers in South Korea (KMA, 2018b). FIGURE 2 shows the locations of the 28 AWS centers that collect the air temperature data in Seoul, South Korea.
Bands 10 and 11 of the Landsat-8 TIRS acquired in the study area between 2014 and 2016 were also utilized to generate the brightness temperature images.
FIGURE 3 shows one scene each of Band 10 and Band 11 of the Landsat-8 TIRS data (the acquired date: May 1, 2015).
Methodology
This section illustrates the procedure for assessing the relationship between air
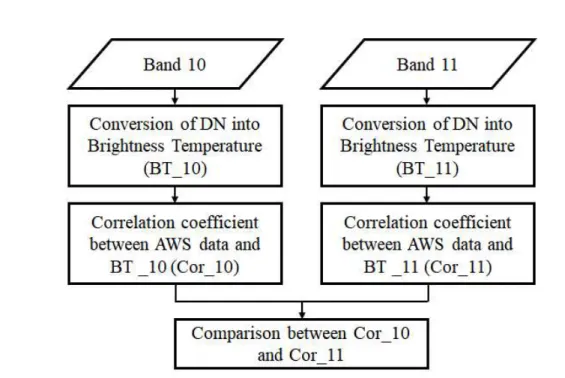
temperature and brightness temperature using the air temperature data collected by the AWS centers and the brightness temperature data derived from Bands 10 and 11 of the Landsat-8 TIRS data (see FIGURE 4).
In the first step of the proposed methodology, the Digital Number(DN) of both Bands 10 and 11 was separately converted into the Brightness Temperature (BT) image (called as“BT_10”derived from Band 10 and“BT_11”derived from Band 11, respectively). The next step is to collect the air temperature and brightness temperature data from the AWS and BT datasets. Then correlation analysis between the air temperature and brightness temperature was carried out.
Finally, the statistical results in the
FIGURE 4. Flowchart showing the procedure for assessing the relationship between the air temperature data collected by the AWS centers and the brightness temperature datasets separately derived
from Bands 10 and 11 of the Landsat-8 TIRS different seasons (Spring, Summer, Autumn
and Winter) and bands (Bands 10 and 11) derived from the correlation analysis were compared.
1. Conversion of DN into BT image
This section illustrates the multiple steps for converting the DN of Bands 10 and 11 to the different BT images (BT_10 and BT_11). In the first step, the DN of the original Bands 10 and 11 were converted to the Top Of Atmosphere (TOA) spectral radiance through the radiance rescaling method shown in the equation below (USGS, 2018a; ESRI, 2018).
(1)
where L is the TOA spectral radiance,
ML is the band-specific multiplicative rescaling factor from the metadata file, Qcal is the pixel values of Bands 10 and 11, and AL is the band-specific additive rescaling factor from the metadata file.
The second step was to convert the TOA spectral radiance values to the TOA brightness temperature in degree Kelvin using the equation below(USGS, 2018a;
ESRI, 2018).
ln
(2)
where T is the TOA brightness temperature in degrees Kelvin, L is the TOA spectral radiance, K1 is the band-specific thermal conversion constant from the metadata file and K2 is the band-specific thermal conversion constant
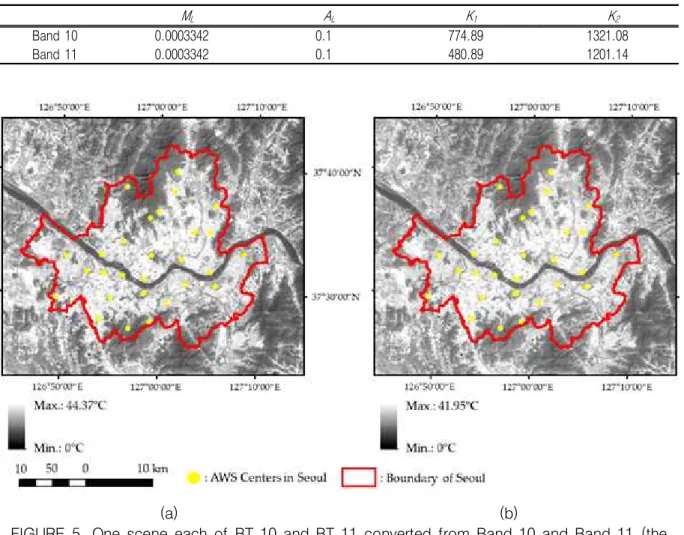
ML AL K1 K2
Band 10 0.0003342 0.1 774.89 1321.08
Band 11 0.0003342 0.1 480.89 1201.14
TABLE 1. All the inputs needed to calculate the BTs using the different bands of the Landsat-8 TIRS data (USGS, 2018a; ESRI, 2018).
(a) (b)
FIGURE 5. One scene each of BT_10 and BT_11 converted from Band 10 and Band 11 (the acquired date: May 1, 2015), respectively: (a) one scene of BT_10 converted from Band 10; (b)
one scene of BT_11 converted from Band 11.
from the metadata file.
The final step was to convert the brightness temperature in degrees Kelvin to the brightness temperature in degrees Celsius using the equation below(USGS, 2018a; ESRI, 2018).
C = T-273.15 (4)
where C is the brightness temperature in degrees Celsius and T is the brightness temperature in degrees Kelvin. Table 1
shows all the inputs needed in equations (1), (2) and (3) that are included in the metadata file of the Landsat-8 TIRS data (USGS, 2018a; ESRI, 2018).
After the completion of the final step, BT_10 and BT_11 were finally converted from Band 10 and Band 11, respectively.
FIGURE 5 shows one scene each of BT_10 and BT_11 converted from Band 10 and Band 11, respectively.
2. Collection of air and brightness temperature data
After the generation of the two BT images (the BT_10 and BT_11 images) per Landsat-8 TIRS, the air temperature and BT data were collected through the following steps. In the first step, the intensity values of the pixels where the AWS centers located in all the BT_10 and BT_11 images were collected. Then the air temperature data collected by the AWS centers in Seoul was collected considering the acquisition time of the Landsat-8 image (KMA, 2018b; USGS, 2018a). To avoid the atmospheric effects in the AWS data, the selection of the pixels that had been affected by the clouds in the BT images was manually avoided. The selection of the air temperature data collected at the rainfall times was also avoided. Finally, the BT_10 and BT_11 data derived from the BT_10 and BT_11 images were collected. Through this procedure, 485 sets of air temperature, BT_10 and BT_11 data were collected.
Considering the climate patterns of Seoul, the datasets obtained in March, April and May were classified as the datasets for the spring season; those obtained in June, July and August were classified as the datasets for the summer season; those obtained in September, October and November were classified as the datasets for the autumn season; and those obtained in December, January and February were classified as the datasets for the winter season. The 168, 79, 112 and 126 sets were utilized for assessing the relationship between air temperature and brightness temperature in the spring, summer, autumn
and winter seasons, respectively.
3. Correlation analysis between air
temperature and brightness temperature For the assessment of the relationship between air temperature and brightness temperature, the Pearson’s correlation coefficient was utilized using the variables of air temperature and brightness temperature through the equation below (Rumsey, 2017; Statistics How To, 2018).
CC=
(4)
where CC is the correlation coefficient between air temperature and brightness temperature, N is the number of sets of air temperature and brightness temperature data, A is the variable of the air temperature data, and L is the variable of the brightness temperature data.
The Pearson’s correlation coefficient is a widely used correlation formula for determining how strong the relationship is between the two datasets(Rumsey, 2017;
Statistics How To, 2018). If the value of the correlation coefficient is close to 1, there is a positive relationship between air temperature and brightness temperature.
Hence, when the air temperature increases, the brightness temperature likewise increases. If the value of the correlation coefficient is close to –1, there is a negative relationship between air temperature and brightness temperature. Hence, when the air temperature increases, the brightness temperature decreases. If the correlation coefficient is 0, there is no relationship between air temperature and
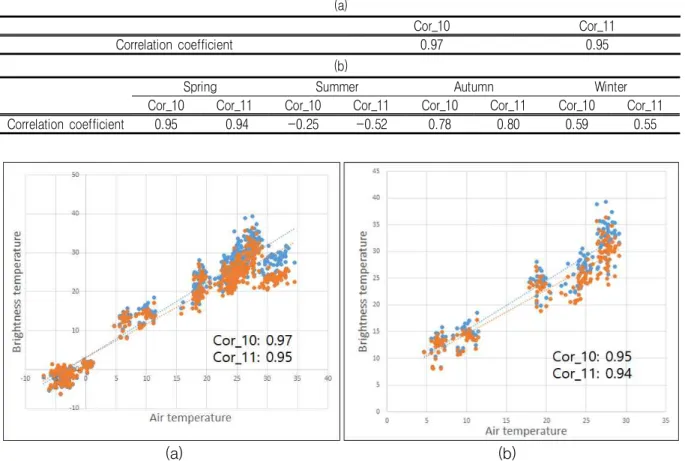
Spring Summer Autumn Winter
Cor_10 Cor_11 Cor_10 Cor_11 Cor_10 Cor_11 Cor_10 Cor_11
Correlation coefficient 0.95 0.94 -0.25 -0.52 0.78 0.80 0.59 0.55
(a)
Cor_10 Cor_11
Correlation coefficient 0.97 0.95
(b)
TABLE 2. Statistical results of Cor_10 and Cor_11 calculated in whole study period and in the spring, summer, autumn and winter seasons: (a) Cor_10 and Cor_11 calculated in the whole study period; (b) Cor_10 and Cor_11 calculated in the Spring, Summer, Autumn and Winter seasons
(a) (b)
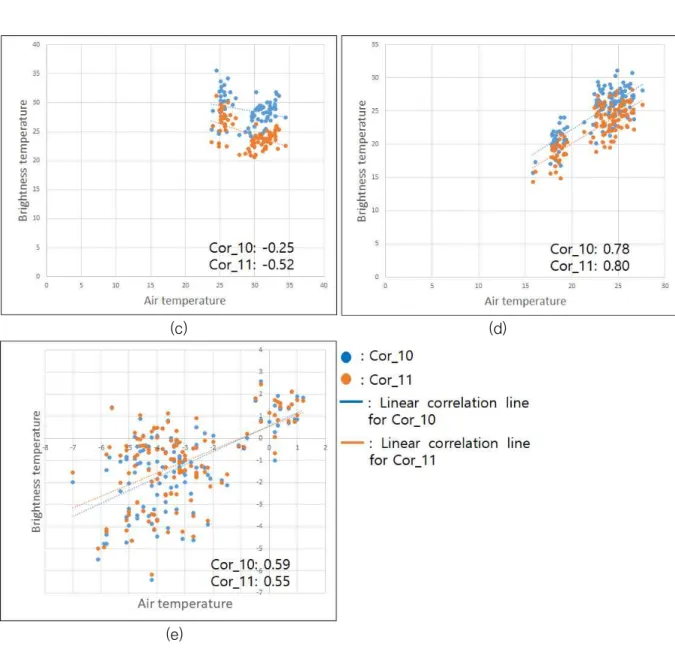
FIGURE 6. Correlation graphs of Cor_10 and Cor_11: (a) Correlation graphs of Cor_10 and Cor_11 in the whole study period; (b) Correlation graphs of Cor_10 and Cor_11 in the Spring season; (c) Correlation graphs of Cor_10 and Cor_11 in the Summer season; (d) Correlation graphs of Cor_10 and Cor_11 in the Autumn season; (e) Correlation graphs of Cor_10 and Cor_11 in the Winter
season.
brightness temperature.
Results
The relationship between air temperature and brightness temperature in the different seasons was assessed by calculating the correlation coefficient using the variables of air temperature and brightness temperature.
In this research, the correlation coefficient
calculated using the air temperature and BT_10 data was called“Cor_10”, while the correlation coefficient calculated using the air temperature and BT_11 data was called as“Cor_11”. TABLE 2 shows the statistical results of the Cor_10 and Cor_11 calculated in whole study period and in the spring, summer, autumn and winter seasons; FIGURE 6 shows the correlation graphs of Cor_10 and Cor_11
(c) (d)
(e)
FIGURE 6. Continued calculated in whole study period and in the
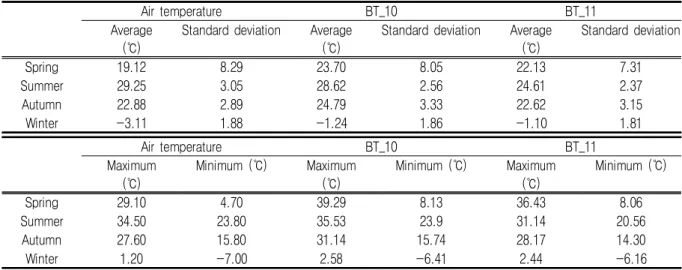
Spring, Summer, Autumn and Winter seasons; and TABLE 3 shows the statistical results of air temperature, BT_10 and BT_11 in the different seasons.
As seen in FIGURE 6 and TABLE 3, the given datasets (the air temperature data and the brightness temperature data) have the paired observations, continuous variables and no outlier that are the requirements for Pearson’s correlation
assumptions.
Discussions
As seen in TABLE 2 and FIGURE 6, brightness temperature is closely related to air temperature in the order of spring (Cor_10: 0.95; Cor_11: 0.94), autumn (Cor_10: 0.78; Cor_11: 0.80), winter (Cor_10: 0.59; Cor_11: 0.55) and summer (Cor_10: -0.25; Cor_11: -0.52). That is, when the air temperature increases, the
Air temperature BT_10 BT_11 Average
(℃)
Standard deviation Average (℃)
Standard deviation Average (℃)
Standard deviation
Spring 19.12 8.29 23.70 8.05 22.13 7.31
Summer 29.25 3.05 28.62 2.56 24.61 2.37
Autumn 22.88 2.89 24.79 3.33 22.62 3.15
Winter -3.11 1.88 -1.24 1.86 -1.10 1.81
TABLE 3. Statistical results of air temperature, BT_10 and BT_11 in the different seasons
Air temperature BT_10 BT_11
Maximum (℃)
Minimum (℃) Maximum (℃)
Minimum (℃) Maximum (℃)
Minimum (℃)
Spring 29.10 4.70 39.29 8.13 36.43 8.06
Summer 34.50 23.80 35.53 23.9 31.14 20.56
Autumn 27.60 15.80 31.14 15.74 28.17 14.30
Winter 1.20 -7.00 2.58 -6.41 2.44 -6.16
brightness temperature also increases in spring, autumn and winter but decreases in summer. As can be seen in Table 3, air temperature has a higher average in summer than in spring, autumn and winter.
In addition, in South Korea, the humidity, rainfall and vegetation activity are highest in summer(KMA, 2018b). Hence, it can be assumed that there are other parameters that affect air temperature more than brightness temperature. TABLE 3 also shows that air temperature has a lower average and smaller standard deviation in winter than in spring and autumn, and it can be assumed that this might cause the lowest positive relationship between air temperature and brightness temperature in winter. In general, it is not generally recommended to use Band 11 in science studies, because such band is affected by the straight light rays that may cause distortions in the pixel values(Montanaro et al., 2014; USGS, 2018b), hence it can be assumed that it causes Band 10 to have a closer relationship to air temperature than Band 11.
Conclusions
This research contributes to the assessment of the relationship between air temperature and brightness temperature in the different seasons using the data acquired by the AWS centers and two spectral bands(Bands 10 and 11) of the Landsat-8 TIRS in Seoul, South Korea.
The following conclusions were obtained.
First, brightness temperature is closely related to air temperature in the order of spring, autumn, winter and summer.
Second, when the air temperature increases the brightness temperature also increases in spring, autumn and winter but the decrease in summer. Third, Band 10 has a closer relationship to air temperature than Band 11. Air temperature estimation is important for predicting crop growth and productivity and for estimating evaporation rates and relative humidity, among others (Environmental monitor, 2018), and we recognized that brightness temperature can be the significant indicator for estimating air temperature through this research. The statistical results obtained in this research
showed, however, that the utilization of only the brightness temperature data in estimating air temperature is limited in various land covers and seasons. Hence, in the future research, various other parameters, such as land cover, humidity, elevation, air pressure, and wind speed, will be integrated with brightness temperature in the estimation of the air temperature in the various kinds of environments.
REFERENCES
Australian Government. 2018. Observation of air temperature. http://www.bom.gov.
au/climate/cdo/about/airtemp-measure.sht ml (Accessed March 5, 2018).
Environmental monitor. 2018. What is Air Temperature? http://www.fondriest.com/
news/airtemperature.htm (Accessed on March 5, 2018).
ESRI. 2018. Deriving temperature from Landsat 8 thermal bands (TIRS). https://
blogs.esri.com/esri/arcgis/2014/01/06/deri ving-temperature-from-landsat-8-ther mal-bands-tirs/ (Accessed March 5, 2018).
Köhn, J., and A. Royer. 2012. Microwave brightness temperature as an indicator of near-surface air temperature over snow in Canadian northern regions.
International Journal of Remote Sensing 33(4):1126 -1138.
Korean Meteorological Administration (KMA). 2018a. Automatic Weather Stations. http://web.kma.go.kr/aboutkma/biz /observation02.jsp (Accessed March 5, 2018).
KMA. 2018b. Data collected by the AWS centers. http://www.kma.go.kr/weather /observation/aws_table_popup.jsp (Accessed March 5, 2018).
Montanaro, M., A. Gerace, A. Lunsford, and D. Reuter. 2014. Stray Light Artifacts in Imagery from the Landsat 8 Thermal Infrared Sensor. Remote Sensing 6(11):10435-10456.
Prihodko, L., and S. Goward. 1997.
Estimation of air temperature from remotely sensed surface observations.
Remote Sensing of Environment 60(3):
335-346.
Rao, K.S., G. Chandra, and P.V. Rao. 1987.
The relationship between brightness temperature and soil moisture Selection of frequency range for microwave remote sensing. International Journal of Remote Sensing 8(10):1531-1545.
Remote Sensing Systems. 2018. Brightness Temperature. http://www.remss.com/
measurements/brightness-temperature/
(Accessed March 5, 2018).
Rumsey, D. 2017. Statistics For Dummies, 2nd Edition. Wiley, Inc., USA, 408pp.
Shi, X.K., J. Wen, L. Wang, T.T. Zhang, H.
Tian, X, Wang, R. Liu, and J.H. Zhang.
2009. Application of satellite microwave remote sensed brightness temperature in the regional soil moisture simulation.
Hydrology and Earth System Sciences Discussions 6:1233-1260.
Statistics How To. 2018. Correlation Coefficient Formula: What is it? http://
www.statisticshowto.com/what-is-the- correlation-coefficient-formula/ (Accessed March 5, 2018).
The Free Dictionary by Farlex. 2018.
Temperature. https://medical-dictionary.
thefreedictionary.com/Air+temperature (Accessed March 5, 2018).
United States Geological Survey (USGS).
2018a. Landsat Missions. https://landsat.
usgs.gov/using-usgs-landsat-8-product (Accessed March 5, 2018).
USGS. 2018b. How are the Thermal Infrared Sensor (TIRS) thermal bands aboard Landsat 8 used? https://landsat.
usgs.gov/how-are-thermal-infrared-sen sor-tirs-thermal-bands-aboard-landsat -8-used (Accessed March 5, 2018).