• 검색 결과가 없습니다.

Effect of Analytical Parameters of Gel Permeation Chromatography on Molecular Weight Measurements of Urea-Formaldehyde Resins

N/A
N/A
Protected

Academic year: 2021

Share "Effect of Analytical Parameters of Gel Permeation Chromatography on Molecular Weight Measurements of Urea-Formaldehyde Resins"

Copied!
11
0
0

로드 중.... (전체 텍스트 보기)

전체 글

(1)

1. INTRODUCTION

Urea-formaldehyde (UF) resin is one of the most widely used adhesive in the manufacture of wood-based composite panels because it has several desirable characteristics such as low cost, fast curing, colorlessness, water solubility and high performance (Myers et al., 1990; Dunky, 1998; Park et al., 2006; Abdullah and Park.,

2010). In general, the performance of UF resin heavily depends on molecular weight (MW) or molecular weight distribution (MWD) (Jeong and Park, 2016). Also, MW of the UF resin af- fects the adhesion (Jeremejeff, 2012). In order to have a good adhesion, low MW fraction of the resin should penetrate into wood cell walls, while high MW fraction should be remained in the bond-line between wood and adhesive (Arif

Original Article

Effect of Analytical Parameters of Gel Permeation Chromatography on Molecular Weight Measurements of Urea-Formaldehyde Resins 1

Bora Jeong

2

⋅Byung-Dae Park

2,3,†

ABSTRACT

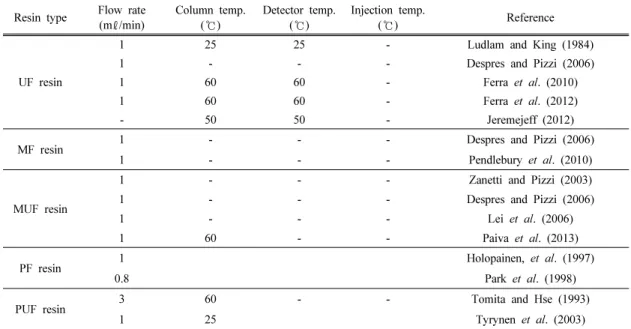
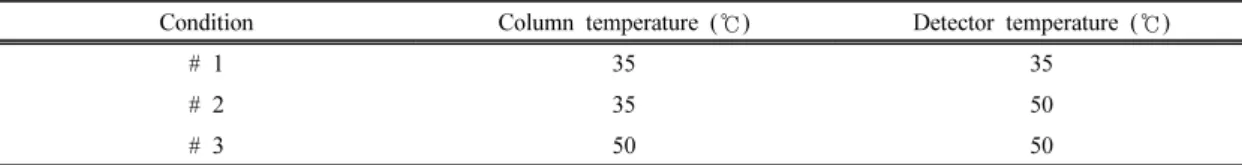
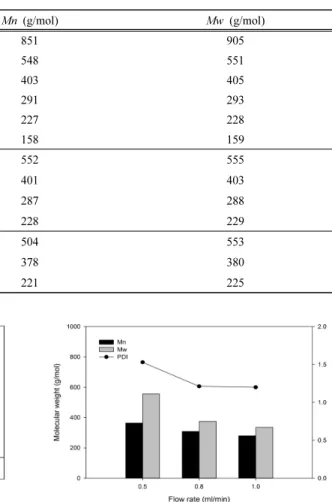
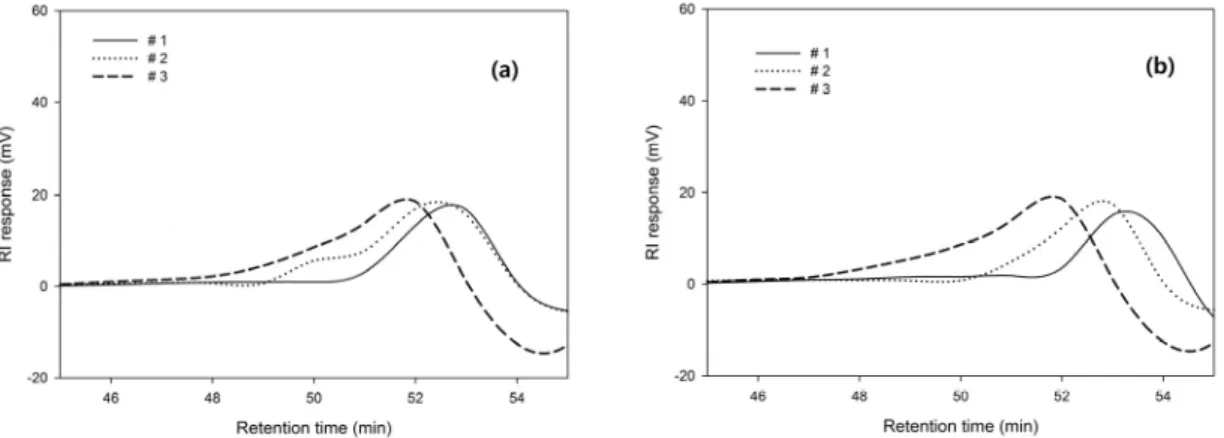
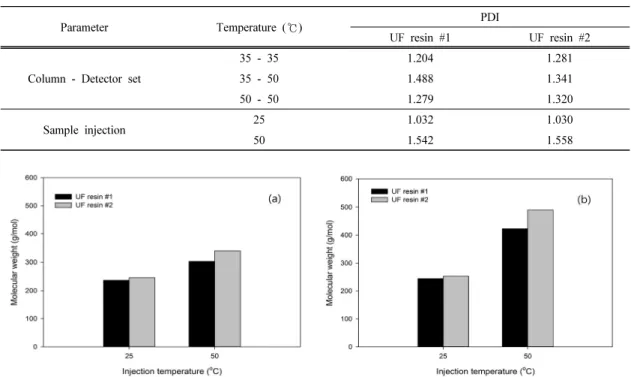
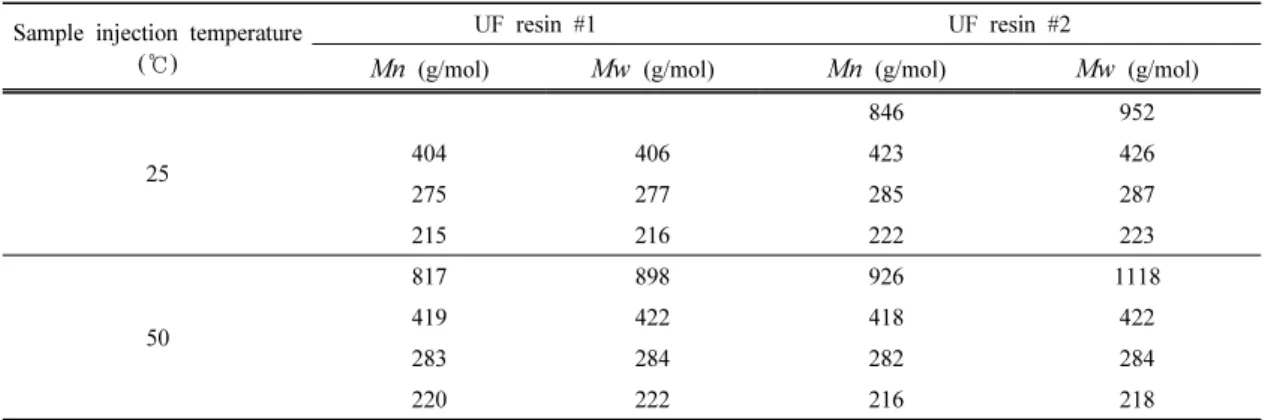
As the molecular weight (MW) of urea-formaldehyde (UF) resins had a great impact on their properties, this work was conducted to study effect of analytical parameters of gel permeation chromatography (GPC) on the MW measurement of UF resins. GPC parameters such as flow rate, column, detector temperature, and sample injection temperature were selected to compare number-average molecular weight ( Mn), weight-average molecular weight ( Mw), molecular weight distribution (MWD) and polydispersity index (PDI) of two UF resins with different viscosities. As expected, UF resin with higher viscosity resulted in greater Mn and Mw than those of low viscosity UF resin. When the flow rate increased, both Mn and Mw of UF resins decreased and MWD became narrower. By contrast, both Mn and Mw increased and MWD became wide when the column, detector, and sample injection temperature increased. The column, detector, and sample injection temperature of 50 ℃ at a flow rate of 0.5 m ℓ/min resulted in the highest MW and broadest MWD for the GPC analysis. These results suggest that the apparent molecular size or a hydrodynamic radius of UF resin molecules dissolved in the mobile phase affect to Mn, Mw and MWD.

Keywords : urea-formaldehyde resin, molecular weight, molecular weight distribution, gel permeation chromatog- raphy

1

Date Received July 4, 2017, Date Accepted July 17, 2017

2

Department of Wood and Paper Sciences, Kyungpook National University, Daegu 41566, Republic of Korea

3

Institute of Agricultural Science and Technology, Kyungpook National University, Daegu 41566, Republic of Korea

Corresponding author: Byung-Dae Park (e-mail: [email protected])

(2)

et al., 2014).

Many research results have reported on the measurement of the MW of formaldehyde-based resins, using gel permeation chromatography (GPC) (Ludlam and King., 1984; Tomita and Hse., 1993; Park et al., 1998; Zanetti and Pizzi., 2003; Despres and Pizzi., 2006; Laborie et al., 2006; Lei et al., 2006; Ferra et al., 2010; Pendlebury et al., 2010; Jeremejeff, 2012;

Ferra et al., 2012; Paiva et al., 2013) and were summarized in Table 1. For example, Ludlam and King (1984) measured MWs of UF resins to understand its aging characteristics over time, using size exclusion chromatography (SEC) at a flow rate of 1 m ℓ/min. and columns and detector temperature of 25 ℃. Despres and Pizzi (2006) also determined MWs of UF resin, melamine-urea-formaldehyde (MUF) resin, and melamine-formaldehyde (MF) resin to study the

presence of super-aggregates by GPC, and confirmed the formation of colloidal su- per-aggregates. Using GPC/SEC analysis, Ferra et al. (2010) also studied the colloidal phase in UF resins at a flow rate of 1 m ℓ/min. and a column temperature of 60 ℃. And they found that it acted as reactive filler of improving bonding performance at the wood joint inter- faces, indicating that the sediment and super- natant obtained by the centrifugation was related to strengthening of the adhesive bond.

Ferra et al. (2012) also employed GPC/SEC method to compare two synthesis methods of UF resins: alkaline-acid and strong acid processes. Jeremejeff (2012) studied changes in the MW of UF resins to understand the effect of formaldehyde/urea molar ratio during the synthesis. Pendlebury et al. (2010) also ana- lyzed MF resins by GPC to understand their

Resin type Flow rate (m ℓ/min)

Column temp.

( ℃)

Detector temp.

( ℃)

Injection temp.

( ℃) Reference

UF resin

1 25 25 - Ludlam and King (1984)

1 - - - Despres and Pizzi (2006)

1 60 60 - Ferra et al. (2010)

1 60 60 - Ferra et al. (2012)

- 50 50 - Jeremejeff (2012)

MF resin 1 - - - Despres and Pizzi (2006)

1 - - - Pendlebury et al. (2010)

MUF resin

1 - - - Zanetti and Pizzi (2003)

1 - - - Despres and Pizzi (2006)

1 - - - Lei et al. (2006)

1 60 - - Paiva et al. (2013)

PF resin 1 Holopainen, et al. (1997)

0.8 Park et al. (1998)

PUF resin 3 60 - - Tomita and Hse (1993)

1 25 Tyrynen et al. (2003)

Table 1. Literature summary on parameters of GPC for the MW measurement of formaldehyde-based resins

(3)

performance, and found that the GPC result was compatible with the density pro file of pan- els bonded with the resin.

Zanetti and Pizzi (2003) measured MWs of MUF resins, and found that the whitening of these resins was related to the apparent average degree of polymerization of the resin with ageing. Two rather different MUF resin for- mulations yielded different variations in molec- ular mass fractions during the progress of the reaction and during the so-called ambient temperature “maturing” of the resin was inves- tigated by Lei et al. (2006). Paiva et al. (2013) also performed GPC/SEC analysis for MUF resins, and reported that high molecular weight of MUF resins was due to a higher degree of the condensation.

In addition to amino resins, various GPC work has been done for PF resins. For example, Holopainen et al. (1997) studied that the effects of the condensation F/P molar ratio on the structure and properties of the resins. Park et al. (1998) reported that a mixture ratio of 40%

low molecular weight (LMW) and 60% high molecular weight (HMW) resulted in the high- est adhesion for medium density fiberboard (MDF). Lavorie et al. (2006) showed that a LMW PF resin interacted with wood cell wall polymers on the nanometer scale, as demon- strated by enhanced intermolecular coupling near the main glass transition of wood lignin.

Tomita and Hse (1993) also investigated the ef- fects of acidity on the reaction of urea and a methylolphenol using GPC analysis. Turunen et al. (2003) studied that modifications with corn

starch, a lignin reagent, or urea were proven to increase MW values with respect to the values of the reference resol.

Although many literatures reported on the MW measurements of UF resins using GPC or SEC, the level of GPC parameters were differ- ent and inconsistent, depending on the authors and equipment. Thus, this study investigated the effect of GPC parameters on the MW measure- ments of UF resins by adjusting flow rate, de- tector, column, and sample injection temperature.

2. MATERIALS and METHODS 2.1. Materials

Materials used for the synthesis of UF resin adhesives in this work were technical grade of urea granules (99%) and formalin (37%).

Aqueous solutions of formic acid (20 wt%) and sodium hydroxide (20 wt%) were used to adjust the pH during the resin synthesis process.

Aqueous solution (20 wt%) of NH

4

Cl were used as a hardener. High purity ( ≥ 99.9%) high performance liquid chromatography (HPLC) grade of both N,N-dimethyl formamide (DMF) and dimethylsulfoxide (DMSO) were purchased from Sigma-Aldrich without further treatment.

2.2. Methods

2.2.1. Synthesis UF Resins of Different Viscosities

Formalin (37%) was placed in the reactor

equipped by a mantle heater. The first addition

(4)

of urea was added into the reactor under stir- ring, and heated to 40 ℃. We adjusted the pH of 7.8-8.0 for addition reaction using sodium hydroxide. The reaction was heated at 90 ℃ for 60 min. The temperature was then brought down to 80 ℃. When the temperature reached 83 ℃, the pH had to be adjusted to 4.6 for the condensation reaction. The temperature was kept at 80 ℃ to determine the viscosity. The target viscosity was between ‘J’ and ‘K’ scale as measured by a bubble viscometer (VG-9100, Gardner-Holdt Viscometer, FL, USA). When the desired condition was reached, the second addition of urea was added to the reactor to ad- just a F/U mole ratio of 1.0. After all the urea was dissolved, the UF resin was cooled to room temperature, and then the pH was ad- justed to 8.0 to terminate the condensation reaction. And another UF resin was synthesized under the same procedure but with the target viscosity between ‘S’ and ‘T’ scale using the same bubble viscometer.

2.2.2. Properties of UF Resins Prepared The viscosity of all resins was measured with

a cone-plate viscometer (DV − II+, Brookfield, Middleboro, MA, USA), using a spindle #2 at 25 ℃ and 60 rpm. The non-volatile solids con- tent of all UF resins were calculated by weigh- ing resin samples before and after drying in the oven for 3 hours at 105 ℃. The gelation time of all resins were measured at 100 ℃ with 3 wt%

of NH

4

Cl (20 wt%) as hardener, using a gel time meter (DAVIS, Sunshine Instruments, US/22A-240). Properties of UF resins are sum- marized in Table 2.

2.2.3. MW Measurements of UF Resins Using GPC

A GPC (YL9100, Younglin, Korea) system equipped with a refractive index (RI) detector was used in this study. The columns used were the KD801, 802, and 806 M products from SHODEX. As shown Table 3, different sets of the column and detector temperature from 35 ℃ to 50 ℃ were used. And three flow rates of the mobile phase such as 0.5, 0.8 and 1 m ℓ/min.

were employed for the GPC analysis. A HPLC grade DMF was used as the mobile phase.

Liquid UF resin samples were dissolved in the

Sample pH Viscosity (mPa ⋅s) Non-volatile solids content (wt%) Gel time (s)

UF resin #1 8.3 260 62 ± 0.2 240 ± 2

UF resin #2 8.1 760 62 ± 0.1 208 ± 1

Table 2. Properties of UF resins with different viscosities

Condition Column temperature ( ℃) Detector temperature ( ℃)

# 1 35 35

# 2 35 50

# 3 50 50

Table 3. Different sets of column and detector temperature for the GPC analysis

(5)

mixture of 10% DMSO and 90% DMF and kept them in the oven at 50 ℃ for 3 hours be- fore the injection. The sample solution was in- troduced to the injection loop of the GPC after the filtration through a 0.45 m ℓ filter.

3. RESULTS and DISCUSSIONS

Fig. 1 shows the GPC chromatograms of UF resin #1 at different flow rates. The results dis-

play that high flow rate reduced retention time.

However, when the flow rate was fast, the de- tection of the MW was insufficient. There are the Mn, Mw and MWD according to different flow rates of the same UF resin #1 in Fig. 2.

As a result, Mn, Mw and PDI decreased as the flow rate increased, because there was in- sufficient time for the MW analysis. The slower the flow rate was, the longer the retention time in the column was. Thus, the higher MW could Fig. 1. GPC chromatograms of UF resin #1 as a

function of the flow rate.

Fig. 2. Mn, Mw and PDI of UF resin #1 as a func- tion of the flow rate of GPC.

Flow rate (m ℓ/min) Mn (g/mol) Mw (g/mol)

0.5

851 905

548 551

403 405

291 293

227 228

158 159

0.8

552 555

401 403

287 288

228 229

1.0

504 553

378 380

221 225

Table 4. MWD of UF resin #1 as a function of the flow rate

(6)

be analyzed. Another fact the MWD had showed narrower MWD as the flow rate be- came faster as presented in Table 4.

If the equilibrium assumption of GPC was valid, then the elution volume should be in- dependent of flow rate (Iler and Mcqueston, 1974). But, many studies had shown that the elution volume increased or decreased with the flow rate, depending on the experimental con- ditions (Unger and Janzen, 1986; Majors, 1980). Despite the inconsistency between flow rate and elution volume in the literatures, it was generally accepted that as the flow rate re-

duced, the retention time and elution volume increased, resulting in high MW and wider MWD. By contrast, the elution volume is dis- torted and decreased, as the flow rate increased.

At higher flow rate, the diffusion rate into mi- cro pores is insufficient, and then the elution curve becomes skewed (Uglea, 1996).

Therefore, the elution curve became more skewed and the peak area of the molecular weight curve of the sample decreased as the flow rate increased.

GPC chromatograms of UF resins at different sets of column and detector temperatures with Fig. 4. Mn (a) and Mw (b) of UF resins at different temperatures of column and detector.

Fig. 3. GPC chromatograms of UF resin # 1 (a) and # 2 (b) at different sets of column and detector temperature.

(7)

low and high viscosities are shown in Fig. 3.

Regardless of the resin viscosity, higher temper- ature of the column and detector resulted in higher MW for UF resins, indicating that col- umn and detector temperature directly influ- enced the resolution of GPC. It depends on the expansion of the polymer and it’s diffusion in the column. When the temperature increased, the viscosity of the solvent decreased and the mobility of the sample in solution increased. As

the mobility of the molecule increases, the mass transfer in the column becomes easier. As ex- pected, both Mn and Mw increased with an in- crease in the column and detector temperature as shown in Fig. 4. Both Mn and Mw of the condition #2 were higher than those of the con- dition #1, and the condition #3 had the highest Mn and Mw values.

As shown in Table 5, the MWD of UF resins became wider as the temperature of column and detector increased. The range of MWD of the condition #2 was wider than that of the con- dition #1, and the condition #3 was broader than the condition #2. This was because the diffusion coefficient of the mobile solution increased as the temperature of column and de- tector increased. And seeing as the diffusion co- efficient increased, mobility solution improved.

Because the mobility solution increased, the mass transfer became easier.

The result shows that temperature changes in

Condition UF resin #1 UF resin #2

Mn (g/mol) Mw (g/mol) Mn (g/mol) Mw (g/mol)

# 1

687 741

471 481 306 309

277 278 291 293

216 217 226 227

# 2

742 901

498 503 313 316

274 276 257 258

214 215 160 161

# 3

845 914 876 1012

502 505 485 499

368 369 221 235

288 290 135 139

Table 5. MWD of UF resins at different sets of column and detector temperature

Fig. 5. GPC chromatograms of UF resins with differ-

ent sample injection temperatures.

(8)

the column and detector are one of the im- portant parameters in GPC analysis. As the dif- fusion coefficient of the polymer in solution in- creased, the mobility increased, and then the re- sulting sample peaks appear sharper and narrower. However, the PDI values shown in Table 6 were inconsistent. For the condition #2 which the column-detector temperature was 35-50 ℃, the PDI value increased as the differ- ence in both Mn and Mw values became widened. The both Mn and Mw values widened that because the diffusion coefficient of the molecules increases as the detector temperature increases. On the other hand, conditions #1 and

#3 with the same column and detector temper-

atures did not show a significant difference in PDI values. In Consequence, as column and de- tector temperatures increases, the diffusion of the molecules becomes easier and wider range of the MW can be measured.

Both UF resins #1 and #2 with different vis- cosities were used for the sample injection tem- peratures of 25 ℃ and 50℃. Fig. 5 displays GPC chromatograms of two UF resins at differ- ent sample injection temperatures. As expected, high MW was detected at greater viscosity resin like UF resin #2 with greater viscosity re- sulted in high MW. And higher sample in- jection temperature also resulted in high MW.

By contrast, low MW was detected for UF res- Fig. 6. Mn (a) and Mw (b) of UF resin #1 and #2 with different sample injection temperatures.

Parameter Temperature ( ℃) PDI

UF resin #1 UF resin #2

Column - Detector set

35 - 35 1.204 1.281

35 - 50 1.488 1.341

50 - 50 1.279 1.320

Sample injection 25 1.032 1.030

50 1.542 1.558

Table 6. PDI values of the UF resins with different sets of column - detector temperature and sample injection

temperature

(9)

in #1 with low viscosity resin at low sample injection temperature. Similarly, Fig. 6 shows that the high viscosity resin had high Mn and Mw, and the high sample injection temperature resulted in the high Mn and Mw.

In other words the higher viscosity of a resin is, the larger MW is. Park et al. (1998) re- ported blending LMW and HMW resins in dif- ferent proportions to investigate the influence of Mw of PF resin. They concluded that as the proportion of HMW increased, Mw and hence the viscosity of adhesives increased. As showed in Table 6, the PDI increased because the dif- ference between Mn and Mw was high at high sample injection temperature. The sample in- jection temperature also affected the MWD of UF resins as presented in Table 7. An increase in the sample injection temperature increased the solubility of UF resins and confirmed a wider MWD using GPC analysis.

When the sample injection temperature in- creased, the sample has an increased dispersion in the elution solvent and diffusion coefficient is increased. If the diffusion coefficient of a

polymer increases in solution, the resulting sample peaks appear sharper and less broad.

4. CONCLUSION

In the words, UF resins of different vis- cosities were prepared to optimize the parame- ters of GPC analysis. GPC analysis parameters were very important in obtaining a proper MW and MWD for UF resins. The GPC analysis of UF resin showed that a faster flow rate resulted in smaller MW and narrower MWD. And the diffusion of resins and mobility increased, af- fecting the MW and MWD measurement, as the column and detector temperature increased. We also found that the sample injection temperature affected the MW and MWD of the sample be- cause it influenced the dissolution of sample.

As a result of this study, the greatest MW and wider MWD were observed at a flow rate of 0.5 m ℓ/min with the column, detector and sam- ple injection temperature of 50 ℃. The flow rate affects the diffusion rate of analyte molecule, and column, detector, and sample injection tem-

Sample injection temperature ( ℃)

UF resin #1 UF resin #2

Mn (g/mol) Mw (g/mol) Mn (g/mol) Mw (g/mol)

25

846 952

404 406 423 426

275 277 285 287

215 216 222 223

50

817 898 926 1118

419 422 418 422

283 284 282 284

220 222 216 218

Table 7. MWD of UF resins at different sample injection temperatures

(10)

peratures affect molecular mobility and their diffusion.

ACKNOWLEDGEMENTS

This work was supported by the Basic Science Research Program through the National Research Foundation (NRF) of Korea funded by the Ministry of Education, Science and Technology (Grant #:

2016R1D1A1A09917782).

REFERENCES

Abdullah, Z.A., Park, B.D. 2010. Influence of acryl- amide copolymerization of urea-formaldehyde resin adhesives to their chemical structure and performance. Journal of Applied Polymer Science 117(6): 3181 ∼3186.

Arif, N., Park, B.D., Adya, P.S. 2014. Penetration of urea-formaldehyde resins with different form- aldehyde/urea mole ratios into softwood tissues, Wood Science and Technology 48: 889 ∼902.

Despres, A., Pizzi, A. 2006. Colloidal aggregation of aminoplastic polycondensation resins: urea-form- aldehyde versus melamine-formaldehyde and melamine-urea-formaldehyde Resins, Journal of Applied Polymer Science 100: 1406 ∼1412.

Dunky, M. 1998. Urea-formaldehyde (UF) adhesive resins for wood. International Journal of Adhesion and Adhesives 18(2): 95 ∼107.

Ferra, J., Mendes, A., Costa, M.R., Carvalho, L., Magalhães, F.M. 2010. Characterization of urea-formaldehyde resins by GPC/SEC and HPLC techniques: effect of ageing. Journal of Adhesion Science and Technology 24: 1535 ∼ 1551.

Ferra, J., Henriques, A., Mendes, A., Costa, M.R., Carvalho, L., Magalhães, F.D. 2012. Comparison

of UF synthesis by alkaline-acid and strongly acid processes. Journal of Applied Polymer Science 123(3): 1764 ∼1772.

Iler, R., Mcqueston, H.J. 1974. U.S. Patent No.

3,855,172. Washington, DC: U.S. Patent and Trademark Office.

Jeong, B., Park, B.D. 2016. Measurement of molec- ular weights of melamine-urea-formaldehyde res- ins and their influences to properties of medium density fiberboards. Journal of the Korean Wood Science and Technology 44(6): 913 ∼922.

Jeremejeff, J. 2012. Investigation of UF-resins-the Effect of the Formaldehyde/Urea Molar Ratio during Synthesis. Stockholm. Sweden.

Laborie, M.P.G., Salmén, L., Frazier, C.E. 2006. A morphological study of the wood/phenol-form- aldehyde adhesive interphase. Journal of adhe- sion science and technology 20(8): 729 ∼741.

Lei, H., Pizzi, A., Du, G., Despres, A. 2006.

Variation of MUF and PMUF resins mass frac- tions during preparation. Journal of Applied Polymer Science 100(6): 4842 ∼4855.

Ludlam, P.R., King, J.G. 1984. Size exclusion chro- matography of urea formaldehyde resins in di- methylformamide containing lithium chloride.

Journal of Applied Polymer Science 29(12):

3863 ∼3872.

Majors, R.E. 1980. Recent advances in HPLC pack- ings and columns. Journal of Chromatographic Science 18(10): 488 ∼511.

Paiva, N.T., Pereira, J., Ferra, J.M., Cruz, P., Carvalho, L., Magalha, F.D. 2013. Study of in- fluence of synthesis conditions on properties of melamine-urea formaldehyde resins. International Wood Products Journal 3: 51 ∼57.

Park, B.D., Riedl, B., Hsu, E.W., Shields, J. 1998.

Effects of weight average molecular mass of

phenol-formaldehyde adhesives on medium den-

sity fiberboard performance. Holz als Roh-und

(11)

Werkstoff 56(3): 155 ∼161.

Park, B.D., Kang, E.C., Park, J.Y. 2006. Effects of formaldehyde to urea mole ratio on thermal cur- ing behavior of urea-formaldehyde resin and properties of particleboard. Journal of Applied Polymer Science 101(3): 1787 ∼1792.

Pendlebury, E., Lei, H., Antoine, M.L., Pizzi, A.

2010. Melamine-Formaldehyde Resins without Urea for Wood Panels. Journal of Adhesion Science and Technology 24(8-10): 1415 ∼1422.

Tomita, B., Hse, C.Y. 1993. Syntheses and structural analyses of cocondensed resins from urea and methylolphenols, Mokuzai Gakkaishi 39(11):

1276 ∼1284.

Turunen, M., Alvila, L., Pakkanen, T.T., Raninio, J.

2003. Modification of phenol-formaldehyde resol resins by lignin, starch, and urea. Journal of Applied Polymer Science 88(2): 582 ∼588.

Uglea, C.V. 1996. Liquid chromatography of oligom- ers (Vol. 72). Chaptet 4, 288-289. CRC Press.

New York. USA.

Unger, K.K., Janzen, R. 1986. Packings and sta- tionary phases in preparative column liquid chromatography. Journal of Chromatography A 373: 227 ∼264.

Zanetti, M., Pizzi, A. 2003. Colloidal aggregation of

MUF polycondensation resins: formulation influ-

ence and storage stability. Journal of applied

polymer science 91(4): 2690 ∼2699.

수치

Table 1. Literature summary on parameters of GPC for the MW measurement of formaldehyde-based resins
Table 3. Different sets of column and detector temperature for the GPC analysis
Fig. 2.  Mn,  Mw and PDI of UF resin #1 as a func- func-tion of the flow rate of GPC.
Fig. 3. GPC chromatograms of UF resin # 1 (a) and # 2 (b) at different sets of column and detector temperature.
+4

참조

관련 문서

Daily mean of air pressure, air temperature, dew-point temperature, wind direction and speed, relative humidity and cloud amount is the average of hourly

Daily mean of air pressure, air temperature, dew-point temperature, wind direction and speed, relative humidity and cloud amount is the average of hourly

Daily mean of air pressure, air temperature, dew-point temperature, wind direction and speed, relative humidity and cloud amount is the average of hourly

Daily mean of air pressure, air temperature, dew-point temperature, wind direction and speed, relative humidity and cloud amount is the average of hourly

Daily mean of air pressure, air temperature, dew-point temperature, wind direction and speed, relative humidity and cloud amount is the average of hourly

Comparison of the monthly average difference between surface temperature and sea surface temperature at Chilbaldo on foggy(f_avg) and no foggy(nf_avg) day cases from

Daily mean of air pressure, air temperature, dew-point temperature, wind direction and speed, relative humidity and cloud amount is the average of hourly

Daily mean of air pressure, air temperature, dew-point temperature, wind direction and speed, relative humidity and cloud amount is the average of hourly