In diabetics, abnormalities are seen in the retina, lens, lid, iris, ciliary body, and nerves.
1,2Diabetic corneal complications, such as abnormalities in the basement membrane of the corneal epithelium, barrier function impairment in the corneal epithelium, decreased corneal perception, abnormal collagen depositions in Descemet's membrane, morphological changes in corneal endothelial cells, and pump function deterioration are also common.
3-6Hemidesmosomes and anchoring fibrils passing through the stroma in the adhesion complex are reduced, resulting in weakened hemidesmosome adhesion. As a result, preservation of the corneal epithelial layer (corneal epithelialization) is impaired. Furthermore, abnormalities in the corneal epithelial basement membrane may impair normal barrier function or induce edema in the corneal stromal area.
Thus, depending on the healing of wound and inflammation there may be substantial impediments to tissues recovery.
3,4In addition, as the corneal endothelial cell pump function is
damaged by diabetes, water is transported to the anterior corneal stromal tissues; therefore, particular cautions are required to reduce corneal complications such as keratitis.
5,6Cells respond to external stimulation by transducing extracellular signals from cell membrane receptors to cytoplasmic micromolecules. All biological activities of cells (apoptosis, proliferation, migration, polarity, and so on) are determined by various signal transduction pathways.
Therefore, studies pertinent to signal control are very important.
7-10In diabetes, morphological studies and reports on corneal cells are readily available; however, genetic and molecular studies on corneal stromal cells are relatively rare.
Furthermore, tissues react differently to cytokines in normal individuals, versus those with chronic diseases, such as diabetes, hypertension, or tumor lesions. These differences arise through differences in signal transduction pathway activation. We used microarrays and real-time polymerase chain reaction (real-time PCR) to measure the expression of genes or proteins involved in corneal stromal cell signal transduction. We compared normal cells in the spontaneously generated diabetes animal model (OLETF), with and without induction by pro-inflammatory cytokines.
Received: July 29, 2006 Accepted: February 20, 2007
Reprint requests to Jong Soo Lee, MD. Department of Ophthal- mology, College of Medicine, Pusan National University, 10 1-ga Ami-dong, Seo-gu, Pusan 602-739, Korea. Tel: 82-51-240-7319, Fax: 82-51-242-7341, E-mail: [email protected]
Transduction in Diabetic OLETF Keratocytes
Ji-Eun Lee, MD
1, Jong Soo Lee, MD
1, Sang Ho Hwang, MD
2Department of Ophthalmology, College of Medicine, Pusan National University
1, Pusan, Korea Siloam Eye Clinic
2, Pusan, Korea
Purpose: The purpose of this study was to identify differences in signal transduction gene expression between normal and diabetic keratocytes stimulated with interleukin-1α (IL-1α) and tumor necrosis factor-α (TNF-α).
Methods: Normal and diabetic keratocytes were primarily cultured and treated with 20 ng/ml IL-1α and TNF-α for 6 h. cDNA was hybridized to an oligonucleotide microarray. Genes identified by the microarray were further evaluated by real-time PCR.
Results: Diabetic keratocytes over-expressed components of the MAPK and Notch pathways, and under-expressed components of the insulin, calcium, and TGF-β pathways. Cytokine treated diabetic keratocytes differentially expressed components of the TGF-β and MAPK pathways. After IL-1α and TNF-α treatment, nine genes were under-expressed, falling in the insulin, TGF-β, and Toll-like receptor pathways.
Real-time PCR showed a significant decrease in the IL-6 and TGF-β2 genes and a significant increase in the Ppm1a gene.
Conclusions: There were some differences in gene expression between normal and diabetic keratocytes related to signal transduction pathways, such as the insulin, MAPK, calcium, and TGF-β pathways. In addition, IL-1α and TNF-α stimulating the insulin, TGF-β, and Toll-like receptor signaling pathways may have different effects in diabetic keratocytes.
Korean Journal of Ophthalmology 21(2):111-119, 2007
Key Words: Diabetes mellitus, Keratocyte, Microarray, Rat, Signaling transduction
Materials and Methods
1. Cell culture.
Fifty-week-old genetically-affected type 2 diabetic (OLETF, Otsuka Long-Evans Tokushima Fattay, Japan) and normal rat eyes were purchased from Otsuka pharmaceutical company (Japan). The corneal epithelium was removed, the corneal stroma isolated, and washed several times in saline containing antibiotics. The corneal endothelial layer was removed, and the corneal stromal tissue was cut into small pieces, and cultured serially in culture medium. The culture medium was Dulbeco's Modified Eagle medium (DMEM, Gibco BRL, NY, USA) containing 10 % fetal bovine serum (FBS, Gibco BRL. NY, USA), 100 units/ml penicillin (Gibco BRL, NY, USA), and 100 mg/ml streptomycin (Gibco BRL.
NY, USA). The culture medium was changed at 2-3 day intervals. When the cells became confluent, the culture medium was removed, the cells were washed once with Dulbeco's Phosphate-Buffered Saline (D-PBS, Gibco BRL, NY, USA) and dissociated with 0.25 % trypsin-0.02 % EDTA. For microarray experiments, cells between the 3rd and 4th generation of serial culture were collected and stored at -70℃.
2. Cytokine treatment.
The cytokines IL-1α (R&D Systems, MN, USA) and TNF(
(R&D Systems, MN, USA) were used to treat the corneal stromal cells of diabetic and normal rats treated at a concentration of 20 ng/ml for 6 hours.
3. RNA extraction.
Total cellular RNAs were extracted from the corneal stromal cells of diabetic and normal rats in primary culture using the RNeasy mini kit (QIAGEN inc, 74104, USA) for gene microarrays. First, denaturing solution was added to cell pellets on ice for 5 min, then phenol and chloroform were added to the samples, they were centrifuged, and the supernatant containing RNA was transferred to a new tube.
The process was repeated, and subsequently, -20℃
isopropanol was added to precipitate the RNA, centrifuged, and the supernatant discarded. The pellet was washed with -20℃ 80 % ethanol and air-dried. The RNA was quantitated and confirmed by electrophoresis.
4. DNA gene microarrays.
Sixty-mer oligonucleotides corresponding to each gene were synthesized, and subsequently placed on a slide using a robotic gene microarray. The robotic gene microarray places 0.25-1 nl DNA samples on a slide sample in spots averaging 100-150 nm. cDNA was synthesized from the isolated RNA samples using RT primers (Genisphere Inc,
PA, USA) and SuperScript II reverse transcriptase (Invitrogen, NY, USA). The purified cDNA was hybridized to an Agilent Rat oligo 22K chip (Agilent tech, G4130A, USA). For hybridization, slides were placed in a dark hybridization chamber at 62℃ for 16 h. The slides were removed, washed 3 times, and dried using a centrifuge. A fluorescent dye was added to DNA capture reagents that bind RT primers, and a second hybridization was performed for 4 h. The slides were removed, washed, and dried using a centrifuge. Afterward, the fluorescence level was measured using an Axon laser fluorescence scanner (Axon ins, CA, USA). The microarray analyzer used in our study has 105 rows and 215 columns. A total of 22575 genes pertinent to the signal transduction were included.
5. Analysis.
The hybridized slides were scanned by an Axon GenePix Laser Fluorescence Scanner and analyzed by GenePix Pro 5.1 (Axon, CA, USA) and GeneSpring 7.0 (Silicongenetics, CA, USA). Genes showing more than a two-fold difference in expression level between normal and diabetic rats were classified as significant. Genes showing similar patterns were distinguished by a Pearson correlation. The images show a gene as red if it is up-regulated in the diabetic rat, and green if it is down-regulated.
6. Real-time polymerase chain reaction.
Real-time polymerase chain reaction (real time-PCR) was performed with SYBR Green I immunofluorescence dye and the HotStarTag DNA polymerase QuantiTect SYBR Green PCR Kit (QIAGEN GmbH, Germany). To quantitate the control group, a standard curve of genes to be tested and GAPDH was prepared. The reactions were carried out in an ABI PRISM 7900 Sequence Detection System version 1.6 software (Perkin-Elmer Biosystems, Foster City, CA, USA).
Relative quantitation measurements were performed applying the relative standard curve method according to the manufacturer's instructions.
Results
The rats used in our experiments were 50-week-old Otsuka Long-Evans Tokushima Fatty (OLETF) diabetic rats. The blood glucose was an average of 115.0±10.8 mg/dL in the control group and 193.8±18.9 mg/dL in the OLETF group, with a significant difference. The body weights were 518.0±
13.3 g in the control group, and 628.5±63.2 g in OLETF rats. Thus, classic diabetes was observed.
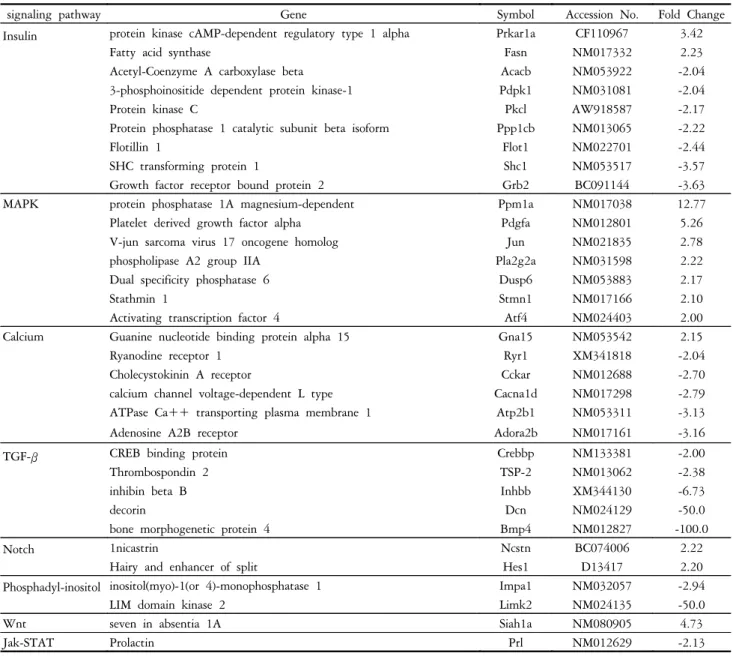
1. Comparison of expression in normal and diabetic corneal stromal cells
A total of 33 genes showed different expression in diabetic
corneal stromal cells compared to normal cells. These genes are involved in the MAPK, calcium, TGF-β, Notch, phosphatidylinositol, Wnt, and Jak-STAT signal transduction pathways. In the insulin pathway, the cAMP-dependent regulatory type 1 αprotein kinase and fatty acid synthase 2 were up-regulated, and 7 genes including the growth factor receptor bound protein 2, SHC transforming protein 1, and flotillin 1 were down-regulated. In the MAPK pathway, 7 genes including magnesium-dependent protein phosphatase 1A, platelet derived growth factor α, and V-jun (sarcoma virus 17 oncogene homolog) showed a difference in expression, all of which were up-regulated. In the calcium pathway, guanine nucleotide binding protein α15 was up-regulated, while the adenosine A2B receptor, ATPase Ca
++transporting plasma membrane 1, and calcium channel voltage dependent L type genes were down-regulated. In the
TGF-β pathway, BMP 4, decorin, inhibin βB, CREB binding protein, and thrombospondin 2 genes were down-regulated. In the Notch pathway, the hairy, enhancer of split 1, and Inicastrin genes were up-regulated. The genes involved in the Wnt signaling pathway were up-regulated.
The inositol (myo)-1(or 4)-monophosphatase 1 and LIM domain kinase 2 genes in the phosphatidylinositol signal pathway and the prolactin gene in the Jak-STAT pathway were down-regulated (Table 1).
2. Comparison of expression following cytokine treatment
2.1. Comparison of gene expression in normal and diabetic corneal stromal cells after cytokine treatment.
After cytokine treatment, there were differences between
Table 1. Up- and down-regulated genes in cultured diabetic rat keratocytes compared with normal rat keratocytes
signaling pathway Gene Symbol Accession No. Fold Change
Insulin protein kinase cAMP-dependent regulatory type 1 alpha Prkar1a CF110967 3.42
Fatty acid synthase Fasn NM017332 2.23
Acetyl-Coenzyme A carboxylase beta Acacb NM053922 -2.04
3-phosphoinositide dependent protein kinase-1 Pdpk1 NM031081 -2.04
Protein kinase C Pkcl AW918587 -2.17
Protein phosphatase 1 catalytic subunit beta isoform Ppp1cb NM013065 -2.22
Flotillin 1 Flot1 NM022701 -2.44
SHC transforming protein 1 Shc1 NM053517 -3.57
Growth factor receptor bound protein 2 Grb2 BC091144 -3.63
MAPK protein phosphatase 1A magnesium-dependent Ppm1a NM017038 12.77
Platelet derived growth factor alpha Pdgfa NM012801 5.26
V-jun sarcoma virus 17 oncogene homolog Jun NM021835 2.78
phospholipase A2 group IIA Pla2g2a NM031598 2.22
Dual specificity phosphatase 6 Dusp6 NM053883 2.17
Stathmin 1 Stmn1 NM017166 2.10
Activating transcription factor 4 Atf4 NM024403 2.00
Calcium Guanine nucleotide binding protein alpha 15 Gna15 NM053542 2.15
Ryanodine receptor 1 Ryr1 XM341818 -2.04
Cholecystokinin A receptor Cckar NM012688 -2.70
calcium channel voltage-dependent L type Cacna1d NM017298 -2.79 ATPase Ca++ transporting plasma membrane 1 Atp2b1 NM053311 -3.13
Adenosine A2B receptor Adora2b NM017161 -3.16
TGF-β CREB binding protein Crebbp NM133381 -2.00
Thrombospondin 2 TSP-2 NM013062 -2.38
inhibin beta B Inhbb XM344130 -6.73
decorin Dcn NM024129 -50.0
bone morphogenetic protein 4 Bmp4 NM012827 -100.0
Notch 1nicastrin Ncstn BC074006 2.22
Hairy and enhancer of split Hes1 D13417 2.20
Phosphadyl-inositol inositol(myo)-1(or 4)-monophosphatase 1 Impa1 NM032057 -2.94
LIM domain kinase 2 Limk2 NM024135 -50.0
Wnt seven in absentia 1A Siah1a NM080905 4.73
Jak-STAT Prolactin Prl NM012629 -2.13
normal and diabetic cells in genes related to the TGF-β, MAPK, insulin, Phosphatidylinositol, Wnt, calcium, and Notch signal pathways. None of the Jak-STAT pathway genes, including prolactin, were different. Three genes were unresponsive to TNF–α and responded to IL-1α; The Sp1 transcription factor (TGF-β pathway) and Peptidylprolyl isomerase D (calcium pathway) were down-regulated, and the Secreted frizzled related synthase 1 gene (Wnt pathway) was up-regulated. Several genes were unresponsive to IL-1α and responded to TNF–α; Thrombospondin 4 (TGF-β), cell division cycle 2 homolog A and Angiotensin II type-I receptor gene (calcium), CDP diacylglycerol synthase 1 gene (phosphatidylinositol) were expressed at lower than normal levels, and the FBJ murine osteosarcoma viral oncogene homolog and Jun D proto-oncogene gene (MAPK) were up-regulated (Table 2).
2.2. Genes newly expressed after IL-1α treatment.
IL-1α treatment induced expression of 14 genes belonging to the Jak-STAT, Toll-like receptor, calcium, MAPK, Wnt, and insulin pathways. Six genes were up-regulated, including Sphingosine kinase 1 (calcium), CD38 antigen gene,
Neutrophic tyrosine kinase II (MAPK), Nuclear receptor subfamily 4 group A member 1 gene and Axin 2 (Wnt), and the Wnt inhibitory factor 1 gene. Eight genes were down-regulated, primarily in the Toll-like receptor, insulin, and Jak-STAT pathways (Table 3).
2.3. Genes newly expressed after TNF-α treatment.
TNF–α treatment induced expression of genes in the calcium, MAPK, insulin, Toll-like receptor, Wnt, and Notch signal pathways. The MAPK, Wnt, and Notch pathways were up-regulated, while the calcium, insulin, and Toll-like receptor pathways were down-regulated. All genes were down-regulated (Table 4).
2.4. New gene expression common to both IL-1α and TNF –α treatment.
IL-1α and TNF-α stimulation both induced expression of nine genes in the insulin, TGF-β, Toll-like receptor, and adipocytokine pathways. In the insulin signal pathway, V-srk sarcoma virus CT 10 oncogene, suppressor of cytokine signaling 2, and liver glycogen phophorylase gene were expressed and down-regulated compared to control.
Table 2. Up- and down-regulated genes involved in corneal keratocyte signal transduction expressed in diabetic rat following cytokine treatment
Signaling pathway Gene Symbol Accession No. Fold Change
I
*II
†III
‡TGF-β CREB binding protein Crebbp NM133381 -2.00 -4.56 -2.90
inhibin beta B Inhbb XM344130 -6.73 -7.51 -4.01
decorin Dcn NM024129 -50.0 -5.26 -8.33
bone morphogenetic protein 4 Bmp4 NM012827 -100.0 -100.0 -100.0
Sp1 transcription factor Sp1 NM012655 -3.23 -2.63 -
Thrombospondin 4 Thbs4 X89963 -2.00 - -3.13
MAPK protein phosphatase 1A magnesium-dependent Ppm1a NM017038 12.77 6.67 7.47 Platelet derived growth factor alpha Pdgfa NM012801 5.26 6.67 9.09
phospholipase A2 group IIA Pla2g2a NM031598 2.22 3.03 2.56
FBJ murine osteosarcoma viral oncogene homolog c-fos NM022197 5.00 - 2.63
Jun D proto-oncogene Jund NM138875 2.22 - 2.63
Calcium calcium channel voltage-dependent L type Cacna1d NM017298 -2.79 -3.25 -3.60
Peptidylprolyl isomerase D Ppid NM1004279 -3.76 -4.94 -
Cell division cycle 2 homolog A Cdc2a NM019296 -3.42 - -2.11
Angiotensin II type-1 receptor Agtr1 NM031009 -6.08 - -37.44
Insulin protein kinase cAMP-dependent regulatory type 1 alpha Prkar1a CF110967 3.42 6.65 3.87
Protein kinase C Pkcl AW918587 -2.17 -2.94 -2.94
SHC transforming protein 1 Shc1 NM053517 -3.57 -2.44 -4.00
Phosphadyl-inositol inositol(myo)-1(or 4)-monophosphatase 1 Impa1 NM032057 -2.94 -3.70 -3.85
LIM domain kinase 2 Limk2 NM024135 -50.0 -25.00 -16.67
CDP-diacylglycerol synthase 1 cds1 NM031242 -2.63 - -2.86
Wnt seven in absentia 1A Siah1a NM080905 4.73 5.13 3.06
Secreted frizzled-related protein 1 Sfrp1 XM227314 5.26 6.67 -
Notch nicastrin Ncstn BC074006 2.22 2.04 2.33
*
The ratio of gene expression in diabetic rat stromal keratocytes compared with normal rat stromal keratocytes.
†
The ratio of gene expression following Interleukin-1α (IL-1α) treatment.
‡
The ratio of gene expession following Tumor necrosis factor-α (TNF-α) treatment.
Table 3. Gene up- and down-regulated for newly expressed genes following interleukin-1α treatment in cultured diabetic rat keratocytes compared with normal rat keratocytes
Signaling pathway Gene Symbol Acession No. Fold Change
Toll-like receptor Phosphatidylinositol 3-kinase regulatory subunit polypeptide 1 Pik3r1 NM013005 -2.00
Interleukin 1 beta Il1b NM031512 -2.22
G4 protein Tnf XM579722 -2.26
Toll-like receptor 2 Tlr2 NM198769 -4.55
Mitogen-activated protein kinase kinase 6 Map2k6 NM053703 -4.71
Calcium Sphingosine kinase 1 Sphk1 NM133386 2.04
CD38 antigen Cd38 NM013127 2.03
Adenylate cyclase 5 Adcy5 AW144517 -2.33
MAPK Neurotrophic tyrosine kinase, receptor type 2 Ntrk2 CB544493 3.41
Nuclear receptor subfamily 4 group A member 1 Nr4a1 NM024388 3.12
Wnt Axin2 Axin2 NM024355 2.47
Wnt inhibitory factor 1 Wif1 NM053738 2.04
Insulin Inositol polyphosphate-5-phosphatase D Inpp5d NM019311 -2.14
Jak-STAT Ciliary neurotrophic factor Cntf NM013166 -2.06
Table 4. Gene up- and down-regulated for newly expressed genes following tumor necrosis factor-α treatment in cultured diabetic rat keratocytes compared with normal rat keratocytes
Signaling pathway Gene Symbol Acession No. Changes (X)
Calcium Hypothetical gene Pdgfrb NM031525 -2.08
Arginine vasopressin receptor 1A Avpr1a NM053019 -2.08
Coagulation factor II receptor F2r NM012950 -2.08
Purinergic receptor P2X ligand-gated ion channel 4 P2rx4 NM031594 -2.22
Phospholamban Pln NM022707 -3.03
MAPK Heat shock 27kD protein 2 Hspb2 NM130431 2.5
V-raf murine sarcoma viral oncogene homolog B1 Braf XM231692 2.22
RAS guanyl releasing protein 4 Rasgrp4 NM130824 2.08
TAO kinase 2 Tao2 NM022702 2.04
Notch Jagged 1 Jag1 NM019147 2.50
Notch gene homolog 2 Notch2 NM024358 2.07
Toll-like receptor Interferon, beta 1 Ifnb1 NM019127 -3.70
Insulin Fructose-1,6-bisphosphatase 2 Fbp2 NM053716 -2.17
Wnt Protein phosphatase 2 regulatory subunit A alpha isoform Ppp2r1a BG667851 2.38
Table 5. Gene up- and down-regulated for newly expressed genes following treatment with both interleukin-1α and tumor necrosis factor-α in cultured diabetic rat keratocytes compared with normal rat keratocytes
Signaling pathway Gene Symbol Acession No. Changes(X)
I
*II
†Insulin V-crk sarcoma virus CT10 oncogene Crk NM019302 -2.04 -2.70
suppressor of cytokine signaling 2 Socs2 NM058208 -2.09 -2.11
Liver glycogen phosphorylase Pygl NM022268 -2.5 -3.57
TGF-β follistatin Fst NM012561 -2.33 -2.56
transforming growth factor beta 2 Tgfb2 NM031131 -2.38 -3.57
bone morphogenetic protein 2 Bmp2 BF559333 -2.00 -5.00
Toll-like Receptor interleukin 6 Il6 NM012589 -2.02 -3.23
chemokine ligand 5 Ccl5 NM031116 -3.03 -3.03
Adipocytokine neuropeptide Y Npy NM012614 -33.33 -12.5
*
The ratio gene expression following Interleukin-1α (IL-1α) treatment.
†