Spatio-Temporal Trends in Temperature, Acidification and Dissolved Oxygen in Lower Mekong Basin for 1985-2005
1)
Ratanavong, Nilapha*ㆍLim, Sam Sung**ㆍLee, Hyung Seok***
要 旨
침전물 변화의 이해는 수질모니터링에 있어서 중요한 요소이다. 수질 변수는 시공간에 의해 변하므로 시간분석이 나 공간분석 한 가지만으로는 모형화하거나 명확히 설명하기 어렵다. 본 연구에서는 1985년부터 2005년까지 메콩 강 하류 유역에서 수집된 침전물 기록과 공간 자료를 근거로 온도, 페하 수준 및 용존산소 수준을 파악하고, 역거 리가중법을 이용하여 시공간 경향과 시각 분석을 평가하고자 한다. 그 결과, 온도와 페하의 최대값은 이 기간 동안 큰 변화없이 나타났고 최대 용존산소는 2002년까지 점점 증가하여왔다. 최소 페하와 용존산소는 이 기간 동안 불 안정한 경향으로 변화하였다. 역거리가중법 보간을 이용한 경향 분석에서는 연구 지역의 전반적인 수온이 계속 증 가했다는 것을 보여주었고, 페하는 1993년부터 2005년 동안 감소하는 경향을 나타냈다. 용존산소농도는 1989년 이 후 증가하였고 2002년부터는 많이 확산되지 않았다.
핵심용어 : 메콩강 하류유역, 시공간 경향, 역거리가중법 보간, 예측오차
Abstract
Understanding of water sediment trends is an important part of water quality monitoring. Water quality variables change over time and space, and cannot be modeled or explained clearly by either temporal or spatial analysis alone. This research analysed the trends of temperature, pH levels and dissolved oxygen levels based on the sediment records and spatial data obtained in Lower Mekong Basin (LMB) during 1985-2005. Our aim is to evaluate spatio-temporal trends and graphical analyses using an Inverse Distance Weighting (IDW) interpolation method. The main results from this research can be summarized as follows. The maximum temperature and pH have been stable during the study period and the maximum dissolved oxygen has been increasing gradually until 2002.
The minimum pH and dissolved oxygen have been changing in an unsteady trend during the period. A spatial analysis shows that the water temperature in this region has been increasing over time. The pH trend shows that it is decreasing during 1993-2005. Dissolved oxygen concentration has been increasing from 1989 onwards and stays in that track.
Keywords : Lower Mekong Basin, Spatio-temporal trends, IDW interpolation, Prediction error
1. Introduction
In the past, it was difficult to conduct hydrological surveys and therefore it makes hydrologists difficult to deal with water quality problems[2]. Better understanding of the spatio-temporal variations in water quality will help develop an appropriate trend
analysis in a long-term perspective, reduce possible ecological problems, and take full advantages of the natural resources in the region of interest[7]. Lower Mekong Basin(LMB) has been experiencing an extremely low water level over the past several years.
It is speculated that such a problem is one of the consequences of the construction and operation of the
2011년 7월 22일 접수, 2011년 10월 1일 채택
* Researcher, Regional Resource Center in Asia and the Pacific, United Nations Environment Programs ([email protected])
** Associate Professor, School of Surveying and Spatial Information Systems, The University of New South Wales, Sydney, NSW, Australia([email protected])
*** Corresponding Author, Member, Associate Professor, Dept. of Civil and Environmental Engineering, Hanzhong University ([email protected])
연구논문
Dataset Availability Source Sediment records:
∙Period 1(1985-2005): Lao PDR, Thailand, Vietnam
∙Period 2(1993-2005): Cambodia, Lao PDR, Thailand, Vietnam
1985-2005 MRC
Spatial data:
∙Administration
∙Hydrology and meteorology
∙Water quality sampling stations
∙DEM
∙River and tributaries
∙Basin
∙Transportation (roads, ports)
∙Irrigation
Obtained in January 2008 MRC Table 1. Datasets for LMB
Chinese hydropower projects in the upper region of the Mekong mainstream i.e. Lancang River. This problem can cause a series of induced effects to downstream in terms of water, sediment, channel and ecological changes[4].
Water temperature is one of the important indicators of physical water body properties.
Considering that Mekong River flows from north to south, the water temperature along the longitudinal direction decreases as the latitude increases[7]. The acidification level (pH) is also an important indicator in the water quality assessment as it influences many biological and chemical processes within the water body and all the processes associated with water supply and treatment. Oxygen is essential to all forms of aquatic life, including those organisms responsible for the self-purification processes in natural water. Oxygen content varies depending on temperature, salinity, turbulence, photosynthetic activity of algae/plants, and atmospheric pressure[2].
A low oxygen level of water can result in a low oxygen level in the sediment, which can cause the nutrients and toxicants to be released. Deterioration of water quality has been the main environmental issue for the basin. Major water quality-related concerns include anthropogenic activities, elevation of suspended sediment levels, elevated levels of microbial pollution, pesticide pollution, elevated salinity levels in the upstream, water quality changes caused by stratification, acidification of surface waters and wetlands, and increased saline intrusion in the Vietnam Delta.
Various spatio-temporal estimation techniques have been applied to the environmental study. As a result, for example, the decrease of fish population from acid mine drainage and sediment mercury[6] and the increase of snowfall in Great Lakes[5] were found, while a spatial and temporal distribution of heavy metals in the sediment were identified[3]. The main objective of this study is to analysis the spatio- temporal trends of temperature, acidification levels and dissolved oxygen levels in LMB for the period of 1985-2005 by investigating the data collected by Mekong River Commission(MRC) who have been responsible for the water sampling stations and natural/anthropogenic causes. Geographical Information System(GIS) has many applications in hydrology that use spatial analysis tools. In order to trace the trends of water quality of Mekong River for the period of 1985-2005, the spatial analysis tools of GIS are used to statistically analyze the sediment records and produce thematic maps of the results.
2. Study area and datasets
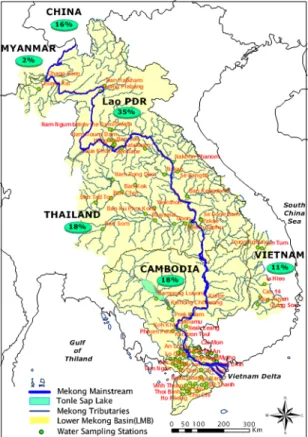
Mekong Basin has been experiencing dramatic land surface disturbance such as deforestation, expansion of arable lands, reservoir construction and water division due to population growth and expanding urbanization[4]. MRC is responsible for the Mekong water monitoring. As shown in Figure 1, LMB is contained within the four riparian countries:
Cambodia, Lao PDR, Thailand and Vietnam. It is reported that China, Myanmar, Thailand, Lao PDR,
Cambodia, and Vietnam, contribute their average flow of 16%, 2%, 18%, 35% and 18%, respectively, to LMB. Lao PDR contributes the highest and Myanmar does the least.
Spatial data and sediment records used for this paper are listed in Table 1. This study examines the spatial and temporal trends of three water quality indicators: temperature(°C), acidification level(pH) and dissolved oxygen amount(mg/L). The sediment records are available for the period of 1985-2005, however, the study period was divided into two different periods because the sediment records for Cambodia were not available during 1985-1992 as seen in Table 1. This is also to avoid any possible errors to the surface interpolation and statistical analysis.
The sediment records from MRC contain a number of sediment types. However, this study focuses on three parameters listed in Table 2.
Fig 1. Location of the Mekong river basin
Table 2. Selected variables
Selected parameters Values Temperature (°C) Min / Max Acidification (pH) pH level Organic matter that can be oxidized DO (mg/L)
3. Methodology
The analysis is mainly conducted on the sediment records and spatial data obtained from the MRC Secretariat in January 2008. The original sediment records are available in a spreadsheet format. Some stations at small canals and tributaries were removed from the table as their geographic information is missing. In order to make the attribute table contain both Station ID and the geographic coordinates, shapefiles for water sampling stations were joined with the sediment records database via Station ID.
Then new shapefiles containing both sediment records and locations for 99 water sampling stations were created. Temperature, acidification level and dissolved oxygen concentration were calculated by taking mean of the records. Three new shapefiles for 3 variables (temperature, pH and DO) were created in order to allow easy Inverse Distance Weighting (IDW) surface interpolation. Different interpolation
Fig 2. Methodology for trends of water quality indicators
(a) Temperature (°C)
(b) Acidification level (pH)
(c) Dissolved oxygen (mg/L)
Fig 3. Temporal trends of the temperature, acidity and dissolved oxygen(1985-2005) methods were experimented to help improve the
trend analysis, that is, not only IDW but also Kriging interpolation was tested to compare the prediction results(Figure 2).
4. Analysis results
4.1 Evaluation of temperature, acidification level, and dissolved oxygen
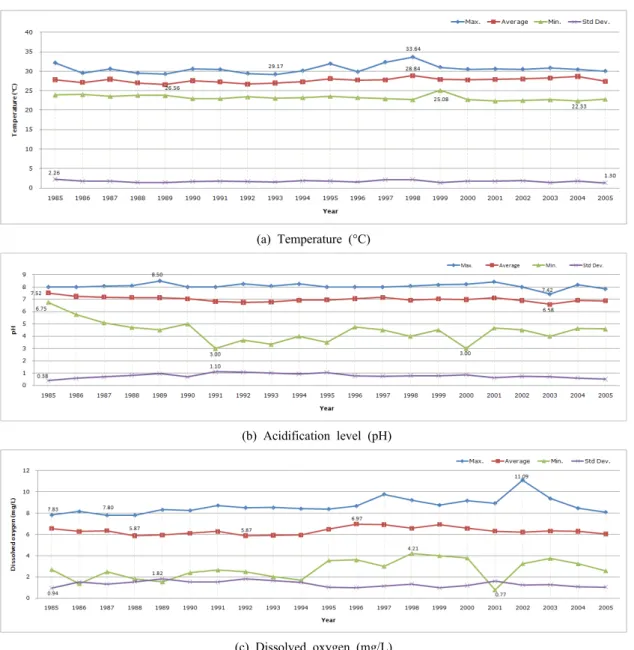
Trends of sediment concentration and temperature,
acidification level and dissolved oxygen were observed in the form of time series in order to examine the statistical trends for the period of 1985-2005(Figure 3). As shown in Figure 3(a), once the maximum temperature increases up to 33.64°C in 1998, it tends to decrease continuously until 2005.
The minimum temperature ranges from 22.33°C to 25.08°C. The average temperature for the period ranges from 26.56-28.84°C and has been varying within 2.28°C for the 20 years.
(a) Period 1: 1985-1992
(b) Period 2: 1993-2005 Fig 4. Temperature (°C) trends for 1985-2005
The variation of acidification level remained stable during the period as seen in Figure 3(b). However, with the peak of 8.50 in 1989, the rate of the minimum acidity fluctuated up to 6.75 and reached a trough of around 3.00 from 1991 to 2000. As can be told from Figure 3(c), the maximum dissolved oxygen was at its lowest value of 7.80mg/L in 1987, however, it increased by 1.42 times to 11.09mg/L in 2002. The only period for the decrease of the minimum value was in 2001 from 4.21mg/L to 0.77mg/L.
4.2 Temperature(°C)
Ubon, Rasisalai and Yasothon in Thailand experienced the highest average temperature, which ranges between 31.63-32.13°C, according to Figure 4(a). These stations are located in the North Eastern part of Thailand, which often experienced drought events and high temperature compared to other parts of the LMB. Chiang Sean and Luang Prabang
generally had the average temperature ranging between 23-25°C and experienced the lowest temperature at the average of 23.00°C in 1990.
Luang Prabang experienced the lowest average temperature at 22.33°C in 2004 as seen in Figure 4(b). The temperature in Luang Prabang remained the same with the average of 24.10°C during 1993-1998, increased slightly to 25.50°C in 1999, and decreased down to 22.33-25.83°C during 2000-2004. The temperature in Chiang Sean has been stable, ranging between 22.33 and 24.08°C and experienced the highest temperature at 25.08°C in 1999. Ban Sok experienced the highest average temperature of 33.64
°C in 1998, compared to other stations. In general, most of the stations experienced the average temperature between 26.00-31.91°C. However, Pakse experienced a major drop in temperature to 23.25°C in 1994, where normally its average temperature had been approximately 27°C.
(a) Period 1: 1985-1992
(b) Period 2: 1993-2005 Fig 6. pH level trends for 1985-2005
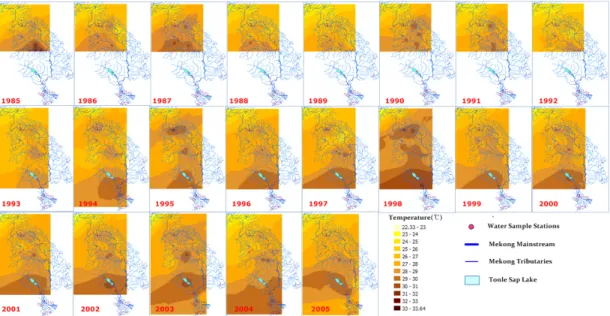
Fig 5. Results from the spatio-temporal analysis on temperature during 1985-2005
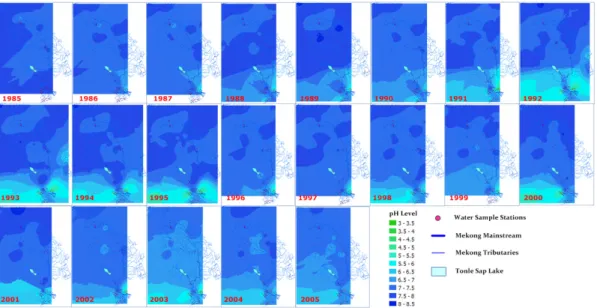
Fig 7. Results from the spatio-temporal analysis on pH during 1985-2005 Figure 5 shows the spatial distribution of the
temperature from year 1985 to year 2005. The light yellow areas have lower temperature compared to the darker yellow/brown areas. The temperature was lower in the upper part of the river, and higher in the lower part during period 1(1985-1992), and the similar trends also occurred during period 2 (1993-2005) (Figure 5). This is obvious because Mekong River flows from north to south. However, by applying the trend analysis to the time series data, it is found that the overall temperature in LMB is ever increasing.
4.3 Acidification level
According to Figure 6(a), 1985 experienced the highest pH (8.00) and lowest pH (6.75) compared to other years. Most of stations had the pH level between 6.75 and 8.50. However, the pH level at Long Dinh dropped significantly in 1992 down to 5.33.
Long Dinh Canal(Vietnam Delta) experienced the very low pH level of 3.50 in 1995 as seen in Figure 6(b), indicating that acidification was significant in this water body. The pH level at Long Dinh canal increased again in 2000(pH 6.25) and 2005 (pH 6.67). As for other years, the condition of the water was generally good.
From the spatial analysis, the pH levels have been
increasing at most of the stations (Figure 7). Years 1988 and 1989 showed obvious increasing trends throughout the basin. In period 2, it showed decreasing trends during 1993-2001, then the extent of high pH appeared to be smaller in 2003, and pH trends showed very much lower pH values in 2005.
4.4 Dissolved oxygen(DO)
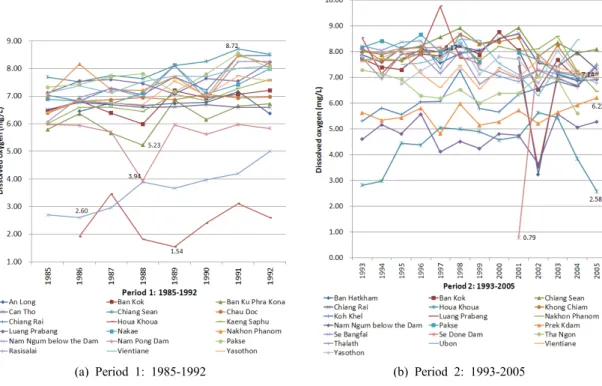
According to Figure 8(a), Houa Khoua and Nam Ngum Dam experienced low DO concentration, ranging between 1.5 and 2.6mg/L. The DO concentration at these sites increased during 1990- 1992. Nam Pong Dam’s average DO concentration was between 5 and 6, but experienced the lowest DO concentration of 3.94mg/L in 1998. Most of other stations had the average DO concentration between 5.23 and 8.72mg/L.
Se Done Dam experienced a great drop in DO concentration in 2001(0.79mg/L) as seen in Figure 8(b). This indicates poor water quality in the region.
However, other years showed the average DO concentration, ranging between 7.14 and 8.17, indicating good water quality. Prek Kdam, Nam Ngum Dam and Houa Khoua showed a distinctive pattern. The DO concentration in this region was lower than that of other stations, ranging between 2.58 and 6.22.
(a) Period 1: 1985-1992
(b) Period 2: 1993-2005 Fig 8. Dissolved oxygen concentration trends for 1985-2005
Fig 9. Results from the spatio-temporal analysis on dissolved oxygen during 1985-2005.
Houa Khoua showed a very low level of DO(2.58 mg/L) in 2005, indicating very bad water quality.
From spatial analysis, the dissolved oxygen showed different concentration trends from year to year.
Dissolved oxygen started to increase from 1989
onwards (Figure 9) in both concentration and extent.
From 2002, dissolved oxygen concentration did not spread out much from the sampled stations. This occurred similarly in 2005, with smaller concentration trends.
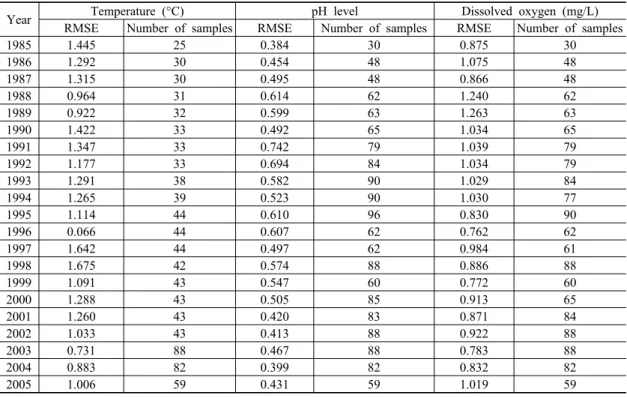
Year Temperature (°C) pH level Dissolved oxygen (mg/L) RMSE Number of samples RMSE Number of samples RMSE Number of samples
1985 1.445 25 0.384 30 0.875 30
1986 1.292 30 0.454 48 1.075 48
1987 1.315 30 0.495 48 0.866 48
1988 0.964 31 0.614 62 1.240 62
1989 0.922 32 0.599 63 1.263 63
1990 1.422 33 0.492 65 1.034 65
1991 1.347 33 0.742 79 1.039 79
1992 1.177 33 0.694 84 1.034 79
1993 1.291 38 0.582 90 1.029 84
1994 1.265 39 0.523 90 1.030 77
1995 1.114 44 0.610 96 0.830 90
1996 0.066 44 0.607 62 0.762 62
1997 1.642 44 0.497 62 0.984 61
1998 1.675 42 0.574 88 0.886 88
1999 1.091 43 0.547 60 0.772 60
2000 1.288 43 0.505 85 0.913 65
2001 1.260 43 0.420 83 0.871 84
2002 1.033 43 0.413 88 0.922 88
2003 0.731 88 0.467 88 0.783 88
2004 0.883 82 0.399 82 0.832 82
2005 1.006 59 0.431 59 1.019 59
Table 3. Errors of the trend analysis for temperature, pH and dissolved oxygen from 1985 to 2005
4.5 Prediction errors
Statistical analysis of the trends of temperature, acidification level and dissolved oxygen concentration appeared to be useful. However, it is also important to consider possible errors associated with the spatial interpolation. Table 3 indicates the root mean square errors from year to year.
5. Conclusions and remarks
Data on water quality parameters vary in time and space each year, reflecting environmental factors and conditions. The trend analysis of temperature, acidification level and dissolved oxygen concentration over a 20-year period has revealed a unique spatio-temporal pattern. A spatio-temporal approach is presented for the assessment of trends in Lower Mekong Basin. Statistical analysis of the trends of temperature, acidification level and dissolved oxygen concentration was conducted. A variety of informative space-time maps of temperature, acidification level and dissolved oxygen concentration was produced. In contrast to existing methods used for analyzing the
river data, this method incorporates the spatio- temporal dependence explicitly.
Understanding of water sediment trends is an important part of water quality monitoring. Water quality variables change over time, and cannot be modeled or explained by normal analytical procedures.
Water quality time-series with a long-term trend can display some measures of autocorrelation. This study is limited by the three variables, hence should be improved as future work. Spatial interpolation appeared to be a useful tool to conduct a statistical analysis on the sediment records over time.
Observing a histogram of each parameter per year is an effective way to inspect the data value range in a particularly interpolated surface output.
References
1. Bowman, A.W., Giannitrapani, M. and Scott, E. M., 2009, “Spatio-temporal Smoothing and Sulphur Dioxide Trends over Europe”,
Journal of the Royal Statistical Society
, Part 5, pp.737-752.2. Chapman, D., 1996, Water Quality Assessments – A
Guide to Use of Biota, Sediments and Water in Environmental Monitoring, 2nd Edition.
3. Chen, K and Jiao, J.J., 2010, “Spatio-temporal Trends of Heavy Metals and Source Apportionment in Tolo Harbour, Hong Kong.”
Environmental Earth Science
, 60(7):1439-1445.4. Lu, X.X. and Siew, R.Y., 2005, “Water Discharge and Sediment Flux Changes in the Lower Mekong River”,
Hydrology and Earth System Sciences Discussions
, pp.2287-2325.5. Norton, D.C. and Bolsenga, S.J., 1993,
“Spatio-temporal Trends in Lake Effect and Continental Snowfall in the Laurentian Great Lakes, 1951-1980”,
Journal of Climate
, 6:1943-1956.6. Suchanek, T.H., Eagles-Smith, C.A., Slotton, D.G., Jamesharner, E., Colwell, A.E., Anderson, N.L., Mullen, L.H., Flanders, J.R., Adam, D.P. and Mcelroy, K.J., 2008, “Spatio-temporal Trends in Fish Mercury from a Mine-dominated Ecosystem: Clear Lake, California”,
Ecological Applications
, 18(8):A177–A195.
7. YiPing, Z., Fu, G., DaMing, H. and ShaoJuan, L., 2007, “Comparison of Spatial-temporal Distribution Characteristics of Water Temperatures between Lancang River and Mekong River, Chinese Science Bulletin”, Science in China Press, Springer, 52(2):141-147.