ORIGINAL ARTICLE
Local Climate Zone과 토지피복에 따른 여름철 야간의 인간 열환경 분석 - 경기도 수원시 호매실 택지개발지구
Human Thermal Environment Analysis with Local Climate Zones and Surface Types in the Summer Nighttime
- Homesil Residential Development District, Suwon-si, Gyeonggi-do
공학양1ㆍ최낙훈2ㆍ박수국3*
1국립환경과학원 환경자원연구부 자연환경연구과 환경연구사, 2국립환경과학원 환경자원연구부 자연환경연구과 전문위원
3제주대학교 생명자원과학대학 생물산업학부 원예환경전공 교수
Hak-Yang Kong1, Nakhoon Choi2 and Sookuk Park3*
1Researcher, Department of Environment Research Division, National Institute of Environmental Research, Incheon 22689, Korea
2Researcher, Department of Environment Research Division, National Institute of Environmental Research, Incheon 22689, Korea
3Professor, Research Institute for Subtropical Agriculture and Animal Biotechnology, SARI, Horticultural Science, College of Applied Life Sciences, Jeju National University, Jeju 63243, Korea
Received 11 June 2020, revised 7 December 2020, accepted 10 December 2020, published online 31 December 2020
ABSTRACT: Microclimatic data were measured, and the human thermal sensation was analyzed at 10 local climate zones based on the major land cover classification to investigate the thermal environment of urban areas during summer nighttime.
From the results, the green infrastructure areas (GNIAs) showed an average air temperature of 1.6°C and up to 2.4°C lower air temperature than the gray infrastructure areas (GYIAs), and the GNIAs showed an average relative humidity of 9.0% and up to 15.0% higher relative humidity. The wind speed of the GNIAs and GYIAs had minimal difference and showed no significance at all locations, except for the forest location, which had the lowest wind speed owing to the influence of trees. The local winds and the surface roughness, which was determined based on the heights of buildings and trees, appeared to be the main factors that influenced wind speed. At the mean radiant temperature, the forest location showed the maximum value, owing to the influence of trees. Except at the forest location, the GNIAs showed an average decrease of 5.5°C compared to GYIAs. The main factor that influenced the mean radiant temperature was the sky view factor. In the analysis of the human thermal sensation, the GNIAs showed a “neutral” thermal perception level that was neither hot nor cold, and the GYIAs showed a
“slightly warm” level, which was a level higher than those of the GNIAs. The GNIAs showed a 3.2°C decrease compared to the GYIAs, except at the highest forest location, which indicated a half-level improvement in the human thermal environment.
KEYWORDS: Green infrastructure, LCZ, Nighttime, PET, Thermal environment, Urban area
요 약: 도시지역의 여름철 밤 시간대 열환경을 알아보기 위해, 토지피복 대분류에 따라 10개의 도시기후지역 지점에서 미기후 자료를 측정하여 인간 열환경지수를 분석하여 보았다. 미기후 요소 비교 분석 결과, 그린인프라 지역이 그레이인프라 지역보다 기온에서는 평균 1.6°C 최대 2.4°C 낮은 결과를 보였으며, 상대습도에서는 반대로 그린인프라 지역이 평균 9.0% 최대 15.0%
높은 결과를 보였다. 풍속에서는 그린인프라 지역과 그레이인프라 지역에서 차이가 거의 없는 것으로 나타났으며, 수목의 영향으로
*Corresponding author: [email protected], ORCID 0000-0002-5455-8371
ⓒ Korean Society of Ecology and Infrastructure Engineering. All rights reserved.
This is an open-access article distributed under the terms of the Creative Commons Attribution Non-Commercial License (http://creativecommons.org/licenses/by-nc/3.0/), which permits unrestricted non-commercial use, distribution, and reproduction in any medium, provided the original work is properly cited.
227
1. 서 론
전 지구적 기후변화는 인간의 정주공간에 많은 변화 를 주며, 특히 2018년 전 세계 인구의 55%, 대한민국 인 구의 81% (세계은행 자료, https://data.worldbank.org/
indicator/SP.URB.TOTL.in.zs)가 거주하는 도시지역 은 도시화로 인해 더 심각한 기후변화 영향을 받고 있다 (Oke 1973, Arnfield 2003). 국제기후변화패널 (Inter- governmental Panel on Climate Change, IPCC) 보고 서에서도 기후변화에 의해 폭염과 열대야는 더 강하고 길어질 것이라고 전망하고 있어, 도시의 열환경은 더 열악해 질 것으로 보인다 (IPCC 2013).
도시의 열환경에 대한 우려는 도시기후에 대한 연구 와 그린인프라 (Green Infrastructure)로 불리는 공간자 원의 기능과 활용에 대한 관심으로 이어졌다. 그린인프 라는 도시의 생태적 기능 및 시민의 삶의 질 향상에 기 여하는 자연공간 또는 자연에 가까운 공간의 네트워크 로 (European Commission 2013), 도시지역 거주자에 게 양질의 삶을 제공하는 핵심적인 요소이다 (Tzoulas et al. 2007, Mell 2008, Lafortezza et al. 2013). 도시의 그린인프라는 특히 온대와 지중해성 기후에서 야외환 경에서의 인간 열쾌적성을 높일 수 있는 매우 유용한 도 구로 알려져 있다 (Ottelé et al. 2011, Klimn et al.
2015). 또한 도시의 그린인프라가 도시의 열을 효과적 으로 감소시키고 야외공간에서 열쾌적성을 증가시킨 다는 연구 결과가 있으며 (Dimoudi and Nikolopoulou 2003, Bowler et al. 2010), 열환경 개선 및 향후 기후변 화에 적응하고자 하는 도시계획에 그린인프라를 활용 하는 사례가 늘고 있다 (Gill et al. 2007, Demuzere et al. 2014, Norton et al. 2015).
도시기후에 대한 연구는 1980년대부터 도시열섬 (urban heat island) 현상을 주제로 도시구조형태에 따
른 열환경 분석 연구가 주로 선행되었다 (Park and Jung 1999, Song 2002, Han 2006, Cha et al. 2007, Jo and Ahn 2009, Yeo et al. 2009, Yi et al. 2011). 이후 도시열 섬 현상 분석을 위해 국제적으로 통용하기 쉽게 도시기 후지역 (Local climate zone, LCZ)라는 분류법이 개발 되었는데 (Stewart and Oke 2012), 건축물 형태 (built type)에 따라 LCZ 1 - 10까지 10종, 토지피복 유형 (land cover type)에 따라 LCZ A-G까지 7종, 총 17종류의 LCZ 유형에, 지표면 속성 (land cover property)에 따 라 4종류를 더 추가하여 분류하는 방법이다.
국내의 기후지역분류에 따른 도시기후 연구는 서울 의 도시열섬현상을 기상청 자동기상관측자료와 그 관 측소의 LCZ 유형에 따른 영향을 분석한 연구 (Hong et al. 2013)와 World Urban Database and Access Portal Tools (WUDAPT) protocol의 LCZ 분류 방법을 이용 해 서울의 LCZ 유형을 분류한 연구 (Kim and Eum 2017)가 유일하다. LCZ 유형은 도시열섬 연구, 즉 도시 지역 (urban area)과 농촌지역 (rural area)의 기온의 변 화에 대한 분석을 위해 만들어진 것이지만, 도시에 거 주하고 있는 사람들이 체감하는 열환경을 분석하기 위 해서는 인간 에너지 균형 모델 (human energy balance model)을 토대로, 기온뿐만 아니라 인간의 열환경에 영향을 미치는 다른 기후 요소인 습도, 풍속, 태양 및 지 구복사에너지를 포함한 연구들이 요구된다. 근래에 들 어서 전 세계적으로 LCZ와 인간 열환경지수/열쾌적성 (human thermal sensation/comfort)을 접목하는 연구 들이 진행되고 있으나 (Stewart et al. 2014, Villadiego and Velay-Dabat 2014, Milošević et al. 2016, Unger et al. 2018, Kwok et al. 2019, Lau et al. 2019, Lyu et al. 2019), 아직 국내에서는 Kong et al. (2018)의 9개의 LCZ 유형에서 여름철 주간의 인간 열환경을 분석한 연 구가 유일하며, 야간 열환경에 대한 연구는 아직 진행 가장 낮은 풍속을 보인 산림지점을 제외하고는 모든 지점에서 유의성이 없는 것으로 나타나, 건물이나 수목의 높이에 의해 결정되는 표면거칠기 뿐만 아니라 지역풍의 영향이 풍속을 결정하는 주 요인인 것으로 보인다. 평균복사온도에서는 수목의 영향으로 산림지역이 가장 높은 값을 보였으며, 산림지역을 제외하면 그린인프라 지역이 그레이인프라 지역에 비해 평균 5.5°C의 저감 효과를 보였다.
평균복사온도를 결정하는 주 요인으로는 하늘시계지수라고 할 수 있다. 인간 열환경지수 분석에서는 그린인프라 지역은 거의 덥지도 춥지도 않는 ‘중립’의 열지각 단계를 나타내었으며, 그레이인프라 지역은 그것보다 한 단계 높은 ‘약간 따뜻함’의 단계를 나타내었다. 가장 높게 나온 산림지역을 제외하면, 그린인프라 지역이 그레이인프라 지역에 비해 3.2°C 저감 효과를 보여 1/2 단계의 인간 열환경 개선 효과가 있는 것으로 나타났다.
핵심어: 생리등가온도, 도시기후지역, 밤 시간대, 그린인프라, 열환경, 도시지역
되지 않았다.
이 연구는 수원시 호매실 택지개발지구 일대를 국내 에서 이용되고 있는 토지피복 분류와 LCZ 유형을 접목 하여, 여름철 밤 시간대의 미기후 자료 측정과 인간 열 환경지수를 비교분석하고 그린인프라와 그레이인프 라의 야간 열환경 특성을 확인해 보고자 하였다.
2. 연구 방법
2.1 연구대상지
경기도 수원시 권선구 금곡동에 위치한 호매실 택지 개발지구와 입북동 농경지를 연구대상지 (N37°16′, E126°56′)로 선정하였다 (Fig. 1). 호매실 택지개발지 구는 그린벨트 해제 후 2015년 공공주택단지 준공이 완
료되어 최근 전형적인 택지지구 도시개발형태를 잘 보 여주고 있는 지역이다. 동쪽에 인접한 입북동 농경지는 비행안전을 위한 개발제한 지역으로 향후 수원 군사공 항의 변화에 따라 개발가능성이 매우 높은 지역이다.
연구대상지는 토지피복 대분류에 따라 시가화건조지 역 (urban), 농업지역 (agriculture), 산림지역 (forest), 초지 (grass), 나지 (bare land), 수역 (watershed) 총 6지 역으로 나누었으며, 그 중 그레이인프라는 시가화건조 지역과 나지, 그린인프라는 농업지역, 산림지역, 초지 와 수역으로 구분하였다.
그레이인프라인 시가화건조지역에서는 LCZ에 따 라 상업지역 (LCZ 2, compact mid-rise), 고층아파트 지역 (LCZ 4, open high-rise), 주택지역 (LCZ 6, open low-rise), 교통지역으로 주차장 (LCZ E, bare rock or paved)을 선정하였다 (Table 1). 나지는 칠보초등학교
(a) (b)
Fig. 1. Map showing the study area in the Homesil, Suwon, Korea. The circles indicate the study locations. (a) Homesil residential developing district (https://www.google.co.kr/maps) and (b) Photographs of the locations.
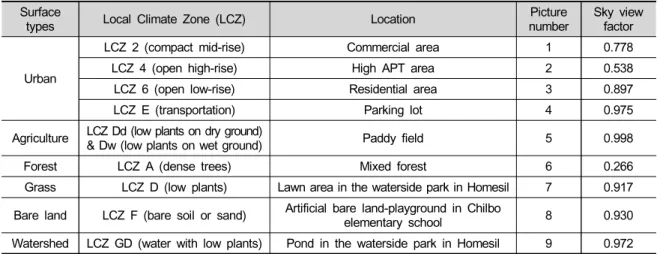
Table 1. Locations of microclimatic data measurements Surface
types Local Climate Zone (LCZ) Location Picture
number Sky view factor
Urban
LCZ 2 (compact mid-rise) Commercial area 1 0.778
LCZ 4 (open high-rise) High APT area 2 0.538
LCZ 6 (open low-rise) Residential area 3 0.897
LCZ E (transportation) Parking lot 4 0.975
Agriculture LCZ Dd (low plants on dry ground)
& Dw (low plants on wet ground) Paddy field 5 0.998
Forest LCZ A (dense trees) Mixed forest 6 0.266
Grass LCZ D (low plants) Lawn area in the waterside park in Homesil 7 0.917
Bare land LCZ F (bare soil or sand) Artificial bare land-playground in Chilbo
elementary school 8 0.930
Watershed LCZ GD (water with low plants) Pond in the waterside park in Homesil 9 0.972
운동장 (LCZ F, bare soil or sand)으로 정하였다.
그린인프라인 농업지역은 논에 물을 댄 곳 (LCZ Dw, low plants on wet ground)과 물을 대지 않은 곳 (LCZ Dd, low plants on dry ground)을 선정하였으며, 산림지 역은 LCZ 6 동쪽에 위치한 도시숲 (LCZ A, dense trees)으로 정하였다. 초지와 수역은 호매실 수변공원 에 위치한 잔디밭 (LCZ D, low plants)과 수경공간 (LCZ GD, water with low plants)을 선정하였다.
2.2 미기후 자료 측정 및 분석
미기후 측정은 Table 2의 장비를 이용하여, 2018년 7월 19 - 21일 21:00 - 01:00 동안 이루어졌으며, 기온, 상대습도, 풍속 및 풍향, 태양 및 지구복사에너지를 신 체의 평균 가슴높이인 1.2 m에서 측정하였다 (Table 2).
태양과 지구복사에너지는 5초 단위로, 기온, 상대습도,
풍속과 풍향은 1분 단위로 측정하였다.
장비운용의 제한으로 7월 19 - 20일 21:00 - 01:00 동 안 LCZ D, LCZ F, LCZ Dd, LCZ GD, LCZ E, LCZ A, 총 6 지점에서 측정하였으며, 7월 20 - 21일 21:00 - 01:00 동안 LCZ D, LCZ 2・4・6, LCZ Dw, 총 5 지점에서 측정 하였다 (Table 3). 자료를 통합하기 위해서 이틀 모두 측정한 LCZ D의 7월 19 - 20일 자료를 중심으로, 7월 20 - 21일 5 지점에서 측정된 미기후 자료를 비례식을 이용하여 보정하였다.
태양 및 지구복사에너지가 인체에 흡수되는 양을 나 타내는 평균복사온도 (mean radiant temperature)는 Eq. 1을 이용하여 계산하였다.
εσ
ε
℃ (Eq. 1 from Park 2011)
Table 2. Instruments for microclimatic data measurements Instrument
Data Name Accuracy Resolution Manufacture
Radiation CNR4 Net
Radiometer ≤ 1% (-40 - 80°C) 0.1 Wm-2 Kipp & Zonen lnc Air temp. and Relative
humidity HMP155A ∙ Air temp.: ±0.3°C (-80 - 60°C)
∙ Relative humidity: 2% (0 - 90%) 3% (90 - 100%)
0.01°C 0.01%
Campbell Scientific lnc Wind speed and direction Met one 034B-L
Windset
∙ Wind speed: ±0.1 ms-1 (≤ 10.1 ms-1)
±1.1% (≥ 10.1 ms-1)
∙ Wind direction: ± 4° 0.001 ms-1
Datalogger CR1000 ±0.06% (0 - 40°C)
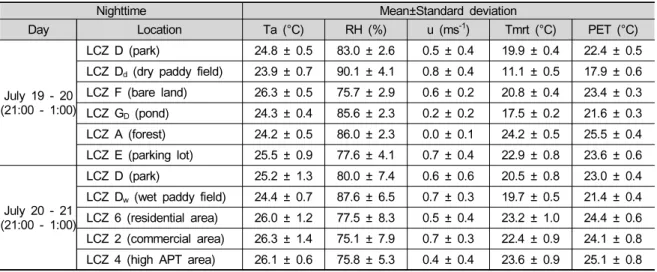
Table 3. Mean and standard deviation of the locations. Ta, RH, u, Tmrt and PET mean air temperature, relative humidity, wind speed, mean radiant temperature and physiological equivalent temperature, respectively
Nighttime Mean±Standard deviation
Day Location Ta (°C) RH (%) u (ms-1) Tmrt (°C) PET (°C)
July 19 - 20 (21:00 - 1:00)
LCZ D (park) 24.8 ± 0.5 83.0 ± 2.6 0.5 ± 0.4 19.9 ± 0.4 22.4 ± 0.5 LCZ Dd (dry paddy field) 23.9 ± 0.7 90.1 ± 4.1 0.8 ± 0.4 11.1 ± 0.5 17.9 ± 0.6 LCZ F (bare land) 26.3 ± 0.5 75.7 ± 2.9 0.6 ± 0.2 20.8 ± 0.4 23.4 ± 0.3 LCZ GD (pond) 24.3 ± 0.4 85.6 ± 2.3 0.2 ± 0.2 17.5 ± 0.2 21.6 ± 0.3 LCZ A (forest) 24.2 ± 0.5 86.0 ± 2.3 0.0 ± 0.1 24.2 ± 0.5 25.5 ± 0.4 LCZ E (parking lot) 25.5 ± 0.9 77.6 ± 4.1 0.7 ± 0.4 22.9 ± 0.8 23.6 ± 0.6
July 20 - 21 (21:00 - 1:00)
LCZ D (park) 25.2 ± 1.3 80.0 ± 7.4 0.6 ± 0.6 20.5 ± 0.8 23.0 ± 0.4 LCZ Dw (wet paddy field) 24.4 ± 0.7 87.6 ± 6.5 0.7 ± 0.3 19.7 ± 0.5 21.4 ± 0.4 LCZ 6 (residential area) 26.0 ± 1.2 77.5 ± 8.3 0.5 ± 0.4 23.2 ± 1.0 24.4 ± 0.6 LCZ 2 (commercial area) 26.3 ± 1.4 75.1 ± 7.9 0.7 ± 0.3 22.4 ± 0.9 24.1 ± 0.8 LCZ 4 (high APT area) 26.1 ± 0.6 75.8 ± 5.3 0.4 ± 0.4 23.6 ± 0.9 25.1 ± 0.8
여기서, fp는 태양직사광선이 도달하는 인체의 표면적 (projected area factor)을 뜻하며, Kb・Kd・Kr은 각각 태 양의 직사광선 분사광선 반사광선이다. L은 지구복사 에너지의 양, α는 인체의 태양복사에너지 반사율 (al-
bedo), ε는 인체에서의 지구복사에너지 방사율 (emis- sivity), σ는 Stefan-Boltzman 상수 (5.67・10-8 Wm-2 K-4) 이다 (Kong et al. 2018).
인간 열환경지수 (human thermal sensation)는 실측된 기온, 상대습도, 풍속, 평균복사온도 자료를 RayMan Pro. Ver. 2.2 (Matzarakis et al. 2010, http://www.
urbanclimate.net/rayman)에 텍스트 파일 (.txt)로 입력 하여, 전 세계적으로 옥외공간 열환경 분석에 가장 많 이 사용되고 있는 physiological equivalent temperature (PET; Höppe 1999)를 이용해 각 지점들을 비교 분석하 였다 (Table 4). PET는 키 180 cm, 몸무게 75 kg의 35세 남성이 0.9 clo의 의복 (긴 바지에 긴 셔츠)을 입고 80 W 의 가벼운 신체활동을 할 때 느끼게 되는 열환경지수를 기준으로 한다.
미기후 요소와 인간 열환경지수의 유의성 검정을 위 해 SPSS Version 20의 One-way ANOVA를 이용해 Post Hoc 다중비교 방법 중 Duncan 분석을 실시하였다.
Table 4. The levels of physiological equivalent tem- perature (PET) (Matzarakis et al. 1999)
Thermal
perception PET (℃) Grade of physiological stress Very cold < 4 Extreme cold stress
Cold 4 - 8 Strong cold stress Cool 8 - 13 Moderate cold stress Slightly cool 13 - 18 Slight cold stress
Neutral 18 - 23 No thermal stress Slightly warm 23 - 29 Slight heat stress Warm 29 - 35 Moderate heat stress
Hot 35 - 41 Strong heat stress Very hot > 41 Extreme heat stress
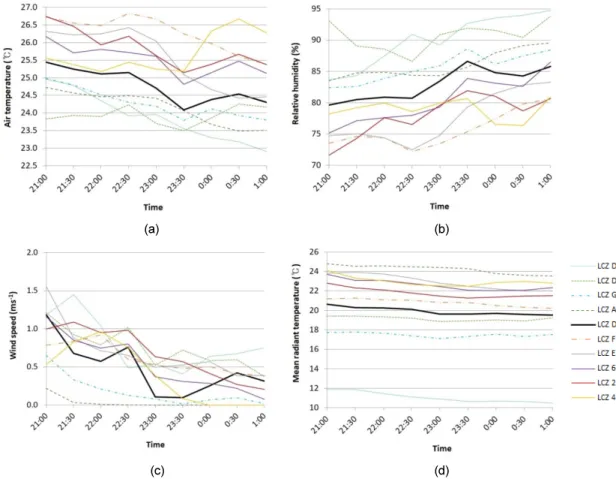
(a) (b)
(c) (d)
Fig. 2. Microclimatic factors of the locations in July 19 - 20, 2018: (a) Air temperature, (b) Relative humidity, (c) Wind speed, and (d) Mean radiant temperature.
3. 연구결과 및 고찰
3.1 미기후 요소
야간 (21:00 - 1:00)의 그린인프라 지역 LCZ D, LCZ Dd, LCZ Dw, LCZ GD, LCZ A 지점의 기온 (air tem- perature, Ta)은 그레이인프라 지역LCZ 2, LCZ 4, LCZ 6, LCZ E, LCZ F에 비해 평균 1.6°C 낮은 값을 보였다 (Fig. 2a and Table 5). 물을 대지 않은 논 (LCZ Dd)과 물 을 댄 논 (LCZ Dw)에서 평균 23.9°C로 조사지점 중 가 장 낮은 기온을 보였으며, 칠보초등학교 운동장 (LCZ F)은 평균 26.3°C로 가장 높은 기온을 나타냈다. 보통 인공구조물이 많은 상업지역 (LCZ 2)이나 고층아파트 (LCZ 4)에서 야간 도시열섬현상 (urban heat island)으 로 높은 기온을 나타내는 것으로 알려져 있지만, 이 연 구에서는 칠보초등학교 지점 (LCZ F)이 다른 조사지 점과 떨어져있으며 주변이 아파트와 빌라로 둘러싸여, 다른 그레이인프라 지역보다 평균 0.5 - 0.8°C 높은 기 온을 보이는 것으로 판단된다. 통계학적으로는 가장 낮 은 기온을 보인 두 논 (LCZ Dd, LCZ Dw)과 산림 (LCZ A), 수경공간 (LCZ GD) 사이에는 유의성이 없었으며, 가장 높은 기온을 보인 칠보초등학교 운동장 (LCZ F) 과 상업지역 (LCZ 2) 사이에도 유의성이 없었다 (Table 5).
특히, 그레이인프라 지역 중 시가화건조지역인 주택지 역 (LCZ 6), 주차장 (LCZ E), 고층아파트 (LCZ 4), 상 업지역 (LCZ 2) 사이에는 유의성이 없는 것으로 나타 나, 기온은 시가화건조지역에서 LCZ에 상관없이 유사 한 값을 보이는 것으로 나타났다.
상대습도 (relative humidity, RH)에서는 그린인프라 지역이 그레이인프라 지역보다 평균 9.0% 높게 나타났
으며, 칠보초등학교 운동장 (LCZ F)이 평균 75.7%로 조사지점 중 가장 낮았으며, 물을 댄 논 (LCZ Dw)이 90.7%로 가장 높은 값을 보였다(Fig. 2 (b) and Table 5). 이 결과는 상대습도는 기온과 연동되어 상반된 결과 를 보여주는 것이다. 통계학적으로는 가장 낮은 상대습 도를 보인 칠보초등학교 운동장 (LCZ F)과 주차장 (LCZ E), 상업지역 (LCZ 2)은 유의성이 없었으며, 상 대습도가 가장 높았던 물을 댄 논 (LCZ Dw)과 물을 대 지 않은 논 (LCZ Dd)도 유의성이 없었다. 또한 기온과 동일하게 그레이인프라 지역 중 시가화건조지역인 주택 지역 (LCZ 6), 주차장 (LCZ E), 고층아파트 (LCZ 4), 상 업지역 (LCZ 2) 사이에도 유의성이 없는 것으로 나타 났다. 기온과 동일하게 상대습도에서도 시가화건조지 역에서 LCZ에 따라 별 차이가 없는 것으로 나타났다.
야간의 풍속 (wind speed, u) 결과는 그린인프라 지 역 평균 0.4 ms-1, 그레이인프라 지역들이 평균 0.6 ms-1 으로 나타나, 예상했던 그레이인프라 지역에서 인공구 조물에 의한 풍속저감현상을 확인할 수 없었다(Fig. 2c and Table 5). 그러나 그린인프라 지역 중 평균 풍속 0.2 ms-1, 0.0 ms-1 였던 수경공간 (LCZ GD)과 산림 (LCZ A)을 제외한 나머지 3개의 지점의 평균 풍속은 0.7 ms-1 로 그레이인프라 지역들의 평균보다 조금 높았다. 각각 평균 풍속 0.8 ms-1, 0.7 ms-1인 논 지점 (LCZ Dd, LCZ Dw)과 평균 풍속 0.7 ms-1인 칠보초등학교 운동장 (LCZ F)과 상업지역 (LCZ 2)이 유사한 풍속을 나타냈 다. 이는 상업지역의 서북서 방향인 지역풍 풍향과 상 업지역 내 도로 방향이 유사하여 상업지구 평균 4층 높 이의 건물에 의한 풍속저감 현상이 적게 발생한 것으로 판단된다. 통계학적으로는 풍속이 가장 낮았던 산림 (LCZ A)과 수경공간 (LCZ GD)은 서로 유의성이 없었
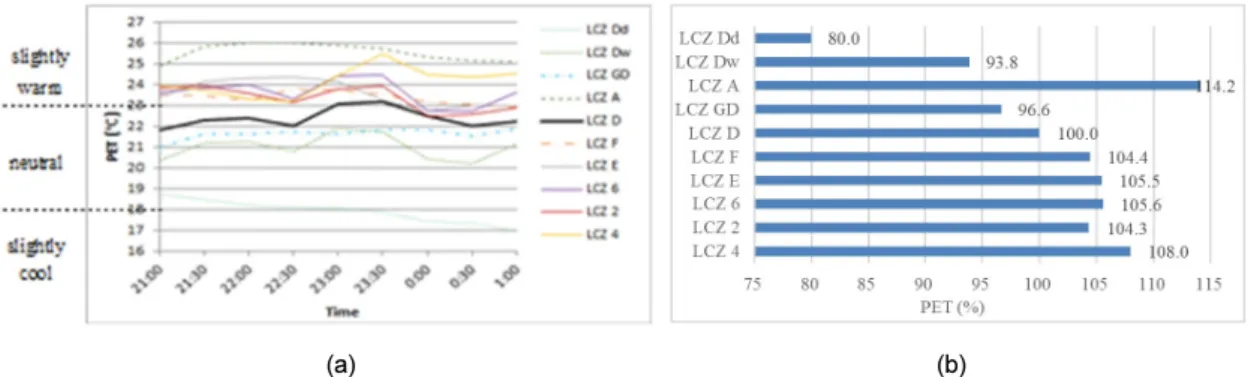
(a) (b)
Fig. 3. Human thermal sensation of the locations in July 19 - 20, 2018: (a) Physiological equivalent temperature (°C) and (b) PET difference between LCZ D and the other locations (%).
으며, 두 지점과 고층 아파트 (LCZ 4)를 제외한 나머지 지점들은 유의성이 없는 것으로 나타났다.
야간의 평균복사온도 (mean radiant temperature, Tmrt)는 태양복사에너지 (solar or shortwave radiation) 가 가장 큰 영향을 미치는 주간과는 다르게 지구복사에 너지 (terrestrial or longwave radiation)에 의해 결정된 다. 평균 18.4°C를 보인 그린인프라 지역에 비해 그레 이인프라 지역은 3.8°C 더 높은 평균 22.2°C를 나타내 었다(Fig. 2d and Table 5). 가장 낮은 평균복사온도를 보인 지점은 물을 대지 않은 논 (LCZ Dd)으로 평균 11.1°C로, 인접한 물을 댄 논 (LCZ Dw)의 평균 19.1°C 에 비해 8.0°C 낮았으며, 유사한 수경공간 (LCZ GD)의 평균 17.5°C에 비해서도 6.4°C 낮았고, 잔디밭 (LCZ D)의 평균 19.9°C에 비해서도 8.8°C 낮았다. 이는 유사 한 지역이더라도, 여름철 밤 시간대에는 물이나 잔디에 비해 나지의 표면온도가 더 빨리 낮아져 적은 지구복사 에너지를 방출하기 때문이라고 할 수 있다. 그레이인프
라 지역에서는 나지인 칠보초등학교 운동장 (LCZ F) 의 평균복사온도가 평균 20.8°C로 나타나, 다른 그레이 인프라 지역에 비해 1.0 - 2.2°C 낮은 결과를 보였다. 그 레이인프라 지역 중에서 고층아파트 (LCZ 4)와 주차장 (LCZ E)에서 각각 평균 23.0°C, 22.9°C를 보여 가장 높 은 평균복사온도를 나타냈다. 그러나 조사 지점 중 가 장 높은 평균복사온도를 보인 지점은 산림 (LCZ A)으 로 평균 24.2°C 였다. 산림지역은 주간에 가장 낮은 평 균복사온도를 나타내는데 이것은 도시의 다른 지역에 비해 교목 수관 (canopy)에 의해 태양복사에너지 차감 율이 높기 때문이다 (Kong et al. 2018). 야간에는 태양 복사에너지가 없으므로 지구복사에너지가 평균복사 온도의 주 결정인자가 되며, 하늘시계지수 (sky view factor, SVF)가 높을수록 지구복사에너지는 외부로 많 이 방출될 수 있다. 산림 (LCZ A)의 SVF는 0.226 (26.6%)으로 개방된 논 (SVF 0.998, 99.8%)에 비해 교 목 수관에 의해 닫힌 공간이므로 야간에는 다른 지점에
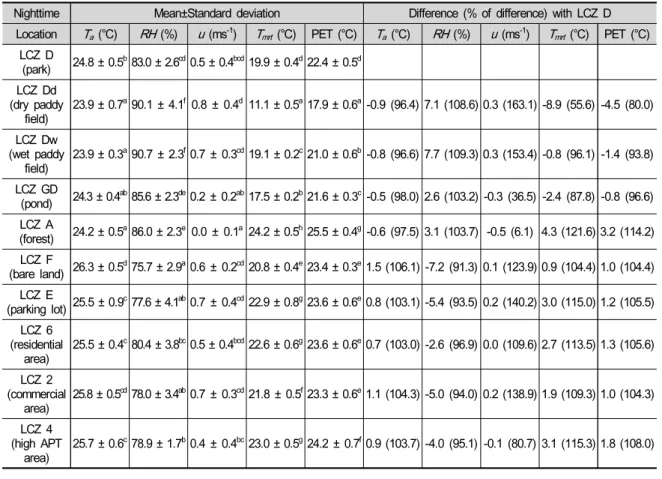
Table 5. Mean and standard deviation of the locations and their difference with LCZ D results. Ta, RH, u, Tmrt and PET mean air temperature, relative humidity, wind speed, mean radiant temperature and physiological equivalent temperature, respectively
Nighttime Mean±Standard deviation Difference (% of difference) with LCZ D Location Ta (℃) RH (%) u (ms-1) Tmrt (℃) PET (℃) Ta (℃) RH (%) u (ms-1) Tmrt (℃) PET (℃)
LCZ D
(park) 24.8 ± 0.5b83.0 ± 2.6cd0.5 ± 0.4bcd19.9 ± 0.4d22.4 ± 0.5d LCZ Dd
(dry paddy
field) 23.9 ± 0.7a90.1 ± 4.1f0.8 ± 0.4d 11.1 ± 0.5a17.9 ± 0.6a -0.9 (96.4) 7.1 (108.6) 0.3 (163.1) -8.9 (55.6) -4.5 (80.0) LCZ Dw
(wet paddy
field) 23.9 ± 0.3a90.7 ± 2.3f0.7 ± 0.3cd19.1 ± 0.2c21.0 ± 0.6b -0.8 (96.6) 7.7 (109.3) 0.3 (153.4) -0.8 (96.1) -1.4 (93.8) LCZ GD
(pond) 24.3 ± 0.4ab85.6 ± 2.3de0.2 ± 0.2ab17.5 ± 0.2b21.6 ± 0.3c-0.5 (98.0) 2.6 (103.2) -0.3 (36.5) -2.4 (87.8) -0.8 (96.6) LCZ A
(forest) 24.2 ± 0.5a86.0 ± 2.3e 0.0 ± 0.1a 24.2 ± 0.5h25.5 ± 0.4g -0.6 (97.5) 3.1 (103.7) -0.5 (6.1) 4.3 (121.6) 3.2 (114.2) LCZ F
(bare land) 26.3 ± 0.5d75.7 ± 2.9a0.6 ± 0.2cd20.8 ± 0.4e23.4 ± 0.3e1.5 (106.1) -7.2 (91.3) 0.1 (123.9) 0.9 (104.4) 1.0 (104.4) LCZ E
(parking lot) 25.5 ± 0.9c77.6 ± 4.1ab0.7 ± 0.4cd22.9 ± 0.8g23.6 ± 0.6e0.8 (103.1) -5.4 (93.5) 0.2 (140.2) 3.0 (115.0) 1.2 (105.5) LCZ 6
(residential
area) 25.5 ± 0.4c80.4 ± 3.8bc0.5 ± 0.4bcd22.6 ± 0.6g23.6 ± 0.6e0.7 (103.0) -2.6 (96.9) 0.0 (109.6) 2.7 (113.5) 1.3 (105.6) LCZ 2
(commercial
area) 25.8 ± 0.5cd78.0 ± 3.4ab0.7 ± 0.3cd21.8 ± 0.5f23.3 ± 0.6e1.1 (104.3) -5.0 (94.0) 0.2 (138.9) 1.9 (109.3) 1.0 (104.3) LCZ 4
(high APT
area) 25.7 ± 0.6c78.9 ± 1.7b0.4 ± 0.4bc23.0 ± 0.5g24.2 ± 0.7f0.9 (103.7) -4.0 (95.1) -0.1 (80.7) 3.1 (115.3) 1.8 (108.0)
비해 높은 지구복사에너지가 축적되어 평균복사온도 를 높이는 결과를 나타낸다 (Table 1). 산림 (LCZ A)을 제외한 그린인프라 지역의 평균복사온도 (평균 16.7°C)는 그레이인프라 지역 (평균 22.2°C)과 5.5°C의 평균 차이를 보였다. 통계학적으로 주택지역 (LCZ 6), 주차장 (LCZ E), 고층아파트 (LCZ 4)는 서로 유의성이 없었으나, 나머지 지점들은 서로 유의성이 있는 것으로 나타나, 지점별로 다양한 복사열 환경을 가지는 것으로 보인다.
3.2 인간 열환경지수
PET에서 LCZ Dd는 평균 17.9°C로 ‘약간 서늘함 (slightly cool)’의 열지각 단계 (thermal perception level)로 가장 낮은 결과를 보였으며, 산림 (LCZ A)을 제외한 다른 그린인프라 지역인 물을 댄 논 (LCZ Dw), 공원 (LCZ D), 수경공간 (LCZ GD)에서 평균 21.0 - 22.4°C로 ‘중립 (neutral)’ 단계로 나타났다 (Fig. 3 (a)).
그레이인프라 지역인 칠보초등학교 운동장 (LCZ F), 주차장 (LCZ E), 주택지역 (LCZ 6), 상업지역 (LCZ 2), 고층아파트 (LCZ 4)는 평균 23.3 - 24.2°C로 지점별 결과가 유사하였으며 ‘약간 따뜻함 (slightly warm)’의 열지각 단계를 보여, 그린인프라 지역에 비해서는 평균 1.9°C도 높았다. 이것은 그린인프라 지역이 그레이인 프라 지역보다 여름철 야간 (21:00 - 1:00)에 1/3 단계의 인간 열환경 개선효과가 있다는 것을 보여준다.
평균복사온도에서와 동일하게 산림 (LCZ A)이 평 균 25.5°C로 가장 높은 PET 결과를 나타냈는데, 그레 이인프라 지역보다 평균 1.3 - 2.2°C 높았다. 산림이 밤 시간대 가장 높은 인간 열환경지수를 보이는 것은 낮은 SVF의 영향으로 지구복사에너지가 높아지고 줄어든 풍속의 영향으로 현열 (sensible heat flux density)의 손 실이 적어졌기 때문이다. 이와 같은 결과는 Müller et al. (2014)의 연구에서도 확인할 수 있다.
산림을 제외한 그린인프라 지역의 평균 PET는 20.4°C 로, 그레이인프라 지역의 평균 PET에 비해 3.2°C 낮았 으며 1/2 단계의 인간 열환경지수 저감효과를 보였다.
잔디밭 (LCZ D)을 기준으로 각 지점의 인간 열환경 지수 PET 값을 비교한 결과, 물을 대지 않은 논 지점 (LCZ Dd)이 평균 20.0%의 최대 저감 효과를 나타냈으 며, 그레이인프라 지역들은 평균 4.4 - 8.0% 더 높았다 (Table 4 and Fig. 3 (b)). 주간에 인간 열환경 개선에 가
장 효과적인 역할을 하는 산림 (LCZ A)은 잔디밭 (LCZ D) 대비 평균 3.2% 높아 야간에는 열환경 개선에 효과 적이지 않았다.
통계학적으로는 그레이인프라 지역인 상업지역 (LCZ 2), 칠보초등학교 운동장 (LCZ F), 주차장 (LCZ E), 주 택지역 (LCZ 6)에서 서로 유의성이 없었으며, 다른 지 점들은 서로 유의성이 있는 것으로 나타났다. 이것은 그린인프라 지역에서는 토지이용유형과 LCZ에 따라 다른 열환경이 조성되는 것을 나타내며, 그레이인프라 지역에서는 고층아파트 (LCZ 4)가 다른 지점에 비해 더 높은 열환경을 보이는 것으로 나타났다.
3.3 기존 연구와의 비교
Hungary에서는 여름철 밤 시간대 (일몰 후 2시간 동 안), LCZ 2 (compact mid-rise)와 LCZ 3 (compact low-rise)의 PET가 가장 높았으며, LCZ D (low plants) 에 비해 평균 3.6°C 높은 결과를 보였다 (Unger et al.
2018). 본 연구에서는 LCZ 2보다는 LCZ 4 (open high-rise)에서 더 높은 PET 결과를 나타냈으며, LCZ 2 와 LCZ D의 차이는 평균 0.9°C로 Unger et al. (2018) 의 결과에 비해 차이가 적었다. 이는 Unger et al. (2018) 의 LCZ D는 도시 안이 아니라 도시 외곽 지역 (rural area)에 위치하였고, 태양복사에너지의 영향이 사라지 고 LCZ에 의한 지구복사에너지양이 가장 차이가 크게 나는 일몰 후 2시간으로만 분석하였기 때문이다. Serbia 에서는 여름철 밤 시간대 (19:00 - 3:00)에 LCZ 2가 가 장 높은 PET 결과를 보였으며, LCZ D와 LCZ A (dense trees)와 비교하여 각각 6.4°C, 6.9°C 높은 결과를 나타 냈다 (Milošević et al. 2016). 본 연구에서는 LCZ 2가 LCZ D에 비해서 0.9°C 높았으나 LCZ A보다는 2.2°C 낮아, LCZ D가 상대적으로 열저감 효과가 적었고 LCZ A에서는 정반대의 현상을 나타냈다. 이는 Milošević et al. (2016) 연구의 LCZ D와 LCZ A 지점은 도시 외곽 지역에 위치해 있어 도시 안에 위치한 본 연구 결과보다 는 더 큰 차이를 보인 것으로 판단된다. 위의 두 연구 모 두 고층건물이 있는 LCZ 1 (compact high-rise)과 LCZ 4 (open high-rise)는 없었으며, 본 연구에 비해서는 밤 시간대의 PET값이 낮았다.
Hungary의 2001 - 2010년 연평균 PET를 조사한 결 과, 가장 높게 나온 LCZ 2와 가장 낮게 나온 LCZ 6A
(open low-rise with dense trees)의 차이는 평균 3°C 였
다 (Kovács and Németh 2012). Kwok et al. (2019)의 France에서의 연구는 여름철 6 - 9월 새벽 (3:00 - 6:00) 에 LCZ 1, 2, 3이 LCZ A, D보다 각각 기온에서 2.58°C, 2.82°C 높았으며, 평균복사온도에서 9.1°C, 9.81°C 높 았다. 또한 모든 LCZ의 기온과 평균복사온도는 도시 중심부에서 거리가 멀어질수록 낮아지는 경향을 보였 다. 본 연구에서 LCZ 2와 LCZ A, D의 기온 차는 각각 1.6°C, 1.0°C로 Kwok et al. (2019)의 연구결과와 비교 해 차이가 적었다. 평균복사온도에서는 LCZ 2가 LCZ D에 비해서 1.9°C 높았으나 LCZ A에 비해서 반대로 2.4°C 낮은 값을 보였다. Kwok et al. (2019)의 연구는 컴퓨터 시뮬레이션 결과이므로, 실제 측정된 자료와는 차이가 존재하지만, 본 연구에 비해서는 더 큰 차이를 보이는 것으로 나타났다.
기존 연구의 LCZ A와 D의 지점은 도시열섬연구를 위해 도시 외곽에 위치한 지점을 선정함으로서, 도시지 역 내 열환경이 높았던 LCZ 2나 LCZ 4와의 차이가 더 크게 난 것으로 생각되며, 산림지역인 LCZ A에 대한 본 연구의 결과는 기존의 연구결과와 반대의 결과를 보 이므로, 도시 안에 위치한 LCZ A에 대한 앞으로의 비 교연구결과를 지켜보아야 할 것이다.
4. 결 론
도시의 여름철 야간 열환경을 알아보기 위해, 토지피 복 대분류에 따라 10개의 도시기후지역 (local climate zone, LCZ) 에서 미기후 자료를 측정하여 인간 열환경 지수를 분석하여 보았다. 미기후 실측은 상업지역 (LCZ 2), 고층아파트 (LCZ 4), 주택지역 (LCZ 6), 주차 장 (LCZ E) 등 4개의 시가화건조지역, 물을 대지 않은 논 (LCZ Dd), 물을 댄 논 (LCZ Dw) 등 2개의 농업지역, 산림 (LCZ A), 공원 잔디밭 (LCZ D), 나지 (LCZ F), 수 경공간 (LCZ GD)으로 총 10개 지점에서 이루어졌다.
미기후 요소 비교 분석 결과, 그린인프라 지역 (LCZ D, LCZ Dd, LCZ Dw, LCZ GD, LCZ A)이 그레이인프라 지역 (LCZ 2, LCZ 4, LCZ 6, LCZ E, LCZ F)보다 기온 은 평균 1.6°C 최대 2.4°C 낮았으며, 상대습도는 반대 로 그린인프라 지역이 평균 9.0% 최대 15.0% 높았다.
통계학적으로는 그레이인프라 지역인 4개의 시가화 건 조지역 (LCZ 2, LCZ 4, LCZ 6, LCZ E)의 기온과 상대 습도는 유의성이 없는 것으로 나타나 유사한 결과를 보
이는 것으로 나타났다. 풍속에서는 그린인프라 지역과 그레이인프라 지역에서 차이가 거의 없었으며, 수목의 영향으로 가장 낮은 풍속을 보인 산림 (LCZ A)을 제외 하고는 모든 지점에서 유의성이 없는 것으로 나타나, 건물이나 수목의 높이에 의해 결정되는 표면거칠기 뿐 만 아니라 지역풍의 풍향과 가로 (도로)의 방향이 풍속 을 결정하는 주 요인인 것으로 보인다. 평균복사온도에 서는 수목의 영향으로 산림 (LCZ A)이 가장 높은 값을 보였으며, 산림을 제외하면 그린인프라 지역이 그레이 인프라 지역에 비해 평균 5.5°C의 저감 효과를 보였다.
평균복사온도를 결정하는 주 요인은 하늘시계지수 (sky view factor)이었으며, 유사한 하늘시계지수인 경 우에는 포장재료의 영향을 많이 받는 것으로 나타났다.
시가화건조지역인 주택지역 (LCZ 6), 주차장 (LCZ E), 고층아파트 (LCZ 4)는 유의성이 없는 것으로 나타나 야간에 유사한 복사열 환경을 가지는 것으로 나타났다.
인간 열환경지수인 PET 분석에서 그린인프라 지역 은 거의 덥지도 춥지도 않는 ‘중립 (neutral)’의 열지각 단계를 나타내었으며, 그레이인프라 지역은 한 단계 높 은 ‘약간 따뜻함 (slightly warm)’의 단계를 나타냈다.
가장 높은 PET 결과를 나타낸 산림 (LCZ A)을 제외하 면, 그린인프라 지역이 그레이인프라 지역에 비해 3.2°C 저감 효과를 보여 야간에도 1/2 단계의 인간 열환 경 개선 효과가 있는 것으로 나타났다.
Kong et al. (2018)의 연구에서 나타난 여름철 주간 (12:00 - 16:00)에 그린인프라 지역의 그레이인프라 지 역 대비 1 - 2 단계의 열환경 개선 효과에 비해 야간 (21:00 - 1:00)의 열환경 개선 효과는 약하다고 할 수 있 다. 그러나 혹서기에는 열환경 개선 효과가 더 클 것으 로 예상되며, 중장기적 모니터링과 자료 수집이 이루어 진다면 향후 도시계획과 환경보전계획 수립 시 도시에 필요한 열환경 개선 계획에 도움이 될 것이다. 또한, 그 동안 단일 기후요소인 기온에 의존했던 열환경 분석이 아닌 인간 에너지 균형 모델 (human energy balance model)에 필요한 기온, 습도, 풍속, 태양 및 지구복사에 너지를 포함한 인간 열환경지수를 이용한다면, 도시 열 환경에 대한 좀더 정밀한 자료축적이 가능할 뿐만 아니 라 정책 수요자들이 체감할 수 있는 관련 정책수립에 도 움이 될 것으로 판단된다.
감사의 글
본 연구는 국립환경과학원 조사연구사업 ‘국토환경 연동제 지원을 위한 그린인프라 적용 연구 (I) (NIER- 2018-01-01-049)와 2020학년도 제주대학교 교원성과 지원사업에 의하여 연구되었습니다.
미기후 조사를 도와주신 박성애, 박성민, 이수용, 현 철지, 이경지, 문성준, 조상만, 임유정, 임현우, 이범수, 신지환님께 감사드립니다.
References
Arnfield, A.J. 2003. Two decades of urban climate research:
a review of turbulence, exchanges of energy and water, and the urban heat island. International Journal of Cli- matology 23(1): 1-26.
Bowler, D.E., Buyung-Ali, L., Knight, T.M., and Pulin, A.S. 2010. Urban greening to cool towns and cities: a systematic review of the empirical evidence, Landscape Urban Plan 97: 147-155.
Cha, J., Jung, E., Ryu, J., and Kim, D. 2007. Constructing a green network and wind corridor to alleviate the urban heat-island. Journal of the Korean Association of Geo- graphic Information Studies 10(1): 102-112. (in Korean) Demuzere, M., Orru, K., Heidrich, O., Olazabal, E., Ge- neletti, D., Orru, H., Bhave, A.G., Mittal, N., Feliu, E., and Faehnle, M. 2014. Mitigating and adapting to climate change: Multi-functional and multi-scale assessment of green urban infrastructure. Journal of Environmental Management 146: 107-115.
Dimoudi, A. and Nikolopoulou, M. 2003. Vegetation in the urban environment: micro-climatic analysis and benefits. Building and Environment 35: 69-76.
European Commission. 2013. Building a Green Infra- structure for Europe, http://ec.europa.eu/environment/
nature/ecosystems/docs/greeninfrastructurebroc.pdf.
Gill, S.E., Handley, J.F., Ennos, A.R., and Psuleat, S.
2007. Adapting cities for climate changes: the role of the green infrastructure. Building and Environment 33:
115-33.
Han, S. 2006. The effect of the restored Choenggye stream on heat island intensity and building cooling load in the surrounding area. Master thesis, University of Seoul. (in Korean)
Hong, J., Hong, J., Lee, S., and Lee, J. 2013. Spatial distribution of urban heat island based on local climate zone of automatic weather station in Seoul metropolitan area. Atmosphere 23(4): 413-424. (in Korean) Höppe, P.R. 1999. The physiological equivalent tem-
perature-a universal index for the biometeorological
assessment of the thermal environment. International Journal of Biometeorology 43: 71-75.
IPCC. 2013. Climate Change 2013: The Physical Science Basis. WMO, 7bis, Avenue de la Paix, 1211 Geneva2.
Jo, H.K. and Ahn, T.W. 1999. Function of microclimate amelioration by urban greenspace, Journal of the Korean Institute of Landscape Architecture 27(4): 23-28. (in Korean)
Kim, K. and Eum, J. 2017. Classification of local climate zone by using WUDAPT Protocol-A case study of Seoul, Korea. Journal of the Korean Institute of Landscape Architecture 45(4): 131-142. (in Korean)
Klimn, W., Heusinkveld, B.G., Lenzholzer, S., Jacobs, M.H., and van Hove, B. 2015. Psychological and physical impact of urban green spaces on outdoor thermal com- port during summertime in the Netherlands. Building Environment 83: 120-128.
Kong, H., Choi, N., Park, S., Lee, J., and Park, S. 2018.
A study on human thermal comfort of residential development districts in summer season. Ecology and Resilient Infrastructure 5(4): 219-228. (in Korean) Kovács, A. and Németh, Á. 2012. Tendencies and differences
in human thermal comfort in district urban areas in Budapest, Hungary. Universitatis Szegediensis, Tomus 46: 115-124.
Kwok, Y.T., Schoetter, R., Lau, K., Hidalgo, J., Ren, C., Pigeon, G., and Masson, V. 2019. How well does the local climate zone scheme discern the thermal environment of Toulouse (France)? An analysis using numerical simulation data. International Journal of Climatology 39(14): 5292-5315.
Lafortezza, R., Davies, C., Sanesi, G., and Konijnendijk, C.C. 2013. Green Infrastructure as a tool to support spatial planning in European urban regions, iForest Biogeosci. For. 6(7): 102.
Lau, K.K., Chung, S.C., and Ren, C. 2019. Outdoor thermal comfort in different urban settings of sub-tropical high- density cities: An approach of adopting local climate zone (LCZ) classification.
Building and Environment 154: 227-238.
Lyu, T., Buccolieri, R., and Gao, Z. 2019. A numerical study on the correlation between sky view factor and summer microclimate of local climate zones. Atmosphere 10(8). 438, doi: 10.3390/atmos10080438.
Matzarakis, A., Mayer, H., and Iziomon, M.G. 1999.
Applications of a universal thermal index: physiological equivalent temperature. International Journal of Biome- teorology 43: 76-84.
Matzarakis, A., Rutz, F., and Mayer, H. 2010. Modelling radiation fluxes in simple and complex environments:
basics of the RayMan Model. International Journal of Biometeorology 54(2): 131-139.
Mell, I.C. 2008. “Green infrastructure: Concepts and
planning.” FORUM: Int. J. Postgraduate Stud. Archit.
Plann. Landscape 8(1): 69-80.
Milošević, D.D., Savić, S.M., Marković, V., Arsenović, D., and Šećerov, I. 2016. Outdoor human thermal comfort in local climate zones of Novi Sad (Serbia) during heat wave period. Hungarian Geographical Bulletin 65(2): 129-137.
Müller, N., Kuttler, W., and Barlag, A. 2014. Counteracting urban climate change: adaptation measures and their effect on thermal comfort. Theoretical and Applied Cli- matology 115: 243-257.
Norton, B.A., Coutts, A.M., Livesley, S.J., Harris, R.J., Hunter, A.M., and Williams N.S.C. 2015. Planning for cooler cities: A Framework to prioritise green infra- structure to mitigate high temperatures in urban landscapes.
Landscape and Urban Planning 134: 127-138.
Oke, T.R. 1973. City size and the urban heat island.
Atmospheric Environment 7(8): 769-779.
Ottelé, M., Perini, K., Fraaij, A.L.A., Haas, E.M., and Raiteri, R. 2011. Comparative life cycle analysis for green facades and living wall systems. Energy and Buildings 43(12): 3419-3429.
Park, K. and Jung, S. 1999. Analysis on urban heat island effects for the metropolitan green space planning. Journal of the Korean Association of Geographic Information Studies 2(3): 35-45. (in Korean)
Park, S. 2011. Human-Urban Radiation Exchange Simulation Model. PhD dissertation, University of Victoria, Victoria, B.C., Canada.
Song, Y. 2002. Influence of new town development on the urban heat islands-in the case of Pan-Gyo area and
Bun-Dang new town. Journal of the Korean Institute of Landscape Architecture 30(4): 37-46. (in Korean) Stewart, I.D. and Oke, T.R. 2012. ‘Local climate zones’
for urban temperature studies. Bulletin of the American Meteorological Society 93: 1879-1900.
Stewart, I.D., Oke, T.R., and Krayenhoff, E.S. 2014.
Evaluation of the “local climate zone” scheme using temperature observations and model simulations. Inter- national Journal of Climatology 34(4): 1062-1080.
Tzoulas, K., Korpela, K., Venn, S., Yli-Pelkonen, V., Kazmierczak, A., Niemela, J., and James, P. 2007. Pro- moting ecosystem and human health in urban areas using Green Infrastructure: A literature review. Landscape and urban planning 81(3): 167-178.
Unger, J., Skarbit, N., and Gál, T. 2018. Evaluation of outdoor human thermal sensation of local climate zones based on long-term database. International Journal of Biometeorology 62(2): 183-193.
Villadiego, K. and Velay-Dabat, M.A. 2014. Outdoor thermal comfort in a hot and humid climate of Co- lumbia: A field study in Barranquilla. Building and Environment 75: 142-152.
Yeo, I., Yee, J., and Yoon, S. 2009. Analysis on the effects of building coverage ratio and floor space index on urban climate. Journal of the Korean Solar Energy Society 29(3): 19-27. (in Korean)
Yi, C., Eum, J., Choi, Y., Kim, K., Scherer, C., Feherenbach, U., and Kim, G. 2011. Development of climate analysis Seoul (CAS) maps based on landuse and meteorological Model. Journal of the Korean Association of Geographic Information Studies 14(1): 12-25. (in Korean)