서 론
식습관은 인간이 이유기부터 다양한 식품들과 접하면서 형성되는 것으로 음식에 대한 선호도와 태도 등 식생활과 관 련된 모든 습관을 의미한다(Kim BR & Kim YM 2005). 대학 생 시기는 청소년기에서 성인기로 전환되는 과도기적 연령으 로 식습관이 완성되는 시기이기도 하다. 대학시기에 잘못된 식습관은 성인기의 식습관으로 이어지게 되고, 중년기 이후의 다양한 건강상의 위해요소로 작용할 수 있다(Han MJ & Cho HA 1998). 한 번 형성된 식습관은 나이가 들수록 변화시키 기 어려워 대학시기의 영양섭취의 중요성 인식과 건강과 관 련된 영양지식의 함양은 올바른 식습관 태도로의 개선 및 완
성을 위해 필수적이라 할 수 있다(Lee YM & Han MS 1996).
대학생을 대상으로 한 선행연구 결과, 식습관 형성의 중요 성에 대한 인식도는 매우 낮은 것으로 보고되었다(Lee KA 1999; Lee MS & Kwak CS 2006). 특히 여대생들은 마른 체 형에 대한 선호도가 높아 무리한 체중조절을 시도하여 섭식 장애와 같은 나쁜 식습관을 형성하고 있었다(Magarey AM 등 2003). 또한 대학생들은 중․고등학교시절 생활패턴과는 달리 부모의 통제로부터 자유로우며, 학교수업시간도 일정 하지 않아 매우 불규칙한 생활양식을 가질 수 있다. 실제 대 학생들을 대상으로 식생활태도를 조사한 결과, 불규칙한 식 사패턴, 아침결식, 잦은 외식 및 간식의 섭취, 패스트푸드와 인스턴트식품 위주의 식습관을 나타냈다(Shin AS & Roh SB 2000; Jin YH & You KH 2010). 대학생의 패스트푸드 이용 률에 관한 연구 결과, 약 72%였으며 주된 식품으로는 과자
평택 일부지역 대학생의 영양지식 수준과 식습관에 관한 연구
안 서 현1․김 성 영2†
1경기대학교 교육대학원 영양교육전공 석사졸업, 2경기대학교 교육대학원 영양교육전공 조교수
Nutrition Knowledge and Eating Behaviors among College Students in the Pyeongtaek Area
Seo Hyeon Ahn1 and Seong Yeong Kim2†
1Master, Nutrition Education, Graduate School of Education, Kyonggi University, Suwon 16227, Republic of Korea
2Assistant Professor, Nutrition Education, Graduate School of Education, Kyonggi University, Suwon 16227, Republic of Korea
ABSTRACT
This study investigated nutrition knowledge and eating behaviors according to demographic factors among college students [n=306] in the Pyeongtaek area. Nutrition knowledge scores for carbohydrates (p<0.05) and lipids (p<0.01) as well as for obesity and diabetes (p<0.01) and cancer (p<0.01) were higher in female students than in male students. On the other hand, the nutrition knowledge score for vitamin E was higher in female students than in male students (p<0.05). First-year students scored generally higher than second-year students for total nutrition knowledge related to vitamins and minerals (p<0.05) as well as knowledge related to the prevention of disease such as cardiovascular disease and osteoporosis (p<0.05). Nutrition knowledge by major field of study was generally higher for science and technology than for physical arts and others, particularly knowledge related to obesity and diabetes (p<0.001) and osteoporosis (p<0.05). Good and bad eating behavior scores were higher in males and first-year students than in females and second-year students. The obese student group had a significantly high score for eating soup (p<0.05), whereas the normal group had significantly high scores for frequent eating out (p<0.01) and bad eating behaviors (p<0.05). Overall, female students had a higher nutrition knowledge score than that of male students. First-year students had a higher nutrition knowledge score than that of second-year students. But, female students had a lower good eating behavior score than that of male students, and first-year students had a higher score for both good and bad eating behaviors.
These results show that nutrition knowledge of college students by gender or college year was not associated with good eating behaviors. Therefore, practical nutrition education plans to promote good eating behaviors of college students are needed. Never- theless, development of plans for improving nutrition knowledge should consider the demographic characteristics of the students.
Key words: nutrition knowledge, eating behavior, college student, gender, first-year
†Corresponding author : Seong Yeong Kim, Tel: +82-31-249-9295, Fax: +82-31-249-9036, E-mail: [email protected]
류, 사탕류, 탄산음료류, 아이스크림류, 커피 등과 같은 고열 량식품들이었다(Kim KW 등 2004). 대학생의 편의식품 이용 률을 조사한 결과에서도 주요한 식품은 컵라면, 냉동식품, 봉지라면, 김밥류와 같은 인스턴트식품들로 나타났다(Kim KH 2003). 이들 식품들은 당류 및 지방이 다량 함유된 고열 량식품들로 과잉섭취 시 비만을 쉽게 유발시킬 가능성이 높 으며, 과량의 나트륨섭취로 심혈관계질환 등을 비롯해 다양 한 만성질환의 위험성을 높일 수 있다(Park SS 등 2008; Lee KA 등 2010). 전 세계적으로 현대인들의 주요 사망원인은 고혈압, 동맥경화, 심근경색과 같은 심혈관계질환 및 암과 같은 만성질환으로 보고되었으며(Yach D 등 2004), 이들 질 환은 식습관과 매우 밀접한 관련이 있는 것으로 알려져 있다 (Malik VS 등 2010; Koning L 등 2012).
대학생의 영양지식은 식습관 형성과 관련이 있는 것으로 보고되었다(Song YS 1986). 영양교육의 유무에 따른 영양지 식 및 식습관태도를 조사한 결과, 영양교육을 받은 학생이 받지 않은 학생에 비해 영양지식과 더불어 영양섭취에 대한 태도도 우수한 것으로 나타났다(Lewis M 등 1988). 전공에 따른 식생활 태도에 대한 선행연구 결과에서도 식품영양을 전공한 여대생은 영양에 대한 교육을 받았기 때문에 높은 영 양지식을 형성했고, 이 영양지식은 바람직한 식태도 및 식행 동을 형성하는 데 영향을 주었다(Choi MS & Choi DJ 1999).
외국의 사례들에서도 살펴보면 아이슬란드의 연구 결과에서 는 높은 영양지식이 채소류나 과일류의 섭취빈도에 긍정적 인 영향을 주었으며, 미국의 청소년을 대상으로 한 영양지식 수준과 식습관과의 상관성을 조사한 연구 결과에서는 나이 가 많을수록 영양지식 수준과 식습관과의 상관성이 높았다.
이 결과는 식품구성 성분들에 대한 인식도 Chung EJ및 영양 지식이 올바른 식품의 선택 및 섭취에 긍정적인 영향을 준 것으로 판단하였다(Pirouznia M 2001). 그러나 지금까지 청 소년 및 대학생들을 대상으로 한 영양지식의 조사(Kim KH 2003; Kim KW 등 2004; Gower JR 등 2010; Grosso G 등 2012)는 주로 영양소에 대한 지식만으로 이루어져 왔으며, 영양섭취와 다양한 만성질환 유발과 관련된 영양지식평가 연구는 미비한 상황이다.
따라서 본 연구에서는 평택 일부지역의 대학생을 대상으 로 일반사항(성별, 학년, BMI 및 전공계열)을 조사한 후, 일 반사항에 따른 영양소 관련 지식뿐만 아니라, 만성질환 예방 을 위한 영양지식에 대한 조사도 실시하였다. 더불어 대학생 들의 좋은 식습관과 나쁜 식습관에 대한 일반적인 평가를 함 께 실시하였다. 본 연구 결과는 대학생들의 영양지식 함양을 통해 식습관 개선을 유도하기 위한 영양교육 자료로 유용할 것으로 판단된다.
연구방법
1. 연구 대상
연구 대상은 경기도 평택지역 대학교에 재학 중인 350명 의 대학생들을 대상으로 조사하였다. 연구에 참여한 학생들 을 대상으로 설문지 내용 및 연구과정에 대해 충분히 설명한 다음 자발적으로 본 연구조사에 참여하게 했다.
2. 연구 방법 및 내용
본 연구는 설문지법을 이용하여 자기기입식으로 조사하였 다. 설문지 문항은 본 연구와 관련된 선행연구들(Kwon YJ 2009; Jo HJ 2011)을 참조하여 본 연구의 목적에 맞게 다시 작성하였다. 설문지 응답자 350명 중 응답이 불충분한 44부 를 제외한 후 총 306부를 본 연구 분석에 사용하였다. 설문지 의 구성은 일반사항, 영양소 및 만성질환예방 관련 영양지식, 식습관으로 구성하여 조사하였다. 세부항목은 다음과 같다.
일반사항은 성별, 학년, 신장과 체중 및 전공계열에 대해 각 1문항씩으로 총 4문항이었다. 조사한 신장과 체중으로 BMI(body mass index, kg/m2)를 산출하였다. 판단기준은 대 한비만학회 기준으로 저체중(<18.5), 정상체중(18.5∼22.99), 과체중(23∼25) 및 비만(>25)으로 분류하였다(Moon JS 등 2008).
영양지식은 물 관련 2문항, 탄수화물 관련 3문항, 단백질 관련 3문항, 지질 관련 4문항, 비타민과 무기질 관련 7문항, 식이섬유소 관련 2문항, 비만과 당뇨 관련 4문항, 암 관련 3 문항, 심혈관계질환 관련 4문항, 골다공증 관련 2문항으로 총 35문항으로 구성하였다. 각 문항에 대해 ‘정답’은 1점,
‘오답’은 0점으로 계산하여 분석하였다.
식습관은 좋은 식습관 5문항과 나쁜 식습관 5문항으로 구 성하였다. 좋은 식습관과 나쁜 식습관에 대한 문항들의 선정 은 한국인들이 가지고 있는 식습관 중 주요한 문제점들에 대 한 분석과 일반적으로 제안되고 있는 좋은 식습관들의 문항 들로 선정하였다(Han MJ & Cho HA 1998; Yon MY &
Hyun TS 2008; Choi KS 등 2009). 각 문항에 대해 ‘동의하지 않는다’는 1점, ‘동의한다’는 2점으로 계산하여 분석하였다.
1점보다 점수가 높을수록 ‘동의한다’의 경향이 높아지는 것 으로 분석하였다.
3. 자료 분석
성별 및 학년에 따른 영양소 및 만성질환 예방을 위한 영 양지식과 식습관 점수의 차이는 평균과 표준편차를 각각 구 한 후, 두 그룹 간의 차이를 t-검정(t-test)으로 분석하였다.
BMI와 전공계열에 따른 영양지식과 식습관 점수의 차이는 평균과 표준편차를 각각 구한 후, 일원 분산분석(One way
간의 차이를 검증하였다. 본 연구의 자료 분석은 IBM SPSS (Statistics Package for Social Science, IBM Corp., Armonk, NY, USA) 프로그램 윈도우 버전 20.0을 사용하였으며, 유의 수준 p<0.05에서 유의적인 차이를 검증하였다.
결과 및 고찰
1. 일반 사항
연구 대상자의 성별은 남학생 202명(66.0%), 여학생 104 명(34.0%)이었다(Table 1). 학년은 1학년 248명이었으며, 2학 년은 58명이었다. BMI는 정상군이 63.4%로 가장 많았으며, 과체중군(16.3%), 비만군(11.8%), 저체중군(8.5%) 순이었다.
전공계열은 인문사회계열(37.9%)과 자연공학계열(38.9%)이 비슷한 수준이었고, 예체능 및 기타 계열이 23.2%였다.
2. 영양지식
성별과 학년에 따른 영양지식 수준의 차이를 분석한 결과 는 Table 2에 제시하였다. 전체문항에 대한 총점은 유의적인 차이가 없었으나 탄수화물 관련 지식 중 ‘탄수화물과 지질은 1 g 당 같은 열량을 가지고 있다’라는 문항에서 여학생(0.41 점)이 남학생(0.28점)보다 점수가 높았다(p<0.05). 지질 관련 지식 중 ‘과도한 식물성유의 섭취와 심혈관계질환 유도와는 전혀 상관이 없다’라는 문항에서도 여학생(0.67점)이 남학생 (0.50점)보다 점수가 높았다(p<0.01). 반면, 남학생(0.77점)은 여학생(0.64점)에 비해 비타민 관련 지식 중 ‘지용성 비타민
다(p<0.05). 비만과 당뇨 관련인 ‘과도한 당류의 섭취는 비만 또는 당뇨를 유발할 수 있다’라는 문항에서 여학생(0.88점) 이 남학생(0.77점)보다 점수가 높았으며(p<0.01), 암과 관련 된 지식 중 ‘짠 식품의 섭취는 위암을 유발할 수 있다’라는 문항에서도 여학생(0.72점)이 남학생(0.53점)보다 점수가 높 았다(p<0.01). 암과 관련된 전반적인 지식에서도 여학생(1.93 점)이 남학생(1.63점)에 비해 점수가 높아(p<0.01) 전반적으 로 볼 때 여학생이 남학생에 비해 영양소 및 만성질환예방과 관련한 영양지식이 높게 나타났다.
대학생들을 대상으로 한 선행연구 결과에서도 여학생들이 남학생들에 비해 정확한 영양지식과 긍정적인 영양섭취 태 도를 나타냈다고 보고하여 본 연구 결과와 유사한 결과를 나 타냈다(Kim KN & Lee KS 1996; Lee SL & Lee SH 2015).
그 이유로 여학생들은 중․고등학교 교과과정 중 영양과 관 련된 지식습득의 기회가 많았기 때문이라고 보고하였다 (Mitchell SJ 1990; Kim KN & Lee KS 1996). 또한 여학생들 이 남학생들에 비해 비만이나 체형관리 등의 외모에 대해 관 심이 많기 때문이라고 보고하였다(Kim SJ 2019). 20세 이상 성인 남녀를 대상으로 한 영양지식 연구 결과에서도 여자가 남자에 비해 나트륨과 관련된 영양지식 점수가 높게 나타나 본 연구결과와 유사한 결과를 나타냈다(Yun MJ & Kim YM 2018).
학년에 따른 영양지식은 탄수화물 중 세부문항인 ‘탄수화 물과 지질은 1 g당 같은 열량을 가지고 있다’라는 문항에서 2학년(0.48점)이 1학년(0.29점)보다 점수가 높았다(p<0.01).
비타민과 미네랄 관련 전체지식 점수는 1학년(5.35점)이 2학 년(4.88점)보다 높았으며(p<0.05) 심혈관계질환 전체에서도 1학년(2.96점)이 2학년(2.59점)보다 높은 점수를 나타냈다 (p<0.05). 세부문항 중 ‘채소류는 칼륨함량이 높아 고혈압을 예방하는 기능이 있다’라는 문항에서도 1학년이 0.82점으로 2학년의 0.64점보다 높았다(p<0.01). 골다공증 관련 전체점 수에서도 1학년 1.49점, 2학년 1.24점으로 1학년이 2학년보 다 점수가 높았다(p<0.05). 또한 영양소 및 만성질환예방 관 련 전체지식에서도 1학년 24.47점, 2학년 23.28점으로 1학년 이 2학년에 비해 점수가 높아(p<0.05), 전반적으로 볼 때 1학 년이 2학년보다 영양지식 수준이 높게 나타냈다.
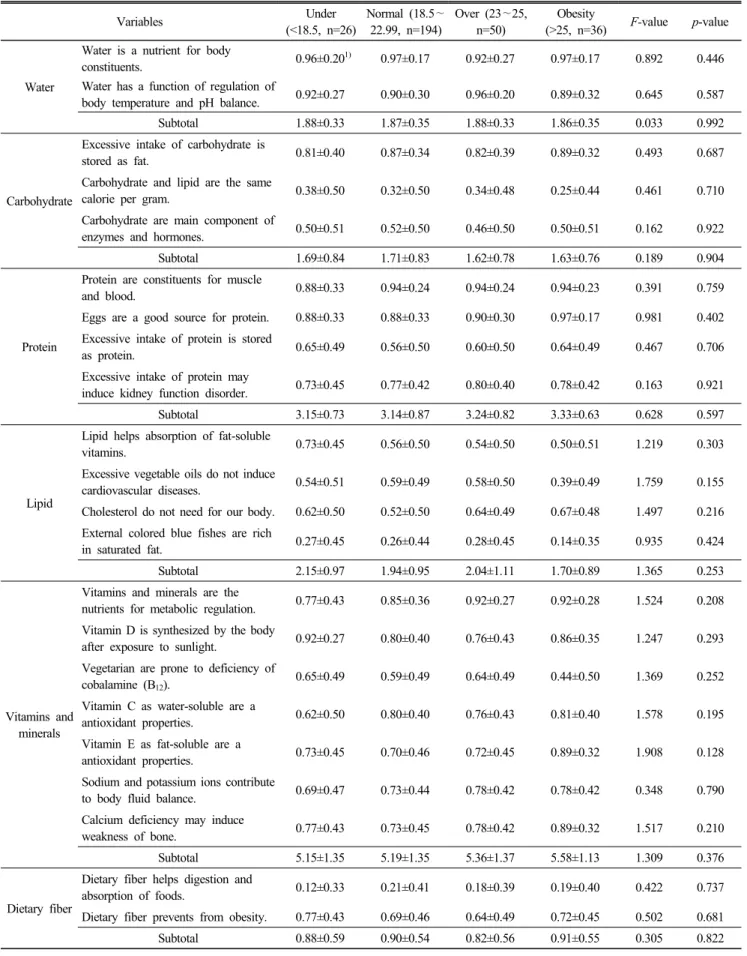
BMI에 따른 영양지식 수준의 차이를 분석한 결과는 Table 3에 제시하였다. 심혈관계질환 관련 전체점수에서 과체중군 (3.26점)이 저체중군(2.69점), 정상군(2.84점) 및 비만군(2.83 점)에 비해 유의적으로 높은 점수를 나타냈으나(p<0.05), 다 른 영양소 및 만성질환예방 관련 지식점수에서는 유의적인 차이가 없었다.
고등학생을 대상으로 BMI에 따른 심혈관계질환과 관련된 Table 1. Demographic factors
Variables n(%)
Gender
Male 202(66.0)
Female 104(34.0)
Grade
First 248(81.0)
Second 58(19.0)
BMI (kg/m2)
Under (<18.5) 26( 8.5) Normal (18.5∼22.99) 194(63.4) Over (23∼25) 50(16.3) Obesity (>25) 36(11.8)
Major field
Humanities and social science 116(37.9) Science and engineering 119(38.9) Physical, arts and others 71(23.2)
Total 306(100.0)
Table 2. Nutrition knowledge by gender and grade mean±S.D.
Variables
Gender Grade
Boys (n=202)
Girls
(n=104) t-value p-value First (n=248)
Second
(n=58) t-value p-value
Water
Water is a nutrient for body
constituents. 0.96±0.201) 0.96±0.19 —0.049 0.961 0.96±0.21 0.98±0.13 —0.956 0.340
Water has a function of regulation of body temperature and pH balance.
0.91±0.29 0.92±0.27 —0.499 0.618 0.92±0.28 0.90±0.31 0.452 0.651
Subtotal 1.87±0.36 1.88±0.32 —0.440 0.660 1.87±0.35 1.88±0.33 —0.166 0.868
Carbohydrate
Excessive intake of
carbohydrate is stored as fat. 0.88±0.33 0.82±0.39 1.321 0.188 0.85±0.36 0.90±0.31 —1.073 0.286 Carbohydrate and lipid are the
same calorie per gram. 0.28±0.45 0.41±0.50 —2.353 0.020* 0.29±0.45 0.48±0.50 —2.722 0.008**
Carbohydrate are main component of enzymes and hormones.
0.50±0.50 0.50±0.50 0.082 0.935 0.52±0.50 0.41±0.50 1.521 0.132
Subtotal 1.66±0.80 1.73±0.83 —0.739 0.460 1.66±0.78 1.79±0.91 —1.150 0.251
Protein
Protein are constituents for
muscle and blood. 0.94±0.25 0.93±0.25 0.099 0.922 0.94±0.25 0.93±0.26 0.123 0.902 Eggs are a good source for
protein. 0.89±0.32 0.90±0.30 —0.472 0.638 0.90±0.30 0.86±0.35 0.819 0.414
Excessive intake of protein is
stored as protein. 0.56±0.50 0.63±0.49 —1.025 0.306 0.60±0.49 0.52±0.50 1.162 0.246 Excessive intake of protein may
induce kidney function disorder. 0.77±0.42 0.77±0.42 0.060 0.952 0.79±0.41 0.71±0.46 1.209 0.230
Subtotal 3.16±0.81 3.23±0.85 —0.726 0.469 3.22±0.80 3.02±0.93 1.704 0.089
Lipid
Lipid helps absorption of
fat-soluble vitamins. 0.56±0.50 0.57±0.50 —0.049 0.961 0.55±0.50 0.62±0.49 —0.953 0.343 Excessive vegetable oils do not
induce cardiovascular diseases. 0.50±0.50 0.67±0.47 —2.892 0.004** 0.54±0.50 0.66±0.48 —1.629 0.107 Cholesterol do not need for our
body. 0.55±0.50 0.60±0.49 —0.778 0.437 0.58±0.49 0.48±0.50 1.410 0.160
External colored blue fishes are
rich in saturated fat. 0.26±0.44 0.23±0.42 0.602 0.548 0.25±0.44 0.24±0.43 0.199 0.842
Subtotal 1.88±1.00 2.10±0.92 —1.591 0.113 1.93±0.95 2.00±1.08 —0.483 0.629
Vitamins and minerals
Vitamins and minerals are the nutrients for metabolic regulation.
0.86±0.35 0.86±0.35 0.133 0.894 0.87±0.34 0.83±0.38 0.775 0.439
Vitamin D is synthesized by the
body after exposure to sunlight. 0.83±0.38 0.77±0.42 1.270 0.206 0.82±0.39 0.78±0.42 0.745 0.457 Vegetarian are prone to
deficiency of cobalamine (B12). 0.57±0.50 0.62±0.49 —0.691 0.490 0.60±0.49 0.53±0.50 0.922 0.357 Vitamin C as water-soluble are
a antioxidant properties. 0.78±0.41 0.77±0.42 0.257 0.797 0.78±0.41 0.76±0.43 0.389 0.698 Vitamin E as fat-soluble are a
antioxidant properties. 0.77±0.42 0.64±0.48 2.206 0.029* 0.75±0.43 0.62±0.49 1.849 0.068 Sodium and potassium ions
contribute to body fluid balance.
0.75±0.43 0.72±0.45 0.591 0.555 0.75±0.43 0.69±0.47 1.007 0.315
Calcium deficiency may induce
weakness of bone. 0.78±0.41 0.71±0.46 1.325 0.187 0.78±0.42 0.67±0.47 1.566 0.121
Subtotal 5.35±1.29 5.09±1.39 1.659 0.098 5.35±1.28 4.88±1.48 2.456 0.015*
Variables
Gender Grade
Boys (n=202)
Girls
(n=104) t-value p-value First (n=248)
Second
(n=58) t-value p-value
Dietary fiber
Dietary fiber helps digestion and
absorption of foods. 0.20±0.40 0.17±0.38 0.626 0.532 0.20±0.40 0.16±0.37 0.805 0.421 Dietary fiber prevents from
obesity. 0.69±0.46 0.69±0.46 0.014 0.989 0.70±0.46 0.67±0.47 0.373 0.709
Subtotal 0.90±0.57 0.87±0.50 0.464 0.643 0.90±0.55 0.83±0.53 0.899 0.370
Obesity and diabetes
Obesity may induce cardiovascular
diseases and sleep disorders. 0.86±0.35 0.84±0.37 0.580 0.563 0.84±0.37 0.91±0.28 —1.709 0.090 Childhood obesity are more likely
to lead adult obesity. 0.80±0.40 0.86±0.35 —1.312 0.191 0.83±0.37 0.74±0.44 1.490 0.140 Excessive sugar intake may induce
obesity and/or diabetes. 0.77±0.42 0.88±0.32 —2.706 0.007** 0.81±0.39 0.78±0.42 0.670 0.503 Brown rice are better than milled
rice for diabetes patients. 0.86±0.35 0.90±0.30 —1.243 0.215 0.89±0.32 0.81±0.40 1.378 0.172
Subtotal 3.28±0.93 3.48±0.85 —1.819 0.070 3.38±0.88 3.24±1.03 0.913 0.364
Cancer
Cancer is more affected by genes
than lifestyle. 0.39±0.49 0.44±0.50 —0.862 0.390 0.38±0.49 0.52±0.50 —1.786 0.062
Salty foods can cause stomach
cancer. 0.53±0.50 0.72±0.45 —3.389 0.001** 0.60±0.49 0.57±0.50 0.443 0.658
Nonsmokers have nothing to occur
with lung cancer. 0.71±0.46 0.77±0.42 —1.141 0.244 0.73±0.45 0.72±0.45 0.088 0.930 Subtotal 1.63±1.00 1.93±0.94 —2.630 0.009** 1.71±1.00 1.81±0.93 —0.672 0.502
Cardio- vascular disease
Hyperlipidemia is a abnormally state of high LDL-cholesterol content and/or high triglyceride in blood.
0.72±0.45 0.68±0.47 0.637 0.525 0.73±0.45 0.60±0.49 1.788 0.078
Breads have nothing to do with
excessive sodium intake. 0.63±0.48 0.72±0.45 —1.570 0.118 0.66±0.48 0.69±0.47 —0.469 0.640 Vegetables contain high content of
potassium and prevent from hypertension.
0.79±0.41 0.79±0.41 —0.027 0.979 0.82±0.38 0.64±0.49 2.710 0.008**
Ratio of LDL/HDL cholestrols are more important than total cholesterol in blood.
0.75±0.44 0.71±0.46 0.674 0.501 0.75±0.43 0.66±0.48 1.440 0.154
Subtotal 2.89±0.95 2.90±1.03 —0.150 0.881 2.96±0.94 2.59±1.08 2.460 0.016*
Osteo- porosis
Calcium and vitamin D are good
for prevention of osteoporosis. 0.78±0.42 0.80±0.40 —0.419 0.676 0.81±0.40 0.69±0.47 1.763 0.082 Excessive drinking may induce
excretion of calcium. 0.68±0.47 0.61±0.49 1.328 0.186 0.68±0.47 0.55±0.50 1.796 0.076
Subtotal 1.46±0.62 1.40±0.72 0.684 0.495 1.49±0.61 1.24±0.78 2.253 0.027*
Total 24.07±3.89 24.59±3.45 —1.143 0.676 24.47±3.61 23.28±4.20 2.199 0.029*
1) Data was analyzed by t-test. Significant differences was at p<0.05.Score: 0, incorrect; 1, correct. *p<0.05, **p<0.01.
Table 3. Nutrition knowledge by BMI mean±S.D.
Variables Under
(<18.5, n=26)
Normal (18.5∼
22.99, n=194)
Over (23∼25, n=50)
Obesity
(>25, n=36) F-value p-value
Water
Water is a nutrient for body
constituents. 0.96±0.201) 0.97±0.17 0.92±0.27 0.97±0.17 0.892 0.446
Water has a function of regulation of
body temperature and pH balance. 0.92±0.27 0.90±0.30 0.96±0.20 0.89±0.32 0.645 0.587
Subtotal 1.88±0.33 1.87±0.35 1.88±0.33 1.86±0.35 0.033 0.992
Carbohydrate
Excessive intake of carbohydrate is
stored as fat. 0.81±0.40 0.87±0.34 0.82±0.39 0.89±0.32 0.493 0.687
Carbohydrate and lipid are the same
calorie per gram. 0.38±0.50 0.32±0.50 0.34±0.48 0.25±0.44 0.461 0.710
Carbohydrate are main component of
enzymes and hormones. 0.50±0.51 0.52±0.50 0.46±0.50 0.50±0.51 0.162 0.922
Subtotal 1.69±0.84 1.71±0.83 1.62±0.78 1.63±0.76 0.189 0.904
Protein
Protein are constituents for muscle
and blood. 0.88±0.33 0.94±0.24 0.94±0.24 0.94±0.23 0.391 0.759
Eggs are a good source for protein. 0.88±0.33 0.88±0.33 0.90±0.30 0.97±0.17 0.981 0.402 Excessive intake of protein is stored
as protein. 0.65±0.49 0.56±0.50 0.60±0.50 0.64±0.49 0.467 0.706
Excessive intake of protein may
induce kidney function disorder. 0.73±0.45 0.77±0.42 0.80±0.40 0.78±0.42 0.163 0.921
Subtotal 3.15±0.73 3.14±0.87 3.24±0.82 3.33±0.63 0.628 0.597
Lipid
Lipid helps absorption of fat-soluble
vitamins. 0.73±0.45 0.56±0.50 0.54±0.50 0.50±0.51 1.219 0.303
Excessive vegetable oils do not induce
cardiovascular diseases. 0.54±0.51 0.59±0.49 0.58±0.50 0.39±0.49 1.759 0.155
Cholesterol do not need for our body. 0.62±0.50 0.52±0.50 0.64±0.49 0.67±0.48 1.497 0.216 External colored blue fishes are rich
in saturated fat. 0.27±0.45 0.26±0.44 0.28±0.45 0.14±0.35 0.935 0.424
Subtotal 2.15±0.97 1.94±0.95 2.04±1.11 1.70±0.89 1.365 0.253
Vitamins and minerals
Vitamins and minerals are the
nutrients for metabolic regulation. 0.77±0.43 0.85±0.36 0.92±0.27 0.92±0.28 1.524 0.208 Vitamin D is synthesized by the body
after exposure to sunlight. 0.92±0.27 0.80±0.40 0.76±0.43 0.86±0.35 1.247 0.293
Vegetarian are prone to deficiency of
cobalamine (B12). 0.65±0.49 0.59±0.49 0.64±0.49 0.44±0.50 1.369 0.252
Vitamin C as water-soluble are a
antioxidant properties. 0.62±0.50 0.80±0.40 0.76±0.43 0.81±0.40 1.578 0.195
Vitamin E as fat-soluble are a
antioxidant properties. 0.73±0.45 0.70±0.46 0.72±0.45 0.89±0.32 1.908 0.128
Sodium and potassium ions contribute
to body fluid balance. 0.69±0.47 0.73±0.44 0.78±0.42 0.78±0.42 0.348 0.790
Calcium deficiency may induce
weakness of bone. 0.77±0.43 0.73±0.45 0.78±0.42 0.89±0.32 1.517 0.210
Subtotal 5.15±1.35 5.19±1.35 5.36±1.37 5.58±1.13 1.309 0.376
Dietary fiber
Dietary fiber helps digestion and
absorption of foods. 0.12±0.33 0.21±0.41 0.18±0.39 0.19±0.40 0.422 0.737
Dietary fiber prevents from obesity. 0.77±0.43 0.69±0.46 0.64±0.49 0.72±0.45 0.502 0.681
Subtotal 0.88±0.59 0.90±0.54 0.82±0.56 0.91±0.55 0.305 0.822
영양지식을 조사한 결과, 비만군의 정답률이 70.0%로 가장 높았으며, 과체중군(61.1%) > 정상체중군(54.6%) > 저체중 군(54.5%) 순을 나타냈다고 보고하여 과체중군의 지식도가 높은 것은 유사하나, 비만군의 낮은 지식도는 상이한 결과를 나타냈다(Koo HJ & Kim SY 2015).
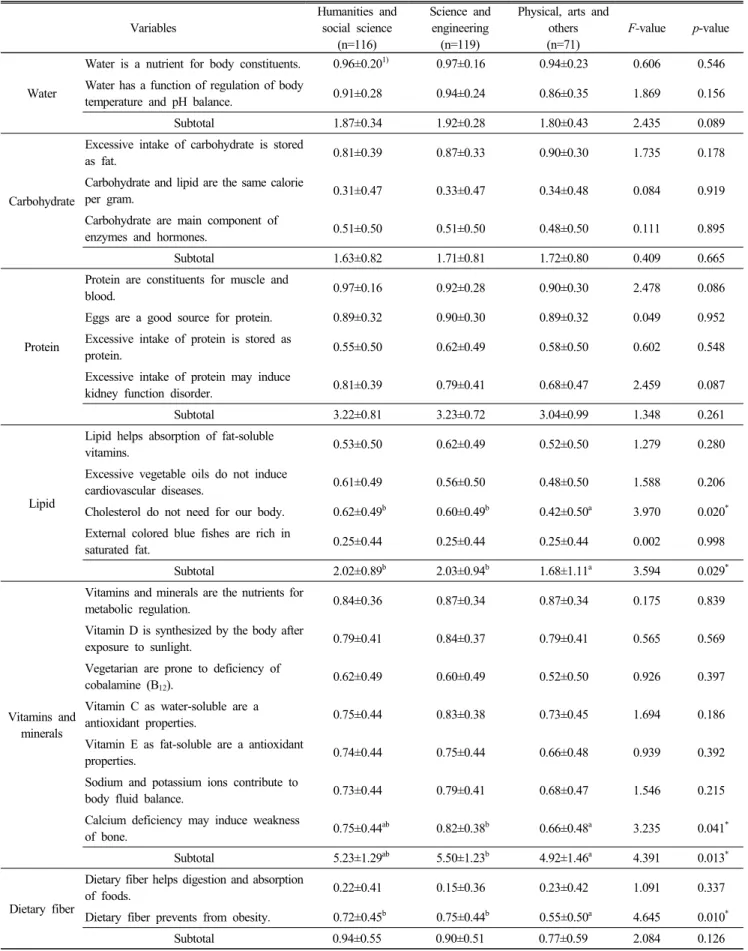
전공계열에 따른 영양지식 수준차이를 분석한 결과는 Table 4에 제시하였다. 지질 관련 지식 중 ‘콜레스테롤은 우 리의 인체구성을 위해 필요하지 않다’라는 문항에서 인문사 회계열(0.62점)과 자연공학계열(0.60점)이 예체능 및 기타 계 열(0.42점)보다 점수가 높았으며(p<0.05) 전체지식점수에
Variables Under
(<18.5, n=26)
Normal (18.5∼22.99,
n=194)
Over (23∼25, n=50)
Obesity
(>25, n=36) F-value p-value
Obesity and diabetes
Obesity may induce cardiovascular
diseases and sleep disorders. 0.88±0.33 0.82±0.38 0.96±0.20 0.83±0.38 2.053 0.106 Childhood obesity are more likely
to lead adult obesity. 0.85±0.37 0.80±0.40 0.84±0.37 0.83±0.38 0.199 0.897
Excessive sugar intake may induce
obesity and/or diabetes. 0.85±0.37 0.79±0.41 0.82±0.39 0.83±0.38 0.227 0.878
Brown rice are better than milled
rice for diabetes patients. 0.88±0.33 0.86±0.35 0.90±0.30 0.89±0.32 0.231 0.875
Subtotal 3.46±0.95 3.28±0.95 3.52±0.74 3.39±0.87 1.084 0.356
Cancer
Cancer is more affected by genes
than lifestyle. 0.38±0.50 0.41±0.49 0.36±0.49 0.47±0.51 0.385 0.764
Salty foods can cause stomach
cancer. 0.65±0.49 0.57±0.50 0.64±0.49 0.64±0.49 0.566 0.638
Nonsmokers have nothing to occur
with lung cancer. 0.62±0.50 0.73±0.45 0.86±0.35 0.64±0.49 2.537 0.057
Subtotal 1.65±1.09 1.71±1.00 1.86±0.81 1.75±1.08 0.382 0.766
Cardio- vascular
disease
Hyperlipidemia is a abnormally state of high LDL-cholesterol content and/or high triglyceride in blood.
0.58±0.50 0.70±0.46 0.76±0.43 0.75±0.44 1.046 0.372
Breads have nothing to do with
excessive sodium intake. 0.62±0.50 0.65±0.48 0.74±0.44 0.67±0.48 0.580 0.629
Vegetables contain high content of potassium and prevent from hypertension.
0.77±0.43 0.76±0.43 0.92±0.27 0.75±0.44 2.117 0.098
Ratio of LDL/HDL cholesterols are more important than total cholesterol in blood.
0.73±0.45 0.72±0.45 0.84±0.37 0.67±0.48 1.291 0.277
Subtotal 2.69±0.93a 2.84±1.00ab 3.26±0.85b 2.83±0.94ab 3.047 0.029*
Osteo- porosis
Calcium and vitamin D are good
for prevention of osteoporosis. 0.88±0.33 0.75±0.44 0.88±0.33 0.78±0.42 1.953 0.121 Excessive drinking may induce
excretion of calcium. 0.65±0.49 0.65±0.48 0.56±0.50 0.81±0.40 1.883 0.132
Subtotal 1.54±0.71 1.40±0.67 1.44±0.64 1.58±0.50 0.998 0.394
Total 24.27±3.17 23.97±3.86 25.04±3.95 24.58±3.20 1.185 0.315
1) Data was analyzed by one way ANOVA. Duncan’s multiple range tests were used to estimate significant differences among the means at p<0.05.
Score: 0, incorrect; 1, correct. * p<0.05.
Table 4. Nutrition knowledge by major field mean±S.D.
Variables
Humanities and social science
(n=116)
Science and engineering
(n=119)
Physical, arts and others (n=71)
F-value p-value
Water
Water is a nutrient for body constituents. 0.96±0.201) 0.97±0.16 0.94±0.23 0.606 0.546 Water has a function of regulation of body
temperature and pH balance. 0.91±0.28 0.94±0.24 0.86±0.35 1.869 0.156
Subtotal 1.87±0.34 1.92±0.28 1.80±0.43 2.435 0.089
Carbohydrate
Excessive intake of carbohydrate is stored
as fat. 0.81±0.39 0.87±0.33 0.90±0.30 1.735 0.178
Carbohydrate and lipid are the same calorie
per gram. 0.31±0.47 0.33±0.47 0.34±0.48 0.084 0.919
Carbohydrate are main component of
enzymes and hormones. 0.51±0.50 0.51±0.50 0.48±0.50 0.111 0.895
Subtotal 1.63±0.82 1.71±0.81 1.72±0.80 0.409 0.665
Protein
Protein are constituents for muscle and
blood. 0.97±0.16 0.92±0.28 0.90±0.30 2.478 0.086
Eggs are a good source for protein. 0.89±0.32 0.90±0.30 0.89±0.32 0.049 0.952 Excessive intake of protein is stored as
protein. 0.55±0.50 0.62±0.49 0.58±0.50 0.602 0.548
Excessive intake of protein may induce
kidney function disorder. 0.81±0.39 0.79±0.41 0.68±0.47 2.459 0.087
Subtotal 3.22±0.81 3.23±0.72 3.04±0.99 1.348 0.261
Lipid
Lipid helps absorption of fat-soluble
vitamins. 0.53±0.50 0.62±0.49 0.52±0.50 1.279 0.280
Excessive vegetable oils do not induce
cardiovascular diseases. 0.61±0.49 0.56±0.50 0.48±0.50 1.588 0.206
Cholesterol do not need for our body. 0.62±0.49b 0.60±0.49b 0.42±0.50a 3.970 0.020* External colored blue fishes are rich in
saturated fat. 0.25±0.44 0.25±0.44 0.25±0.44 0.002 0.998
Subtotal 2.02±0.89b 2.03±0.94b 1.68±1.11a 3.594 0.029*
Vitamins and minerals
Vitamins and minerals are the nutrients for
metabolic regulation. 0.84±0.36 0.87±0.34 0.87±0.34 0.175 0.839
Vitamin D is synthesized by the body after
exposure to sunlight. 0.79±0.41 0.84±0.37 0.79±0.41 0.565 0.569
Vegetarian are prone to deficiency of
cobalamine (B12). 0.62±0.49 0.60±0.49 0.52±0.50 0.926 0.397
Vitamin C as water-soluble are a
antioxidant properties. 0.75±0.44 0.83±0.38 0.73±0.45 1.694 0.186
Vitamin E as fat-soluble are a antioxidant
properties. 0.74±0.44 0.75±0.44 0.66±0.48 0.939 0.392
Sodium and potassium ions contribute to
body fluid balance. 0.73±0.44 0.79±0.41 0.68±0.47 1.546 0.215
Calcium deficiency may induce weakness
of bone. 0.75±0.44ab 0.82±0.38b 0.66±0.48a 3.235 0.041*
Subtotal 5.23±1.29ab 5.50±1.23b 4.92±1.46a 4.391 0.013*
Dietary fiber
Dietary fiber helps digestion and absorption
of foods. 0.22±0.41 0.15±0.36 0.23±0.42 1.091 0.337
Dietary fiber prevents from obesity. 0.72±0.45b 0.75±0.44b 0.55±0.50a 4.645 0.010*
Subtotal 0.94±0.55 0.90±0.51 0.77±0.59 2.084 0.126
서도 인문사회계열(2.02점)과 자연공학계열(2.03점)이 예체 능 및 기타 계열(1.68점)에 비해 높았다(p<0.05). 비타민과 미 네랄 관련 지식은 자연과학계열이 5.50점으로 인문사회계열 5.23점과 예체능 및 기타계열, 4.92점에 비해 높게 나타났다 (p<0.05). 세부문항 중 ‘칼슘의 결핍은 뼈가 약해질 수 있다’
도 자연공학계열이 0.82점으로 인문사회계열 0.75점, 예체능 및 기타 계열 0.66점에 비해 높았다(p<0.05). 식이섬유소 관
련 지식 중 ‘식이섬유소는 비만을 예방한다’라는 문항에서는 자연공학(0.75점)과 인문사회계열(0.72점)이 예체능 및 기타 계열(0.55점)에 비해 높았다(p<0.05). 뿐만 아니라 영양소와 만성질환예방 관련 전체지식 점수에서도 자연공학(25.03점) 과 인문사회계열(24.32점)이 예체능 및 기타 계열(22.82점)에 비해 높았다(p<0.001). 비만과 당뇨 관련 전체지식 점수에서 는 자연공학계열(3.58점)이 인문사회(3.31점)와 예체능 및 기 Variables
Humanities and social science
(n=116)
Science and engineering
(n=119)
Physical, arts and others (n=71)
F-value p-value
Obesity and diabetes
Obesity may induce cardiovascular diseases
and sleep disorders. 0.89±0.32b 0.88±0.32b 0.75±0.44a 4.260 0.015*
Childhood obesity are more likely to lead
adult obesity. 0.79±0.41ab 0.88±0.32b 0.75±0.44a 3.135 0.045*
Excessive sugar intake may induce obesity
and/or diabetes. 0.77±0.42a 0.88±0.32b 0.75±0.44a 3.646 0.027*
Brown rice are better than milled rice for
diabetes patients. 0.86±0.35ab 0.93±0.25b 0.79±0.41a 4.319 0.014*
Subtotal 3.31±0.96b 3.58±0.71c 3.03±1.01a 8.807 <0.001***
Cancer
Cancer is more affected by genes than
lifestyle. 0.45±0.50 0.35±0.48 0.44±0.50 1.254 0.287
Salty foods can cause stomach cancer. 0.59±0.50 0.61±0.49 0.59±0.50 0.045 0.956 Nonsmokers have nothing to occur with
lung cancer. 0.75±0.44 0.69±0.47 0.76±0.43 0.784 0.457
Subtotal 1.78±0.92 1.65±1.04 1.79±1.00 0.723 0.486
Cardio- vascular disease
Hyperlipidemia is a abnormally state of high LDL-cholesterol content and/or high triglyceride in blood.
0.75±0.44 0.73±0.45 0.59±0.50 2.990 0.052
Breads have nothing to do with excessive
sodium intake. 0.72±0.45 0.65±0.48 0.61±0.49 1.305 0.273
Vegetables contain high content of
potassium and prevent from hypertension. 0.80±0.40 0.80±0.40 0.75±0.44 0.466 0.628 Ratio of LDL/HDL cholesterols are more
important than total cholesterol in blood. 0.70±0.46a 0.82±0.38b 0.65±0.48a 4.257 0.015*
Subtotal 2.97±1.00b 3.00±0.90b 2.59±1.01a 4.509 0.012*
Osteo-porosis
Calcium and vitamin D are good for
prevention of osteoporosis. 0.73±0.44a 0.86±0.35b 0.75±0.44ab 3.110 0.046*
Excessive drinking may induce excretion of
calcium. 0.61±0.49 0.66±0.48 0.73±0.45 1.415 0.245
Subtotal 1.34±0.71 1.51±0.58 1.48±0.65 2.118 0.122
Total 24.32±3.56b 25.03±3.08b 22.82±4.63a 8.101 <0.001***
1) Data was analyzed by one way ANOVA. Duncan’s multiple range tests were used to estimate significant differences among the means at p<0.05.
Score: 0, incorrect; 1, correct. * p<0.05, *** p<0.001.
타계열(3.03점)에 비해 높았다(p<0.001). 세부문항 중 ‘과도 한 설탕의 섭취는 비만 또는 당뇨를 유발할 수 있다’(p<0.05) 라는 문항에서도 자연공학계열(0.88점)이 인문사회(0.77점) 와 예체능 및 기타 계열(0.75점)에 비해 높았다. 이 외 ‘비만 은 심혈관계질환과 수면장애를 유발할 수 있다’(p<0.05)는 인문사회(0.89점)와 자연공학계열(0.88점)이 예체능 및 기타 계열(0.75점)에 비해 높은 점수를 나타냈고, ‘소아비만은 성 인비만으로 이어지기 쉽다’(p<0.05)와 ‘당뇨환자에게는 현미 가 백미보다 좋다’(p<0.05)라는 문항에서는 자연공학계열 (0.93점), 인문사회계열(0.86점), 예체능 및 기타 계열(0.79점) 순이었다. 심혈관계질환 관련 전체지식 점수에서는 자연공 학(3.00점) 및 인문사회계열(2.97점)이 예체능 및 기타계열 (2.59점)에 비해 높았으며(p<0.05), 세부문항 중 ‘혈액 중 총 콜레스테롤 함량보다 LDL과 HDL 콜레스테롤의 비율이 더 욱 중요하다’(p<0.05)라는 문항에서는 자연공학계열(0.82점) 이 가장 높은 점수를 나타냈고, 인문사회계열(0.70점), 예체능 및 기타 계열(0.65점) 순이었다. 골다공증 관련 지식 중 ‘칼 슘과 비타민 D는 골다공증 예방에 좋다’(p<0.05)라는 문항에 서도 자연공학계열이 0.86점으로 예체능 및 기타 계열 0.75 점, 인문사회계열 0.73점에 비해 높은 수준이었다(p<0.05). 전 공계열에 따른 영양소 및 만성질환예방 관련 지식수준을 판 단해 볼 때, 전반적으로 자연공학계열이 가장 우수하였으며, 그 다음으로 인문사회계열, 예체능 및 기타 계열 순이었다.
대학생을 대상으로 한 당 관련 영양지식 조사 결과, 여학 생이 남학생보다 점수가 높았으며, 보건의료계열 전공학생 들이 다른 전공계열에 비해 높았다고 보고하였다. 이유는 보 건계열학생들이 건강과 관련된 전공지식을 주로 학습하였기 때문이라고 보고하였다(Kim SJ 2019). 본 연구 결과에서도 자연공학계열의 학생들이 다른 계열에 비해 높은 영양지식 을 나타낸 것은 식품 및 영양과 관련된 전공들이 자연공학계 열에 속해 있기 때문인 것으로 판단된다.
Jo HJ(2011)는 대학생의 영양지식 수준 및 건강에 대한 관 심도가 전반적으로 낮았다고 보고하였다. 영양지식 점수는 10점 만점을 기준으로 전체평균 5.47점이었으며, 가장 높은 정답률을 나타낸 문항은 만성퇴행성질환 예방을 위한 균형 있는 식생활과 관련된 영양지식(89.16%)인 반면, 가장 낮은 정답률을 보인 문항은 채식주의자와 비타민 B12의 부족과 관 련된 영양지식(14.12%)이었다. 본 연구 결과에서는 성별, 학 년, BMI 및 전공계열과 상관없이 영양소와 관련된 지식 중 등푸른생선과 불포화지방산 함유 관련 지식과 식이섬유와 음식물의 소화 및 흡수와 관련된 지식이 전반적으로 낮은 것 으로 나타났다. 만성질환과 관련된 지식 중에서는 암과 식습 관과의 상관성에 대한 지식수준이 매우 낮은 것으로 나타났 다. 또한 채식주의자와 비타민 B12의 부족과 관련된 영양지
식은 일반사항에 따라 유의적인 차이가 없었다.
일반적으로 비만인 사람들이 본 연구에서 조사한 만성질 환에 노출되어 있는 경우가 많다(Kim SH 등 2007). 비만은 2차적으로 암과 당뇨 및 고혈압, 고지혈증, 동맥경화와 같은 심혈관계질환의 위험도 함께 높이는 것으로 알려져 있어 (Malik VS 등 2010; Koning L 등 (2012) 특히 유의할 필요가 있다. 심혈관계 질환에 따른 사망률은 약 25%를 차지하며, 음식 중의 식염과 나트륨 이온의 과잉섭취가 고혈압을 유발 하면서 더욱 문제가 된다(Havas S 등 2007). 한국식단 중 김 치류, 장류, 장아찌류와 같은 짠맛을 내는 식단의 위험성에 대한 사람들의 인식도는 일반적으로 높으나, 대학생들의 섭 취빈도가 높은 가염소시지 및 가염치즈, 빵류, 과자류, 케첩 을 포함한 소스류 등의 가공식품류에 중 나트륨이온에 대한 인식도는 낮은 것이 문제이다(Chung EJ & Shim EG 2008;
Park S 등 2014). 본 연구 결과, 남학생이 여학생에 비해 과 량의 당류섭취로 인한 비만 및 당뇨의 위험성(p<0.01)과 짠 식품의 섭취와 위암 발생(p<0.01)에 대한 지식도가 낮았으며, 2학년이 1학년보다 심혈관계질환 지식(p<0.01)이 낮았다.
BMI별로는 저체중군이 다른 군들에 비해 심혈관계질환 지 식(p<0.05)이 낮았으며 전공계열별로는 예체능 및 기타 계열 이 다른 계열들에 비해 비만과 당뇨(p<0.001)와 심혈관계질 환(p<0.05)과 관련된 지식도가 낮게 나타나, 이들 군들에 대 한 부족한 영양지식에 대한 교육이 요구되었다.
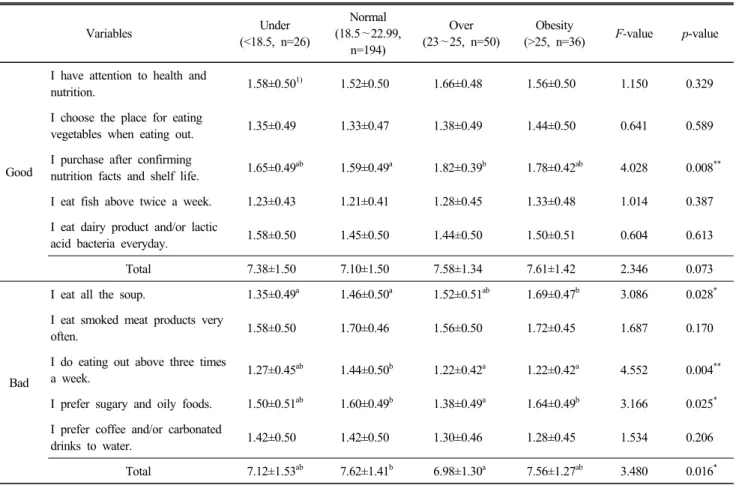
3. 식습관
성별과 학년에 따른 식습관 차이를 분석한 결과는 Table 5에 제시하였다. 좋은 식습관 중 ‘나는 일주일에 2번 이상 생 선류를 섭취한다’라는 문항에서 남학생이 1.29점으로 여학생 의 1.13점에 비해 높았다(p<0.05). 나쁜 식습관 중에서는 ‘나 는 국물을 모두 마신다’라는 문항에서 남학생(1.56점)이 여 학생(1.34점)보다 점수가 높았다(p<0.001). ‘일주일에 3번 이 상 외식을 한다’라는 문항에 대해서도 남학생(1.42점)이 여 학생(1.26점)보다 점수가 높았으며(p<0.01), 나쁜 식습관의 전체점수에서도 남학생 7.62점, 여학생 7.17점으로 남학생이 여학생보다 높게 나타나(p<0.01) 좋은 식습관과 나쁜 식습관 점수 모두 남학생이 여학생보다 높았다.
원주지역 대학생들을 대상으로 한 선행연구 결과, 남학생 이 여학생보다 좋은 식습관을 나타냈다고 보고하여 본 연구 결과와 유사한 반면, 외식 빈도는 여학생이 남학생보다 높게 나타나 본 연구 결과와 상이한 결과를 나타냈다(Lee SL &
Lee SH 2015). 일반적으로 한국인들이 자주 섭취하는 국물 에는 나트륨의 함량이 높은 것으로 보고되고 있다(Shin EK 등 2008). 본 연구 결과, 남학생들이 여학생들에 비해 국물을 모두 마시는 식습관을 나타내어(p<0.001) 남학생들의 나트륨