• 검색 결과가 없습니다.

Prediction for risk of ischemic heart disease (IHD) in aged 30 or older Korean using national health insurance service-national sample cohort (NHIS-NSC)

N/A
N/A
Protected

Academic year: 2021

Share "Prediction for risk of ischemic heart disease (IHD) in aged 30 or older Korean using national health insurance service-national sample cohort (NHIS-NSC)"

Copied!
9
0
0

로드 중.... (전체 텍스트 보기)

전체 글

(1)

Prediction for risk of ischemic heart disease (IHD) in aged 30 or older Korean using national health insurance

service-national sample cohort (NHIS-NSC)

Hyemin Wang 1 · Sungsuk Chung 2

1 Department of Statistics, Chonbuk National University

2 Department of Statistics (Institute of Applied Statistics), Chonbuk National University

Received 1 July 2019, revised 21 August 2019, accepted 1 September 2019

Abstract

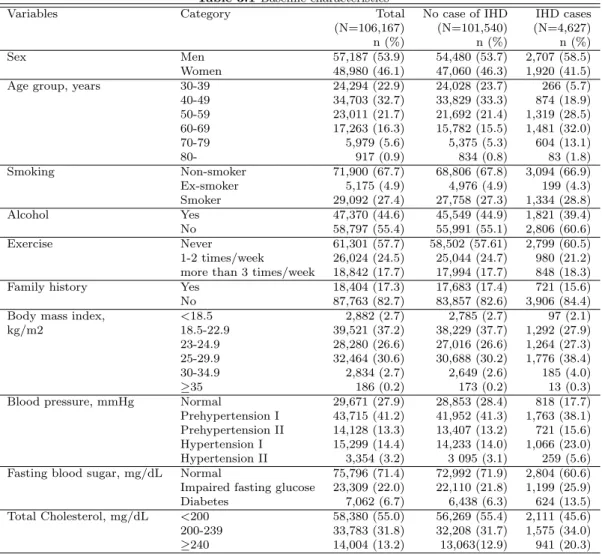
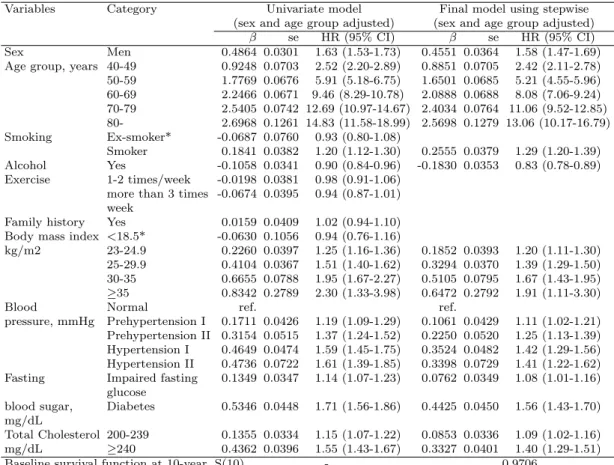
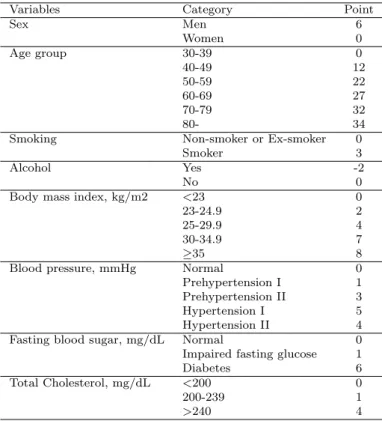
The mortality rate of ischemic heart disease (IHD) was the highest rate of any heart diseases in South Korea. In this study, we predict the absolute risk factors of IHD according to individual characteristics or health status. Cox proportional hazards regression models were fitted to estimate hazard ratio of risk. Stepwise method was used to select a final model. After predictors were selected, the results were used to estimate the absolute 10-year IHD risk using Framingham risk score function and to calculated a simple point system. The total observation period for 106,167 subjects was 1,071,584 person-years. During the observation period, 4,627 subjects (4.4%) developed IHD with incidence rate of 431.79 per 100,000 person-year. Sex, age, smoking, drink, blood pressure, fasting blood sugar and total cholesterol were included in the final model. A Harrell?s c-index was 0.7321 as a measure of discrimination and the overall O/E ratio was 0.972 (95% CI 0.944-1.000). We have predicted a model for 10-year risk of IHD related to risk factors using NHIS-NSC. Using these results, if you have your health information, you will be able to predict your risk of IHD.

Keywords: Absolute risk factor, Cox proportional hazards regression, Framingham risk score, ischemic heart disease.

1. Introduction

In 2015, the total number of deaths in South Korea was 275,895, and the three leading causes were malignant neoplasms (cancer), heart disease, and cerebrovascular disease. The heart disease was the third leading cause of death 10 years ago, and now it is second only to cancer. The mortality rate of ischemic heart disease (IHD) was 28.9 per 100,000 population, which was the highest rate of any heart diseases (Statistics Korea, 2016). IHD is a commonly caused by atherosclerosis affecting the coronary arteries, which limits the flow of oxygen-rich

1

Ph. D. candidate, Department of Statistics, Chonbuk National University, Jeonju, Jeonbuk 54896, Korea.

2

Corresponding author: Professor, Department of Statistics and Institute of Applied Statistics, Chonbuk

National University, Jeonju, Jeonbuk 54896, Korea. Email: [email protected]

(2)

blood to myocardium. Age and IHD mortality rate were highly correlated, IHD mortality rate significantly increasing in older age groups (Statistics Korea, 2016). Therefore, it is expected that IHD mortality rate will increase drastically in the near future due to the rapidly ageing population.

In Europe and the United States, large-scale cohort studies on IHD were done, identify- ing major risk factors and developing disease prevention prediction models (D’Agostino et al. 2001). Major risk factors for IHD include hypertension, high cholesterol, diabetes, and smoking. Studies suggest that moderate alcohol intake may reduce the risk of IHD (Ko et al., 2010, Ji et al., 2004, Hines, 2001).

However, most studies focus on measuring the relative risk of a risk factor and comparing its magnitude to other risk factors; thus, it is difficult for a clinician or an individual to accurately predict the risk of a disease according to the patient’s or individual’s health condition. The purpose of this study was to identify the risk factors of IHD and to predict the absolute risk of IHD according to individual characteristics or health status.

2. Method

2.1. Data

In this study, we used Republic of Korea National Health Insurance Service-National Sample Cohort (NHIS-NSC) Database from 2002 to 2013. NHIS-NSC is a population-based cohort established by the National Health Insurance Service (NHIS) in South Korea. The database consists of a qualification DB, a diagnosis DB, and a checkup DB. 2.2% of total population was selected by stratified sampling using proportional allocation method was conducted (Kyu-Jin Kim et al., 2017). NHIS-NSC had records of 585,795 (male 285,560, women 300,235) individuals over 30 years of age. We excluded subjects who deceased or were hospitalized for malignant neoplasm, cerebrovascular disease, and/or IHD from 2002 to 2003. Subjects with missing data on selected risk factors were also excluded, leaving a total of 106,167 individuals (men 57,187, women 48,980) for the study.

2.2. Response variable

Incidence of IHD during follow-up (2004 to 2013) were identified by death or hospitaliza- tion from IHD (ICD 10, I20-I25). If a death or hospitalization from IHD was identified, the period from the beginning of the research to the onset of the disease was calculated. If the subject was free of IHD, we calculated the survival period from the beginning of the research to the end of research or censored time.

2.3. Risk factor

Based on previous studies, risk factors of IHD used in our study are sex, age, smoking history, alcohol drinking, physical exercise, family medical history, Body mass Index, blood pressure, fasting blood glucose, and total cholesterol (Ko et al., 2010, Shin et al., 2012, Ji et al., 2004).

The age was categorized by 10 years. Smoking status was categorized as non- smoker,

ex-smoker, and smoker. Alcohol consumption was categorized as yes or no instead of almost

never, 2-3time/month, 1-2time/week, 3-4time/week and daily. Exercise was categorized as

(3)

never, 1-2time/week, over 3time/week. Family history category was considered positive if subject had a family history of heart disease, stroke, and/or cancer according to the self- report. Body mass index(kg/m2) was categorized as underweight (<18.5), normal (18.5-23), overweight (23-25), obese class I (25-30), obese class II (30-35) and obese class III (≥35) based on classification from Korean Society for the Study of Obesity. Blood pressure(mmHg) was categorized as normal (<120 and <80), prehypertension I (systolic as 120-129 or dias- tolic as 80-84), prehypertension II (systolic as 130-139 or diastolic as 85-89), hypertension I (systolic as 140-159 or diastolic as 90-99) and hypertension II (systolic as 160 or diastolic as 100) (ESH/ESC Guidelines, 2013). Fasting blood sugar(mg/dL) was categorized as nor- mal (<100), impaired fasting glucose (100-125) and diabetes (≥126) (KDA, 2015). Total cholesterol(mg/dL) was categorized as <200, 200-239, and ≥240 (ATP III, 2001).

2.4. Statistical analysis

Cox proportional hazards regression models were fitted to estimate hazard ratio of risk factors(Taeseob Lee et al., 2017). We evaluated univariate models to check relation between IHD and each risk factors and multivariate models. All models are adjusted for sex and age. Stepwise method was used to select a final model. After predictors were selected, the results were used to estimate the absolute 10-year IHD risk, which was calculated from the following formula by Framingham heart study (D’Agostino et al., 2001).

P = 1 − S(t) exp(f (x,M )) ; f (x, M ) =

p

X

i=1

β i (x i − M i ) .

Here, β i are the regression coefficients of Cox model, x i are dichotomous values (1 and 0) of the dummy variables for each category. M i is the proportion of the category of variable.

S(t) is a baseline survival rate.

Let W i j denote the reference value for the jth category of the ith risk factor. The reference value of the base category is denoted W iRef for each of the i risk factors. The points for each category of each risk factor are determined by the following:

P oints ij = β i (W ij − W iRef )/B,

where the constant, B, is the number of regression units that reflect 1 point in the final points system (Sullivan et al., 2004).

Discrimination and calibration were conducted for model validation. Discrimination was evaluated with Harrell’s c-index. An internal validation of our model was also conducted with a bootstrapping method (Harrell et al., 1996, Michikawa et al., 2012). The model was applied to each bootstrap sample (1000 random samplings) and the c-index was estimated each time. We calculated the mean difference between the original c-index and the c-index of each sample was calculated; the c-index was corrected by subtracting the mean difference from the original c-index. For calibration, the ratio of observed and expected IHD cases (O/E ratio) with 95% CIs was calculated from the following formula (Park et al., 2009, Michikawa et al., 2012).

Finally, we calculated a simple point system to make the risk estimation model easy to use

for primary prevention of IHD (Sullivan et al., 2004, Michikawa et al., 2012). All analyses

were conducted using both SAS version 9.3 and R version 3.2.5

(4)

3. Results

The total observation period for 106,167 subjects was 1,071,584 person-years (mean follow- up period: 10.09 years). During the observation period, 4,627 subjects (4.4%) developed IHD with incidence rate of 431.79 per 100,000 person-year. For men, 2,707 cases (4.7%) of IHD were newly diagnosed out of 57,187 subjects, and IHD incidence rate per 100,000 person- year was 472.80. For women, 1,920 cases (3.9%) of IHD cases were newly diagnosed out of 48,980 subjects, and IHD incidence rate per 100,000 person-year was 384.74. The baseline characteristics of study subjects are described in Table 3.1.

Table 3.1 Baseline characteristics

Variables Category Total No case of IHD IHD cases

(N=106,167) (N=101,540) (N=4,627)

n (%) n (%) n (%)

Sex Men 57,187 (53.9) 54,480 (53.7) 2,707 (58.5)

Women 48,980 (46.1) 47,060 (46.3) 1,920 (41.5)

Age group, years 30-39 24,294 (22.9) 24,028 (23.7) 266 (5.7)

40-49 34,703 (32.7) 33,829 (33.3) 874 (18.9)

50-59 23,011 (21.7) 21,692 (21.4) 1,319 (28.5)

60-69 17,263 (16.3) 15,782 (15.5) 1,481 (32.0)

70-79 5,979 (5.6) 5,375 (5.3) 604 (13.1)

80- 917 (0.9) 834 (0.8) 83 (1.8)

Smoking Non-smoker 71,900 (67.7) 68,806 (67.8) 3,094 (66.9)

Ex-smoker 5,175 (4.9) 4,976 (4.9) 199 (4.3)

Smoker 29,092 (27.4) 27,758 (27.3) 1,334 (28.8)

Alcohol Yes 47,370 (44.6) 45,549 (44.9) 1,821 (39.4)

No 58,797 (55.4) 55,991 (55.1) 2,806 (60.6)

Exercise Never 61,301 (57.7) 58,502 (57.61) 2,799 (60.5)

1-2 times/week 26,024 (24.5) 25,044 (24.7) 980 (21.2) more than 3 times/week 18,842 (17.7) 17,994 (17.7) 848 (18.3)

Family history Yes 18,404 (17.3) 17,683 (17.4) 721 (15.6)

No 87,763 (82.7) 83,857 (82.6) 3,906 (84.4)

Body mass index, <18.5 2,882 (2.7) 2,785 (2.7) 97 (2.1)

kg/m2 18.5-22.9 39,521 (37.2) 38,229 (37.7) 1,292 (27.9)

23-24.9 28,280 (26.6) 27,016 (26.6) 1,264 (27.3) 25-29.9 32,464 (30.6) 30,688 (30.2) 1,776 (38.4)

30-34.9 2,834 (2.7) 2,649 (2.6) 185 (4.0)

≥35 186 (0.2) 173 (0.2) 13 (0.3)

Blood pressure, mmHg Normal 29,671 (27.9) 28,853 (28.4) 818 (17.7)

Prehypertension I 43,715 (41.2) 41,952 (41.3) 1,763 (38.1) Prehypertension II 14,128 (13.3) 13,407 (13.2) 721 (15.6) Hypertension I 15,299 (14.4) 14,233 (14.0) 1,066 (23.0) Hypertension II 3,354 (3.2) 3 095 (3.1) 259 (5.6) Fasting blood sugar, mg/dL Normal 75,796 (71.4) 72,992 (71.9) 2,804 (60.6) Impaired fasting glucose 23,309 (22.0) 22,110 (21.8) 1,199 (25.9)

Diabetes 7,062 (6.7) 6,438 (6.3) 624 (13.5)

Total Cholesterol, mg/dL <200 58,380 (55.0) 56,269 (55.4) 2,111 (45.6) 200-239 33,783 (31.8) 32,208 (31.7) 1,575 (34.0)

≥240 14,004 (13.2) 13,063(12.9) 941 (20.3)

Almost all risk factors except for exercise and family history were associated with increased

IHD risk in the age and sex adjusted univariate. However, some categories in certain variables

were not statistically significant compare to the reference category. As a result of stepwise

(5)

model selection, exercise and family history showed no statistically significant association with IHD; Therefore they were excluded in final model (Table 3.2). Some categories of certain variables were merged if there was no statistically significant difference from reference categories. We merged ‘non- smoker and ex-smoker’ in smoking, as well as ‘< 18.5 kg/m2 and 18.5 - 22.9 kg/m2’ in BMI. In this model, baseline survival function at 10 years was 0.9706 by Framingham Study risk score function.

Table 3.2 Cox regression coefficient and hazard ratio for IHD risk factor

Variables Category Univariate model Final model using stepwise

(sex and age group adjusted) (sex and age group adjusted)

β se HR (95% CI) β se HR (95% CI)

Sex Men 0.4864 0.0301 1.63 (1.53-1.73) 0.4551 0.0364 1.58 (1.47-1.69) Age group, years 40-49 0.9248 0.0703 2.52 (2.20-2.89) 0.8851 0.0705 2.42 (2.11-2.78) 50-59 1.7769 0.0676 5.91 (5.18-6.75) 1.6501 0.0685 5.21 (4.55-5.96) 60-69 2.2466 0.0671 9.46 (8.29-10.78) 2.0888 0.0688 8.08 (7.06-9.24) 70-79 2.5405 0.0742 12.69 (10.97-14.67) 2.4034 0.0764 11.06 (9.52-12.85) 80- 2.6968 0.1261 14.83 (11.58-18.99) 2.5698 0.1279 13.06 (10.17-16.79) Smoking Ex-smoker* -0.0687 0.0760 0.93 (0.80-1.08)

Smoker 0.1841 0.0382 1.20 (1.12-1.30) 0.2555 0.0379 1.29 (1.20-1.39) Alcohol Yes -0.1058 0.0341 0.90 (0.84-0.96) -0.1830 0.0353 0.83 (0.78-0.89) Exercise 1-2 times/week -0.0198 0.0381 0.98 (0.91-1.06)

more than 3 times -0.0674 0.0395 0.94 (0.87-1.01) week

Family history Yes 0.0159 0.0409 1.02 (0.94-1.10) Body mass index <18.5* -0.0630 0.1056 0.94 (0.76-1.16)

kg/m2 23-24.9 0.2260 0.0397 1.25 (1.16-1.36) 0.1852 0.0393 1.20 (1.11-1.30) 25-29.9 0.4104 0.0367 1.51 (1.40-1.62) 0.3294 0.0370 1.39 (1.29-1.50) 30-35 0.6655 0.0788 1.95 (1.67-2.27) 0.5105 0.0795 1.67 (1.43-1.95)

≥35 0.8342 0.2789 2.30 (1.33-3.98) 0.6472 0.2792 1.91 (1.11-3.30)

Blood Normal ref. ref.

pressure, mmHg Prehypertension I 0.1711 0.0426 1.19 (1.09-1.29) 0.1061 0.0429 1.11 (1.02-1.21) Prehypertension II 0.3154 0.0515 1.37 (1.24-1.52) 0.2250 0.0520 1.25 (1.13-1.39) Hypertension I 0.4649 0.0474 1.59 (1.45-1.75) 0.3524 0.0482 1.42 (1.29-1.56) Hypertension II 0.4736 0.0722 1.61 (1.39-1.85) 0.3398 0.0729 1.41 (1.22-1.62) Fasting Impaired fasting 0.1349 0.0347 1.14 (1.07-1.23) 0.0762 0.0349 1.08 (1.01-1.16)

glucose

blood sugar, Diabetes 0.5346 0.0448 1.71 (1.56-1.86) 0.4425 0.0450 1.56 (1.43-1.70) mg/dL

Total Cholesterol 200-239 0.1355 0.0334 1.15 (1.07-1.22) 0.0853 0.0336 1.09 (1.02-1.16) mg/dL ≥240 0.4362 0.0396 1.55 (1.43-1.67) 0.3327 0.0401 1.40 (1.29-1.51)

Baseline survival function at 10-year, S(10) - 0.9706

* Categories combined in the final model, ref.: reference

Prediction model for incident IHD showed a Harrell’s c-index of 0.7323 as a measure of discrimination. In the bootstrap simulation, the corrected c-index was 0.7314. In the calibration analysis, the overall O/E ratio was 0.972 (0.944 - 1.000). Although there was a slight overestimation or underestimation in each category of risk factors, the O/E ratios were generally acceptable (min-max is 0.933 - 1.390 in O/E ratio of all categories).

Using Sullivan’s point system, we evaluated how individual total points relate to specific

absolute risk of IHD in 10 years (Table 3.3). Sullivan’s points system is a scoring system that

can easily and simply calculate the risk of developing individual characteristics by scoring

risk factors for IHD. The total score range ranged from -2 to 65, and the risk of IHD for all

(6)

possible scores is shown in Table 3.4. The lowest risk score of -2 indicates that the risk of IHD is approximately 0.42%, while the highest risk score of 65 points is 50.50%. For example, if a patient is in the 40s (12 points), male (6 points), smoker (3 points), non-alcoholic (0 points), and has normal values in all clinical factors, the total score for the patient is 21 points. The points system gives a 10-year estimate of risk of 2.43%, employing the Cox model directly gives 2.33%. Another example is that if a patient is in the 50s (22 points), female (0 points), BMI 24 (2 points), total cholesterol >240 (4 points), the total score for the patient is 28 points. The points system gives a 10-year estimate of risk of 4.10%, employing the Cox model directly gives 4.22%.

Table 3.3 A point system for 10-year IHD risk factor

Variables Category Point

Sex Men 6

Women 0

Age group 30-39 0

40-49 12

50-59 22

60-69 27

70-79 32

80- 34

Smoking Non-smoker or Ex-smoker 0

Smoker 3

Alcohol Yes -2

No 0

Body mass index, kg/m2 <23 0

23-24.9 2

25-29.9 4

30-34.9 7

≥35 8

Blood pressure, mmHg Normal 0

Prehypertension I 1

Prehypertension II 3

Hypertension I 5

Hypertension II 4

Fasting blood sugar, mg/dL Normal 0

Impaired fasting glucose 1

Diabetes 6

Total Cholesterol, mg/dL <200 0

200-239 1

>240 4

4. Discussion

In this study, we have developed a prediction model for 10-year risk of IHD related to risk factors using NHIS-NSC. We followed 106,167 subjects who are not deceased or had not been hospitalized for malignant neoplasm, cerebrovascular disease, and IHD, until 2013. The total number of study subjects was 106,167 and total person-years followed were 1,071,584 (mean follow-up period: 10.09 years).

Looking at risk factors for IHD, men were 1.58 times risker than women. The risk of

developing IHD was elevated with increasing age as compared with those in their 30s. Hazard

(7)

Table 3.4 Estimate of 10-year risk of IHD

Total point 10-year risk Total point 10-year risk Total point 10-year risk

-2 0.0042 23 0.0282 48 0.1751

-1 0.0046 24 0.0304 49 0.1876

0 0.0049 25 0.0328 50 0.2008

1 0.0053 26 0.0353 51 0.2149

2 0.0058 27 0.0381 52 0.2298

3 0.0062 28 0.0410 53 0.2456

4 0.0067 29 0.0442 54 0.2622

5 0.0072 30 0.0476 55 0.2798

6 0.0078 31 0.0513 56 0.2982

7 0.0084 32 0.0553 57 0.3176

8 0.0091 33 0.0595 58 0.3380

9 0.0098 34 0.0641 59 0.3593

10 0.0106 35 0.0690 60 0.3815

11 0.0114 36 0.0742 61 0.4046

12 0.0123 37 0.0799 62 0.4285

13 0.0133 38 0.0859 63 0.4533

14 0.0143 39 0.0924 64 0.4788

15 0.0154 40 0.0993 65 0.5050

16 0.0167 41 0.1068

17 0.0180 42 0.1147

18 0.0194 43 0.1232

19 0.0209 44 0.1323

20 0.0225 45 0.1420

21 0.0243 46 0.1523

22 0.0262 47 0.1634

Ratio (HR) was 1.29 for smoker compared to non-smoker or ex-smoker. Drinking decreased the risk with HR of 0.83. The risk levels increased with BMI, blood pressure, fasting blood sugar, and total cholesterol as compared with those in their respective reference categories.

This Cox proportional hazards regression model only assesses the relative risk compare to reference categories. We calculated 10-year absolute risk of IHD using Framingham risk score function. The Framingham model has been used for a considerable time and as a leading model in the disease risk model. Sullivan proposed a point system to make this disease risk model easier to access and use clinically. Since the point system facilitates the results already calculated, there is no need for a user to calculate the risk by using the formula, which makes the model readily available. Furthermore, it has a high correlation with the Framingham risk, which proves the validity of the result (Sullivan, 2004). In this study, risk factors of IHD were scored using Sullivan’s point system to estimate the risk for 10 years (Table 3.3, Table 3.4). These results show that self-prediction of IHD risk can be useful in clinic settings or for individuals who have their own health status information.

Study subjects included in the study were people who had their general medical exami- nation done. In South Korean health care system, those who receive medical examination are mostly currently employed population, which may limit the generalizability. Further subgroup analysis based on occupation or geographic distribution will be required in the future

References

(8)

Chia, Y. C., Gray, S. Y., Ching, S. M., Lim, H. M. and Chinna, K. (2015). Validation of the Framingham general cardiovascular risk score in a multiethnic Asian population: A retrospective cohort study. BMJ Open, 5.

Chobanian, A. V., Bakris, G. L., Black, H. R., et al. and National High Blood Pressure Education Program Coordinating Committee (2003). The seventh report of the joint national committee on prevention, detection, evaluation, and treatment of high blood pressure: The JNC 7 report. Journal of the American Medical Association, 289, 2560-2572.

D’Agostino, R. B., Grundy, S., Sullivan, L. M., Wilson, P. and CHD Risk Prediction Group (2001). Vali- dation of the Framingham coronary heart disease prediction scores. Journal of the American Medical Association, 286, 180-187.

Harrell, Jr., F.E., Lee, K. L. and Mark, D. B. (1996). Multivariable prognostic models: Issues in develop- ing models, evaluating assumptions and adequacy, and measuring and reducing errors. Statistics in Medicine, 15, 361-387.

Hines, L. M. and Rimm, E. B. (2001). Moderate alcohol consumption and coronary heart disease: A review.

Postgraduate Medical Journal, 77, 747-752.

Jee, S. H., Song, J. W., Cho, H. K., Kim, S., Jang, Y. and Kim, J. H. (2004). Development of the individu- alized health risk appraisal model of ischemic heart disease risk in Korea. Korean Society of Lipidology and Atherosclerosis, 14, 153-169.

Kannel, W. B., McGee, D. and Gordon, T. (1976). A general cardiovascular risk profile: The Framingham study. American Journal of Cardiology, 38, 46-51.

Ko, M. J. and Han, J. T. (2010). The relative risk of major risk factors of ischemic heart disease. Journal of the Korean Data & Information Science Society, 21, 201-209.

Korean Diabetes Association (2015). 2015 treatment guideline for diabetes, Korean Diabetes Association.

Kyu-Jin Kim, Chi-Hyuck Jun, Hyeseon Lee and Hun-Sung Kim (2017). Analyzing association between low-density lipoprotein reduction by statin and adherence to medication using national health insur- ance service-national sample cohort (NHIS-NSC). Journal of the Korean Data & Information Science Society, 28, 1027-1041

Lee, J., Lee, J. S., Park, S. H., Shin, S. A. and Kim, K. (2016). Cohort profile: The national health insur- ance service-national sample cohort (NHIS-NSC), South Korea. International Journal of Epidemiology, ppi:dyv319.

Liu, J., Hong, Y., D’Agostino, R. B. Sr, Wu, Z., Wang, W., Sun, J., Wilson, P. W., Kannel, W. B. and Zhao, D. (2004). Predictive value for the Chinese population of the Framingham CHD risk assessment tool compared with the Chinese multi-provincial cohort study. Journal of the American Medical Association, 291, 2591-2599.

Mancia, G., Fagard, R., Narkiewicz, K., Redon, J., Zanchetti, A., Christiaens, T., Cifkova, R., De Backer, G., Dominiczak, A., Galderisi, M., Grobbee, D. E., Jaarsma, T., Kirchhof, P., Kjeldsen, S. E., Lau- rent, S., Manolis, A. J., Nilsson, P. M., Ruilope, L. M., Schmieder, R. E., Sirnes, P. A., Sleight, P., Viigimaa, M., Waeber, B., Zannad, F., The original text is available free on the ESC website:

http://www.escardio.org/guidelines-surveys/esc-guidelines/Pages/arterial-hypertension.aspx. The Eu- ropean Heart Journal, 34, 2159-2219.

Michikawa T., Inoue M., Sawada N., Iwasaki M., Tanaka Y., Shimazu T., Sasazuki S., Yamaji T., Mizokami M., Tsugane S. and Japan Public Health Center-based Prospective Study Group (2012). Development of a prediction model for 10-year risk of hepatocellular carcinoma in middle-aged Japanese: The Japan public health center-based prospective study cohort II. Preventive Medicine, 55, 137-143.

National Cholesterol Education Program (2000). ATP III guidelines at-a-glance quick desk reference, NIH publication, 01-3305.

Palazon-Bru, A., Carbayo-Herencia, J. A., Vigo, M. I. and Gil-Guillen, V. F. (2016). A method to construct a points system to predict cardiovascular disease considering repeated measures of risk factors. PeerJ, 4:e1673.

Park, Y., Freedman A. N., Gail, M. H., Pee, D., Hollenbeck, A., Schatzkin, A. and Pfeiffer, R. M. (2009).

Validation of a colorectal cancer risk prediction model among white patients age 50 years and older.

Journal of Clinical Oncology, 27, 694-698.

Ra, J. S. and Kim, H. S. (2015). Combined influence of obesity and metabolic syndrome on ischemic heart disease in Korean middle aged and older adults. Journal of Korean Public Health Nursing, 29, 540-550.

Rodondi, N., Locatelli, I., Aujesky, D., Butler, J., Vittinghoff, E., Simonsick, E., Satterfield, S., Newman, A. B., Wilson, P. W., Pletcher, M. J., Bauer, D. C. and Health, ABC Study (2012). Framingham risk score and alternatives for prediction of coronary heart disease in older adults. PLOS One, 7, e34287.

Shin S-H, Lee T-Y (2012). Associations of serum lipid profiles with incidence of ischemic heart diseases

(9)

in Korean adults: Retrospective cohort study. Journal of the Korea Academia-Industrial Cooperation Society, 13, 2219-2231.

Statistics Korea (2016). 2015 cause of death statistics, Statistics Korea.

Sullivan L. M., Massaro, J. M. and D’Agostino, R.B. Sr. (2004). Presentation of multivariate data for clinical use: The framingham study risk score functions. Statistics in Medicine, 23, 1631-1660.

Lee, T. and Lee, M. (2017). Analysis of stage III proximal colon cancer using the Cox proportional hazards model. Journal of the Korean Data & Information Science Society, 28, 349-359.

Wannamethee S. G., Shaper A. G., Lennon L. and Morris R. W. (2005). Metabolic syndrome vs framingham

risk score for prediction of coronary heart disease, stroke, and type 2 diabetes mellitus. Archives of

International Medicine, 165, 2644-2650.

수치

Table 3.1 Baseline characteristics
Table 3.2 Cox regression coefficient and hazard ratio for IHD risk factor
Table 3.3 A point system for 10-year IHD risk factor
Table 3.4 Estimate of 10-year risk of IHD

참조

관련 문서