D I A B E T E S & M E T A B O L I S M J O U R N A L
This is an Open Access article distributed under the terms of the Creative Commons Attribution Non-Commercial License (http://creativecommons.org/licenses/by-nc/4.0/) which permits unrestricted non-commercial use, distribution, and reproduction in any medium, provided the original work is properly cited.
PF-04620110, a Potent Antidiabetic Agent, Suppresses Fatty Acid-Induced NLRP3 Inflammasome Activation in Macrophages
Seung Il Jo, Jung Hwan Bae, Seong Jin Kim, Jong Min Lee, Ji Hun Jeong, Jong-Seok Moon
Department of Integrated Biomedical Science, Soonchunhyang Institute of Medi-bio Science (SIMS), Soonchunhyang University, Cheonan, Korea
Background: Chronic inflammation has been linked to insulin resistance and type 2 diabetes mellitus (T2DM). High-fat diet (HFD)-derived fatty acid is associated with the activation of chronic inflammation in T2DM. PF-04620110, which is currently in phase 1 clinical trials as a selective acyl-CoA:diacylglycerol acyltransferase-1 (DGAT1) inhibitor, is a potent anti-diabetic agent that may be important for the regulation of chronic inflammation in T2DM. However, the mechanisms by which PF-04620110 regulates fatty acid-induced chronic inflammation remain unclear.
Methods: PF-04620110 was used in vitro and in vivo. DGAT1-targeting gRNAs were used for deletion of mouse DGAT1 via CRISPR ribonucleoprotein (RNP) system. The activation of NLRP3 inflammasome was measured by immunoblot or cytokine analysis in vitro and in vivo.
Results: Here we show that PF-04620110 suppressed fatty acid-induced nucleotide-binding domain, leucine-rich-repeat-con- taining receptor (NLR), pyrin-domain-containing 3 (NLRP3) inflammasome activation in macrophages. In contrast, PF- 04620110 did not change the activation of the NLR family, CARD-domain-containing 4 (NLRC4), or the absent in melanoma 2 (AIM2) inflammasomes. Moreover, PF-04620110 inhibited K+ efflux and the NLRP3 inflammasome complex formation, which are required for NLRP3 inflammasome activation. PF-04620110 reduced the production of interleukin 1β (IL-1β) and IL-18 and blood glucose levels in the plasma of mice fed HFD. Furthermore, genetic inhibition of DGAT1 suppressed fatty acid-induced NLRP3 inflammasome activation.
Conclusion: Our results suggest that PF-04620110 suppresses fatty acid-induced NLRP3 inflammasome activation.
Keywords: Diabetes mellitus, type 2; Diacylglycerol O-acyltransferase; Fatty acids; Inflammasomes; NLR family, pyrin domain- containing 3 protein; PF-04620110
Corresponding author: Jong-Seok Moon https://orcid.org/0000-0002-2537-7854 Department of Integrated Biomedical Science, Soonchunhyang Institute of Medi-bio Science (SIMS), Soonchunhyang University, 31 Suncheonhyang 6-gil, Dongnam-gu, Cheonan 31151, Korea
E-mail: [email protected]
INTRODUCTION
The nucleotide-binding domain, leucine-rich-repeat-contain- ing receptor (NLR), pyrin-domain-containing 3 (NLRP3) in- flammasomes are multi-protein complexes that regulate im- mune response by the activation of caspase-1, and the matura- tion and secretion of pro-inflammatory cytokines, such as in- terleukin 1β (IL-1β) and IL-18 [1-3]. NLRP3 is one of the criti- cal components of the NLRP3 inflammasome. NLRP3 inter-
acts with the adaptor apoptosis-associated speck-like protein containing a caspase recruitment domain (ASC), which re- cruits pro-caspase-1 [4]. Among the known NLR-containing inflammasomes, NLRP3 inflammasome activation is linked to chronic inflammation in human metabolic diseases, such as type 2 diabetes mellitus (T2DM) [5-7]. We have previously re- ported that cellular metabolic pathways and metabolic en- zymes are associated with NLRP3 inflammasome activation in macrophages under pro-inflammatory conditions [8,9].
https://doi.org/10.4093/dmj.2019.0112 pISSN 2233-6079 · eISSN 2233-6087
IL-1β, one of the major pro-inflammatory cytokines pro- duced by NLRP3 inflammasome activation [1], is implicated in chronic inflammation during T2DM [5,10]. IL-1β promotes β-cell destruction and insulin resistance by inhibiting insulin signaling pathway in insulin-sensitive cells [11-14]. The free fatty acids, which are elevated in the plasma of patients with T2DM [15], are one of the important factors of NLRP3 inflam- masome-dependent IL-1β production [6]. Previous study has shown that the elevated fatty acids, such as palmitate, induce NLRP3 inflammasome activation in macrophages [6].
PF-04620110, a potent and selective diacylglycerol acyltrans- ferase-1 (DGAT1) inhibitor, is a potent anti-diabetic agent that was developed by Pfizer Global Research and Development (New York, NY, USA) [16]. Previous studies have shown that PF-04620110 suppresses triglyceride (TG) synthesis and TG levels in plasma through the inhibition of DGAT1 activity [16,17]. Also, PF-04620110 leads to the reduction of blood glu- cose levels in patients with T2DM [18]. Currently, the role of PF-04620110 in regulating fatty acid-induced chronic inflam- mation during T2DM remains incompletely understood.
In this paper, we demonstrate that PF-04620110 suppressed fatty acid-induced NLRP3 inflammasome activation in macro- phages. PF-04620110 inhibited NLRP3 inflammasome com- plex formation, which is required for NLRP3 inflammasome activation. Moreover, PF-04620110 reduced high-fat diet (HFD)-induced IL-1β and IL-18 production in the plasma of mice. Furthermore, the genetic inhibition of DGAT1 by Dgat1 guide RNA (gRNA) suppressed NLRP3 inflammasome activa- tion. Taken together, our results suggest that PF-04620110 could be a pharmacological target of chronic inflammation by fatty acid-induced NLRP3 inflammasome activation.
METHODS
Mice
C57BL/6 mice (male and female, 6 weeks or 2 months old) were from Orient Bio laboratory. All mouse experimental pro- tocols were approved by the Institutional Animal Care and Use Committee of Soonchunhyang University (protocol #: SCH17- 0025, SCH18-0032; Soonchunhyang University, Cheonan, Ko- rea).
Reagents and antibodies
Lipopolysaccharide (LPS) (Escherichia coli; tlrl-pelps) and fla- gellin (Salmonella typhimurium; tlrl-stfla) were from Invivogen
(San Diego, CA, USA). Adenosine triphosphate (ATP) (A2383), while nigericin (N7143), poly(dA:dT) (P0883), and PF- 04620110 (PZ0207) were from Sigma-Aldrich (St. Louis, MO, USA). The following antibodies were used: polyclonal rabbit anti-caspase-1 for mouse caspase-1 (1:1,000) (SC-514; Santa Cruz Biotechnology, Dallas, TX, USA), polyclonal goat anti- IL-1β for mouse IL-1β (1:1,000) (AF-401-NA; R&D Systems, Minneapolis, MN, USA), polyclonal rabbit anti-ASC for mouse ASC (1:1,000) (ADI-905-173-100; Enzo Lifesciences, Farmingdale, NY, USA), polyclonal rabbit anti-DGAT1 for mouse DGAT1 (1:1,000) (ab54037; Abcam, Cambridge, MA, USA), and monoclonal mouse anti-β-actin (1:5,000) (A5316;
Sigma-Aldrich).
Cell culture
Bone marrow-derived macrophages (BMDMs) were prepared as previously described [1,2]. Bone marrow collected from wild-type (WT) mouse (male and female, 8 to 10 weeks old) fe- murs and tibias was plated on sterile Petri dishes, and incubat- ed for 7 days in Dulbecco’s modified Eagle’s medium (DMEM) (Invitrogen, Waltham, MA, USA) containing 10% (v/v) heat- inactivated fetal bovine serum, 100 units/mL penicillin, 100 mg/mL streptomycin and 25% (v/v) conditioned medium from mouse L929 fibroblasts (CCL-1, ATCC). For NLRP3 in- flammasome activation, WT BMDMs (5×10⁶ cells in 100 mm cell culture dish) were incubated with LPS (500 ng/mL, 4 hours), and were then treated with NLRP3 inflammasome ac- tivator as described palmitate–bovine serum albumin (PA–
BSA; 500 μM, 3 hours), ATP (2 mM, 0.5 hour), or nigericin (6.7 μM, 1 hour). For absent in melanoma 2 (AIM2) inflam- masome activation, LPS-primed WT BMDMs were transfect- ed with poly(dA:dT) (1 mg/mL, 3 hours) (Sigma-Aldrich) us- ing Lipofectamine with Plus reagent (15338-100; Invitrogen), according to the manufacturer’s instructions. For the NLR family, CARD-domain-containing 4 (NLRC4) inflammasome activation, LPS-primed WT BMDMs were transfected with flagellin (5 μg/mL, 6 hours) (Invivogen) using Lipofectamine with Plus reagent (15338-100; Invitrogen), according to the manufacturer’s instructions. The cell supernatants and cell ly- sates were collected and analyzed for the levels of IL-1β, IL-18, and tumor necrosis factor α (TNF-α) by enzyme-linked im- munosorbent assay.
Transduction of DGAT1 gRNA/Cas9 plasmid
For stable knockdown of mouse DGAT1, two independent
DGAT1-targeting gRNAs (sgRNA: ATTTCAGATTGAGA- AGCGCC and sgRNA2: CCTGCCCCATGCGTGATTAT;
GeneScript, Piscataway, NJ, USA) were used. We used CRISPR ribonucleoprotein (RNP) system (GeneScript). To prepare RNA oligo, 10 μL of sgRNA Oligo (100 μM) was incubated at 95°C for 5 minutes with anneal components (Nuclease-Free Water [22 μL] and Annealing Buffer 5X [8 μL]). Then, it was put into 60°C water, and left to cool to room temperature (RT).
To prepare and transduce RNP complex, WT BMDMs (2×10⁵ cells in 6-well cell culture plates) were seeded and transfected with RNP complex (Cas9 Nuclease [Z03386; GeneScript] 15 pmol and sgRNA oligos annealed 30 pmol) using Lipofectami- neTM CRISPRMAXTM Cas9 Transfection Reagent (CMAX00003;
Invitrogen), according to the manufacturer’s instructions. BM- DMs were incubated for 48 hours, and stimulated LPS and PA- BSA as described.
Preparation of bovine serum albumin-conjugated palmitate Sodium palmitate (P9767; Sigma-Aldrich) was conjugated with fatty acid-free BSA (03117405001; Sigma-Aldrich) at a 6:1 molar ratio, according to the manufacturer’s instructions (Agi- lent Technologies, Santa Clara, CA, USA). BMDMs were treat- ed with PA–BSA (500 μM, 2 hours) or BSA as control, after LPS incubation.
Immunoblot analysis
WT BMDMs were harvested and lysed in NP40 Cell Lysis Buffer (FNN0021; Invitrogen) or Tissue Extraction Reagent I (FNN0071;
Invitrogen). Lysates were centrifuged at 15,300 ×g for 10 min- utes at 4°C, and the supernatants were obtained. The protein concentrations of the supernatants were determined by Brad- ford assay (500-0006; Bio-Rad Laboratories, Hercules, CA, USA). Proteins were electrophoresed on NuPAGE (4% to 12%) Bis-Tris gels (Invitrogen), and transferred to Protran nitrocel- lulose membranes (10600001; GE Healthcare Life Science, Pittsburgh, PA, USA). Membranes were blocked in 5% (w/v) BSA (9048-46-8; Santa Cruz Biotechnology) in TBS-T (TBS [170-6435; Bio-Rad Laboratories]) and 1% (v/v) Tween-20 (170-6531; Bio-Rad Laboratories) for 30 minutes at RT (25°C).
Membranes were incubated with primary antibody diluted in 1% (w/v) BSA in TBS-T at 4°C, and then with the horseradish peroxidase (HRP)-conjugated secondary antibody (goat anti- rabbit IgG-HRP [SC-2357; 1:2,500], goat anti-mouse IgG-HRP [SC-516102; 1:2,500], and mouse anti-goat IgG-HRP [SC- 2354; 1:2,500] from Santa Cruz Biotechnology) diluted in
TBS-T for 30 minutes at RT. The immunoreactive bands were detected by SuperSignal West Pico Chemiluminescent Sub- strate (34078; Thermo Fisher Scientific, Waltham, MA, USA).
Quantification of triglyceride levels
TG levels from WT BMDMs were measured by Triglyceride Quantification Colorimetric/Fluorometric Kit (K622; BioVi- sion Inc., Milpitas, CA, USA), according to the manufacturer’s instructions.
Intracellular Ca2+ flux assays
WT BMDMs (2×10⁴ cells/well in 96-well cell culture dish) were incubated with LPS (500 ng/mL, 4 hous), and were then treated with PA-BSA (500 μM, 2 hours). Intracellular Ca2+ lev- els were measured by Fluo-8 Calcium Flux Assay Kit-No Wash (Abcam, ab112129). Cells were incubated with Fluo-8 for 0.5 hour at 37°C and 0.5 hour at RT in calcium-free Hanks’ bal- anced salt solution, according to the manufacturer’s instruc- tions. Fluorescence intensity was measured at Ex/Em=(490/
525) nm.
Cytokine analysis
Supernatants from BMDMs were measured for mouse IL-1β (MLB00C; R&D Systems), mouse IL-18 (7625; R&D systems), and mouse TNF-α (MTA00B; R&D Systems), according to the manufacturer’s instructions.
ASC oligomerization and ASC speck formation
WT BMDMs (5×10⁶ cells in 100 mm cell culture dish) were harvested and lysed in 500 μL of lysis buffer (20 mM 4-(2-hy- droxyethyl)-1-piperazineethanesulfonic acid-potassium hy- droxide [HEPES-KOH], pH 7.5, 150 mM KCl, 1% NP-40). Ly- sates were centrifuged at 330 g for 10 minutes at 4°C. The pel- lets were washed in 1 mL of PBS, and resuspended in 500 μL of PBS. The 2 mM disuccinimydyl suberate (21555; ThermoFish- er Scientific) was added to the resuspended pellets, which were incubated for 30 minutes with rotation at RT. Samples were then centrifuged at 330 g for 10 minutes at 4°C. The superna- tant was removed, and the cross-linked pellets were resus- pended in 50 μL of Laemmli sample buffer. Samples were ana- lyzed by immunoblot analysis using polyclonal ASC antibody (ADI-905-173-100; Enzo Lifesciences). WT BMDMs were seeded on chamber slides. After stimulation, cells were fixed with 4% paraformaldehyde, and then incubated with poly- clonal ASC antibody (ADI-905-173-100; Enzo Lifesciences)
for 16 hours, followed by DAPI (P36962; ThermoFisher Scien- tific) staining, as previously described [9,19,20]. ASC specks were analyzed by Zeiss LSM880 laser-scanning confocal mi- croscope, and quantified using ImageJ software 1.52a (Bethes- da, MD, USA). The graph represents the quantification of per- cent of ASC speck positive cells for each mouse.
PF-04620110 treatment in mice fed with high-fat diet C57BL/6J mice (male, 6 weeks old) with similar plasma glu- cose levels and body weights were used. For generation of HFD‐induced diabetic mice, C57BL/6J mice were fed HFD with 0.15% cholesterol (HFD, 21% crude fat, 0.15% cholesterol, and 19.5% casein; Altromin, Germany) or regular diet (RD), for 12 weeks. For treatment of PF-04620110, PF-04620110 or vehicle control (dimethyl sulfoxide [DMSO]) were fed once a day at the dose of 3 mg/kg for another 4 weeks.
Blood glucose assay
Glucose levels in blood collected from the tail vein were deter- mined using a One Touch® Ultra® Blood Glucose Test System Kit (Lifespan Co., Providence, RI, USA).
Statistical analysis
All data are mean±standard deviation, combined from three independent experiments. All statistical tests were analyzed by Student’s two-tailed t-test for comparison of two groups, and analysis of variance (ANOVA) (with post hoc comparisons us- ing Dunnett’s test), using a statistical software package (Graph- Pad Prism version 4.0; GraphPad Software Inc., San Diego, CA, USA) for comparison of multiple groups. P values of less than 0.05 were considered statistically significant.
RESULTS
PF-04620110 suppressed fatty acid-induced NLRP3 inflammasome activation
To investigate the function of PF-04620110 on fatty acid-in- duced NLRP3 inflammasome activation, we examined wheth- er PF-04620110 could suppress the secretion of IL-1β and IL- 18 in LPS-primed BMDMs in response to palmitate conjugat- ed with fatty acid-free BSA (PA-BSA), a specific NLRP3 in- flammasome activator. PF-04620110 treatment significantly reduced IL-1β and IL-18 secretion in response to PA–BSA compared to vehicle control (Fig. 1A), whereas the secretion of TNF-α, which is an indicator of toll-like receptor 4 (TLR4) sig-
naling [21,22], was unchanged (Fig. 1A). Moreover, PF- 04620110 treatment suppressed IL-1β secretion in a dose-de- pendent manner, in response to PA–BSA relative to vehicle control (Fig. 1B). Similarly, PF-04620110 treatment signifi- cantly decreased IL-1β and IL-18 secretion in response to nige- ricin or ATP, which are other specific activators of NLRP3 in- flammasome, compared to vehicle control, whereas the secre- tion of TNF-α was unchanged (Supplementary Fig. 1). More- over, the levels of DGAT1 expression were elevated by PA–
BSA, nigericin, or ATP stimulation in LPS-primed BMDMs, whereas LPS-only treatment did not affect DGAT1 expression.
In contrast, poly(dA:dT), an AIM2 inflammasome activator, or flagellin, a NLRC4 inflammasome activator did not change the expression of DGAT1 in LPS-primed BMDMs (Supplementa- ry Fig. 2). Consistently, PF-04620110 treatment did not change the secretion of IL-1β and IL-18 in response to poly(dA:dT), an AIM2 inflammasome activator, or flagellin, a NLRC4 in- flammasome activator compared to vehicle control (Fig. 1C).
Consistent with IL-1β and IL-18 secretion, PF-04620110 treat- ment suppressed the expression of cleaved caspase-1 and cleaved IL-1β in response to LPS and PA–BSA stimulation compared to vehicle control, whereas the expression of pro- caspase-1 and pro-IL-1β expression was unchanged (Fig. 1D).
These results suggest that PF-04620110 suppressed fatty acid- induced NLRP3 inflammasome activation.
PF-04620110 inhibits K+ efflux and the formation of ASC specks for NLRP3 inflammasome activation
We next investigated the underlying molecular mechanism by which PF-04620110 regulates NLRP3 inflammasome activa- tion. We examined whether the inhibition of TG synthesis by PF-04620110 could suppress K+ efflux, which is an important mechanism for fatty acid-induced NLRP3 inflammasome acti- vation [6,23]. First, we analyzed the effect of PF-04620110 on the TG synthesis during NLRP3 inflammasome activation. We measured the TG levels in LPS-primed WT BMDMs pre- treated with PF-04620110 before PA-BSA stimulation. PF- 04620110 treatment significantly reduced the levels of TG in response to LPS and PA-BSA, compared to vehicle control (Fig. 2A). Moreover, PF-04620110 treatment reduced TG syn- thesis in a dose-dependent manner in response to PA-BSA, relative to vehicle control (Fig. 2B). Notably, PF-04620110 treatment significantly suppressed Ca2+ influx by K+ efflux in response to LPS and PA-BSA stimulation, compared to vehicle control (Fig. 2C). Moreover, PF-04620110 showed the similar
Fig. 1. PF-04620110 suppresses fatty acid-induced nucleotide-binding domain, leucine-rich-repeat-containing receptor (NLR), pyrin-domain-containing 3 (NLRP3) inflammasome activation. (A) Quantification of interleukin 1β (IL-1β; left), IL-18 (middle), and tumor necrosis factor α (TNF-α; right) secretion from wild-type (WT) bone marrow-derived macrophages (BMDMs) were pretreated with PF-04620110 (50 μM, 2 hours) or dimethyl sulfoxide (DMSO) (control), followed by incubation with palmitate–
bovine serum albumin (PA-BSA) after lipopolysaccharide (LPS) stimulation (n=10 mice per group). (B) Quantification of IL-1β secretion from WT BMDMs that were pretreated with PF-04620110 in a dose-dependent manner (12.5, 25, 50, or 100 μM, 2 hours) or DMSO (control), followed by incubation with PA-BSA after LPS stimulation (n=10 mice per group). (C) Quantifica- tion of IL-1β secretion from WT BMDMs that were pretreated with PF-04620110 (50 μM, 2 hours) or DMSO (control), followed by incubation with poly(dA:dT) or flagellin after LPS stimulation (n=10 mice per group). (D) Representative immunoblot analy- sis for caspase-1 and IL-1β (left), and densitometry quantification of caspase-1 p10 and IL-1β p17 levels (normalized to levels of β-actin) (right), from WT BMDMs that were pretreated with PF-04620110 (50 μM, 2 hours) or DMSO, followed by incubation with PA-BSA after LPS stimulation. For immunoblots, β-actin was used as loading control (n=6 mice per group). Data are mean±standard deviation. aP<0.001, bP<0.01, cP<0.05 by two-tailed t-test or analysis of variance.
0.6 0.4 0.2 0
0.5 0.4 0.3 0.2 0.1 0
5 4 3 2 1 0
4 3 2 1 0 0.3
0.2 0.1 0
0.8 0.6 0.4 0.2 0
1.0 0.8 0.6 0.4 0.2 0
0.4 0.3 0.2 0.1 0
IL-1β (ng/mL)IL-1β (ng/mL) Fold change/β-actin Fold change/β-actin
IL-18 (ng/mL)IL-1β (ng/mL) TNF-α (ng/mL)IL-18 (ng/mL)
− + + − − + + −
− + + + + +
− + − + − + − + − + + − − + + −
− − + + − − + +
− + + − − + + −
− + + − + +
− + + − − + + −
− + + − + + LPS
LPS+PA-BSA
LPS LPS
PA-BSALPS
Pro-caspase-1 −45
Caspase-1 p10 −10
Pro-IL-1β −31
IL-1β p17 −17
β-Actin −42
Mr (kDa)
LPS
LPS
LPS
LPS − − + + − − + +
− − 12.5 25 50 100
− + − + − + − + − − + + − − + +
− + − − + − − − + − − +
− − + + − − + +
− + − − + − − − + − − + PA-BSA
PF-04620110 (μm)
PA-BSA PA-BSA
PA-BSA
Poly(dA:dT) Flagellin
PA-BSA
Poly(dA:dT) Flagellin DMSO
DMSO
DMSO
Caspase-1 p10 IL-1β p17 DMSO
DMSO PF-04620110
PF-04620110
PF-04620110 PF-04620110
PF-04620110
b
b
b b
b
c b
a
b
A
B C
D
0.4 0.3 0.2 0.1 0
0.6 0.4 0.2 0
0.3 0.2 0.1 0
1.0 0.8 0.6 0.4 0.2 0 0.5
0.4 0.3 0.2 0.1 0
1.6 1.4 1.2 1.0
iglycerides levelsTr IL-1β (ng/mL)(nmol/μg) IL-18 (ng/mL) (ng/mL)-αTNF 0.8
Triglycerides levels (nmol/μg) Relative fluorescence intensity (Ex/Em=490/525 nm)
− + + − − + + −
− + + − − + + − − + + − − + + − − + + − − + + − − + + − − + + − − + + −
− + + + + + 0 10 20 30 40 50 60
LPS
LPS LPS LPS
LPS+PA-BSA − − + + − − + +
− − + + − − + + − − + + − − + + − − + + − − + + − − + + − − + + − − + +
− − 12.5 25 50 100 Time (min) PA-BSA
PA-BSA PA-BSA PA-BSA
PF-04620110 (μM) DMSO
DMSO
DMSO DMSO
PF-04620110
PF-04620110 KCI
PF-04620110 PF-04620110
b
b b
b b
b b
a
A B C
c
4 3 2 1 0
4 3 2 1
Fold change/β-actin Fold change/β-actin 0
− + − + − + − + − + − + − + + − − + + − − + + −
− − + + − − + + − − + +
LPS LPS
LPS
−LPS +LPS
PA-BSA
−PA-BSA +PA-BSA
Pro-caspase-1 −45
Caspase-1 p10 −10
Pro-IL-1β −31
IL-1β p17 −17
β-Actin −42
Mr (kDa)
− + − + − + − + − + − +
PA-BSA PA-BSA
DMSO
Caspase-1 p10 IL-1β p17
DMSO PF-04620110 KCI PF-04620110 KCI
b b b
b
DMSO
PF-04620110
50 40 30 20 10 0 The percent of ASC speck+ cells for each mouse (%)
− + − +
LPS − + − +
PA-BSA
DMSO PF-04620110
b
F
(Continued to the next page) Fig. 2.
D
E
inhibition effects to the presence of high extracellular K+ con- centrations on the expression of cleaved caspase-1 and cleaved IL-1β (Fig. 2D) and the production of IL-1β (Fig. 2E) during NLRP3 inflammasome activation. Furthermore, we examined whether PF-04620110 could suppress the formation of ASC specks, which is required for NLRP3-dependent caspase-1 ac- tivation [9]. The formation of ASC specks by NLRP3 inflam- masome complex in each cell was analyzed by fluorescent pro- tein tagged ASC. PF-04620110 treatment inhibited the forma- tion of ASC specks in response to LPS and PA-BSA, compared to vehicle control (Fig. 2F). These results suggest that PF- 04620110 treatment suppressed K+ efflux and the formation of ASC specks during NLRP3 inflammasome activation.
Genetic inhibition of DGAT1 suppresses fatty acid- induced NLRP3 inflammasome activation
Since DGAT1 is the selective target of PF-04620110 [16,17], we investigated whether the genetic inhibition of DGAT1 could suppress NLRP3 inflammasome activation. We used two independent DGAT1-targeted gRNAs to delete mouse DGAT1 in WT BMDMs via CRISPR RNP system. The genetic inhibi- tion of DGAT1 by Dgat1 gRNAs (Dgat1 gRNA#1 and Dgat1 gRNA#2) significantly suppressed DGAT1 protein expression, relative to control (Control) (Supplementary Fig. 3). Notably, genetic inhibition of DGAT1 by Dgat1 gRNAs (Dgat1 gRNA#1 and Dgat1 gRNA#2) suppressed the expression of DGAT1,
cleaved caspase-1 p10, and cleaved IL-1β p17 in response to LPS and PA-BSA stimulation, compared to control (Control), although pro-IL-1β expression was unchanged (Fig. 3A). Con- sistently, the genetic inhibition of DGAT1 by Dgat1 gRNAs (Dgat1 gRNA#1 and Dgat1 gRNA#2) significantly reduced IL- 1β and IL-18 secretion in response to PA-BSA, compared to control (Control) (Fig. 3B), whereas, the secretion of TNF-α was unchanged (Fig. 3B). Moreover, the genetic inhibition of DGAT1 by Dgat1 gRNAs (Dgat1 gRNA#1 and Dgat1 gRNA#2) suppressed the expression of DGAT1, cleaved caspase-1 p10, and cleaved IL-1β p17 in response to LPS and nigericin stimu- lation, compared to control (Control), although pro-IL-1β ex- pression was unchanged (Supplementary Fig. 4A). Further- more, the genetic inhibition of DGAT1 by Dgat1 gRNAs (Dgat1 gRNA#1 and Dgat1 gRNA#2) significantly decreased IL-1β and IL-18 secretion in response to nigericin or ATP, compared to control, whereas the secretion of TNF-α was un- changed (Supplementary Fig. 4B). In contrast, genetic inhibi- tion of DGAT1 by Dgat1 gRNAs (Dgat1 gRNA#1 and Dgat1 gRNA#2) did not affect the secretion of IL-1β and IL-18 in re- sponse to poly(dA:dT), an AIM2 inflammasome activator, or flagellin, a NLRC4 inflammasome activator, relative to control (Control) (Fig. 3C). These results suggest that the genetic inhi- bition of DGAT1 suppressed NLRP3 inflammasome activa- tion.
Fig. 2. Continued. PF-04620110 inhibits K+ efflux and the formation of apoptosis-associated speck-like protein containing a cas- pase recruitment domain (ASC) specks during nucleotide-binding domain, leucine-rich-repeat-containing receptor (NLR), pyrin-domain-containing 3 (NLRP3) inflammasome activation. (A) Quantification of triglyceride levels from wild-type (WT) bone marrow-derived macrophages (BMDMs) that were pretreated with PF-04620110 (50 μM, 2 hours) or dimethyl sulfoxide (DMSO; control), followed by incubation with palmitate–bovine serum albumin (PA-BSA) after lipopolysaccharide (LPS) stimu- lation (n=10 mice per group). (B) Quantification of triglyceride levels from WT BMDMs that were pretreated with PF-04620110 in a dose-dependent manner (12.5, 25, 50, or 100 μM, 2 hours) or DMSO (control), followed by incubation with PA-BSA after LPS stimulation (n=10 mice per group). (C) Intracellular Ca2+ flux assays from WT BMDMs that were pretreated with PF- 04620110 (50 μM, 2 hours) or DMSO (control), followed by incubation with PA-BSA after LPS stimulation (n=3 mice per group).
(D) Quantification of interleukin 1β (IL-1β; left), IL-18 (middle), and tumor necrosis factor α (TNF-α; right) secretion from WT BMDMs that were pretreated with PF-04620110 (50 μM, 2 hours), KCl (100 mM, 1 hour), or DMSO (control), followed by incu- bation with PA-BSA after LPS stimulation (n=6 mice per group). (E) Representative immunoblot analysis for caspase-1 and IL- 1β (left), and densitometry quantification of caspase-1 p10 and IL-1β p17 levels (normalized to levels of β-actin) (right), from WT BMDMs that were pretreated with PF-04620110 (50 μM, 2 hours), KCl (100 mM, 1 hour), or DMSO, followed by incubation with PA-BSA after LPS stimulation. For immunoblots, β-actin was used as loading control (n=6 mice per group). (F) Representative immunofluorescence images (total 100 cells in 15 individual images per group; left), and quantification (right), of ASC speck for- mation (white arrows) (the percent of ASC speck positive cells for each mouse) in WT BMDMs that were pretreated with PF- 04620110 (50 μM, 2 hours) or DMSO, followed by incubation with adenosine triphosphate (ATP) after LPS stimulation. Scale bars, 20 μm (n=5 mice per group). Data are mean±standard deviation. Data are representative of three independent experi- ments, and each was done in triplicate. aP<0.001, bP<0.01, cP<0.05 by two-tailed t-test or analysis of variance.
4 3 2 1 0
4 3 2 1 0
5 4 3 2 1
ld change/β-actinFo haFold cnge/β-actin nge/β-actinhald cFo 0
− + − + − + − + − + − + − + − + − + − + + − − + + − − + + −
− − + + − − + + − − + +
LPS LPS LPS
PA-BSALPS DGAT1 Pro-caspase-1
−55
−45
Caspase-1 p10 −10
Pro-IL-1β −31
IL-1β p17 −17
β-Actin −42
Mr (kDa)
− + − + − + − + − + − + − + − + − +
PA-BSA PA-BSA PA-BSA
Control
Caspase-1 p10
DGAT1 IL-1β p17
Control Dgat1
gRNA #1 Dgat1
gRNA #2 Dgat1 gRNA #1 Dgat1 gRNA #2
b
b a
a
a a
a
a a
Fig. 3. Genetic inhibition of diacylglycerol acyltransferase-1 (DGAT1) suppresses fatty acid-induced nucleotide-binding domain, leucine-rich-repeat-containing receptor (NLR), pyrin-domain-containing 3 (NLRP3) inflammasome activation. (A) Representa- tive immunoblot analysis for DGAT1, caspase-1, and interleukin 1β (IL-1β; left), and densitometry quantification of DGAT1, caspase-1 p10, and IL-1β p17 levels (normalized to levels of β-actin; right), from wild-type (WT) bone marrow-derived macro- phages (BMDMs) were transduced with two independent Dgat1-targeting gRNAs (Dgat1 gRNA #1 and Dgat1 gRNA #2), or with a control plasmid (control), and were stimulated with lipopolysaccharide (LPS) and palmitate–bovine serum albumin (PA-BSA).
For immunoblots, β-actin was used as loading control (n=5 mice per group). (B) Quantification of IL-1β (left), IL-18 (middle), and tumor necrosis factor α (TNF-α; right) secretion from WT BMDMs were transduced with two independent Dgat1-targeting gRNAs (Dgat1 gRNA #1 and Dgat1 gRNA #2), or with a control plasmid (control), and were stimulated with LPS and PA-BSA (n=10 mice per group). (C) Quantification of IL-1β and IL-18 secretion from WT BMDMs that were transduced with two inde- pendent Dgat1-targeting gRNAs (Dgat1 gRNA #1 and Dgat1 gRNA #2), or with a control plasmid (control), and were incubated with poly(dA:dT) or flagellin after LPS stimulation (n=10 mice per group). Data are mean±standard deviation. aP<0.01,
bP<0.05, by two-tailed t-test or analysis of variance.
Control
Control
Dgat1 gRNA #1
Dgat1 gRNA #1
Dgat1 gRNA #2
Dgat1 gRNA #2 0.5
0.4 0.3 0.2 0.1 0
1.0 0.8 0.6 0.4 0.2 0
0.6 0.4 0.2 0 0.3 0.2 0.1 0
1.0 0.8 0.6 0.4 0.2 0
IL-1β (ng/mL) IL-1β (ng/mL) IL-18 (ng/mL)
IL-18 (ng/mL) TNF-α (ng/mL)
− + + − − + + − − + + −
+ + + + + + + + + + + +
− + + − − + + − − + + − − + + − − + + − − + + − LPS
LPS LPS
LPS LPS
− − + + − − + + − − + +
+ + + − − − + + + − − −
− − − + + + − − − + + +
− − + + − − + + − − + + − − + + − − + + − − + + PA-BSA
Poly(dA:dT) Poly(dA:dT)
Flagellin Flagellin
PA-BSA PA-BSA
a a
a a
A
B
C
Genetic inhibition of DGAT1 suppresses K+ efflux and the formation of ASC specks for NLRP3 inflammasome activation
Next, we investigated whether genetic inhibition of DGAT1 could suppress K+ efflux and the formation of ASC specks in NLRP3 inflammasome activation. First, we analyzed the effect of DGAT1 genetic inhibition on TG synthesis during NLRP3 inflammasome activation.
Genetic inhibition of DGAT1 by Dgat1 gRNA (Dgat1 gRNA) significantly reduced the levels of TG in response to LPS and
PA-BSA stimulation, compared to control (Control) (Fig. 4A).
Notably, the genetic inhibition of DGAT1 by Dgat1 gRNA sig- nificantly suppressed Ca2+ influx by K+ efflux in response to LPS and PA-BSA stimulation, compared to vehicle control (Fig. 4B). Next, we measured the formation of ASC specks by NLRP3 inflammasome complex in each cell, which was ana- lyzed by fluorescent protein tagged ASC. The genetic inhibi- tion of DGAT1 by Dgat1 gRNA showed significantly lower formation of specks that were induced by LPS and PA-BSA stimulation, compared to control (Fig. 4C). These results sug-
Fig. 4. Deficiency of diacylglycerol acyltransferase-1 (DGAT1) suppressed K+ efflux and the formation of apoptosis-associated speck-like protein containing a caspase recruitment domain (ASC) specks during nucleotide-binding domain, leucine-rich-re- peat-containing receptor (NLR), pyrin-domain-containing 3 (NLRP3) inflammasome activation. (A) Quantification of triglycer- ide levels from wild-type (WT) bone marrow-derived macrophages (BMDMs) that were transduced with Dgat1-targeting gRNAs (Dgat1 gRNA), or with a control plasmid (control), and that were stimulated with lipopolysaccharide (LPS) and palmitate–bovine serum albumin (PA-BSA) (n=10 mice per group). (B) Intracellular Ca2+ flux assays from WT BMDMs that were transduced with Dgat1-targeting gRNAs (Dgat1 gRNA), or with a control plasmid (control), and that were stimulated with PA-BSA stimulation after LPS incubation (n=3 mice per group). (C) Representative immunofluorescence images (total 100 cells in 15 individual im- ages per group) (left), and quantification (right), of ASC speck formation (white arrows) (the percent of ASC speck positive cells for each mouse) in WT BMDMs that were transduced with Dgat1-targeting gRNAs (Dgat1 gRNA), or with a control plasmid (control), and that were stimulated with LPS and PA-BSA. Scale bars, 20 μm (n=5 mice per group). Data are mean±standard de- viation. aP<0.01, by two-tailed t-test or analysis of variance.
−LPS +LPS
−PA-BSA +PA-BSA
Control
Dgat1 gRNA
60
40
20
0 The percent of ASC speck+ cells for each mouse (%)
− + − +
LPS − + − +
PA-BSA
Control Dgat1 gRNA
a
C 0.5
0.4 0.3 0.2 0.1 0
1.8 1.6 1.4 1.2 1.0
Triglycerides levels (nmol/μg) ivelatRe fluorescence intensity x/Em=490/525 nm)(E 0.8
− + + − − + + − 0 10 20 30 40 50 60
LPS − − + + − − + + Time (min)
PA-BSA
a
a
A B
Control Dgat1 gRNA Control Dgat1 gRNA
gest that the genetic inhibition of DGAT1 suppressed K+ efflux and the formation of ASC specks for NLRP3 inflammasome activation.
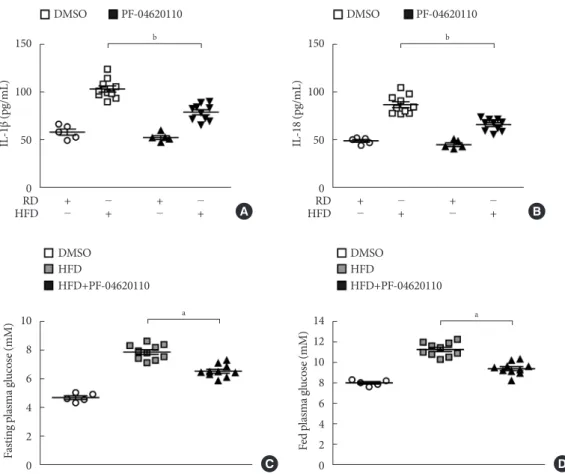
PF-04620110 suppressed HFD-induced IL-1β and IL-18 production in mice
We next investigated the effects of PF-04620110 treatment in HFD-induced diabetic mice. We first measured the levels of IL-1β and IL-18 in plasma from WT mice fed with HFD for 12 weeks, and then treated with PF-04620110 or vehicle control (DMSO) once a day at the dose of 3 mg/kg for another 4 weeks. The levels of IL-1β and IL-18 in plasma were increased in plasma from WT mice fed with HFD relative to mice fed with RD (Fig. 5A and B). PF-04620110 treatment resulted in lower plasma levels of IL-1β and IL-18 in WT mice fed with
HFD, compared to vehicle-treated control mice (Fig. 5A and B). Moreover, PF-04620110 treatment reduced the levels of fasting or basal blood glucose in WT mice fed with HFD, rela- tive to vehicle control (Fig. 5C and D). These results suggest that PF-04620110 suppressed HFD-induced IL-1β and IL-18 production in mice.
DISCUSSION
Here we demonstrate that PF-04620110 suppresses fatty acid- induced NLRP3 inflammasome activation. We show that PF- 04620110 inhibits TG synthesis and the formation of ASC specks for NLRP3 inflammasome activation in macrophages.
Moreover, we demonstrate that PF-04620110 reduces HFD- derived IL-1β and IL-18 production in the plasma from mice.
Fig. 5. PF-04620110 suppressed high-fat diet (HFD)-induced interleukin 1β (IL-1β) and IL-18 production in mice. Quantifica- tion of (A) IL-1β (left), (B) IL-18 (right) levels in plasma from wild-type (WT) mice fed HFD or regular diet (RD) for 12 weeks, and then treated with PF-04620110 or vehicle control (dimethyl sulfoxide [DMSO]) once a day at the dose of 3 mg/kg for another 4 weeks (RD n=5, HFD n=10; RD+PF-04620110 n=5, HFD+PF-04620110 n=10). (C) Fasting and (D) fed blood glucose levels from WT mice fed HFD or RD for 12 weeks, and then treated with PF-04620110 or vehicle control (DMSO) once a day at the dose of 3 mg/kg for another 4 weeks (RD n=5, HFD n=10, HFD+PF-04620110 n=10). Data are mean±standard deviation.
aP<0.01, bP<0.05, by two-tailed t-test or analysis of variance.
150
100
50
0
10 8 6 4 2 0
150
100
50
0
14 12 10 8 6 4 2 0
IL-1β (pg/mL)Fasting plasma glucose (mM) IL-18 (pg/mL) Fed plasma glucose (mM)
+ − + − + − + −
RD RD
− + − + − + − +
HFD HFD
DMSO
DMSO DMSO
HFD HFD
HFD+PF-04620110 HFD+PF-04620110
DMSO
PF-04620110 PF-04620110
b
a
b
a
A
C
B
D
Furthermore, we show that the genetic inhibition of DGAT1 suppresses NLRP3 inflammasome activation in macrophages.
The NLRP3 inflammasome activation is implicated in the progression of T2DM as an important component of chronic inflammation [5-7]. Among the various activators of NLRP3 inflammasome, elevated fatty acid is one of the major activa- tors of NLRP3 inflammasome in patients with T2DM [6].
Therefore, the inhibition of fatty acid-induced NLRP3 inflam- masome activation could be a potential pharmacologic target of chronic inflammation in T2DM. Our results showed that PF-04620110 suppresses fatty acid-induced NLRP3 inflamma- some activation in macrophages. Moreover, we showed that PF-04620110 treatment suppresses HFD-derived IL-1β and IL-18 production and blood glucose levels in mice. Although the development of PF-04620110 was reported as a potent an- ti-diabetic agent [16], the function of PF-04620110 in the regu- lation of NLRP3 inflammasome-dependent chronic inflam- mation is not well understood. Our results suggest that PF- 04620110 could be a potential pharmacologic inhibitor for fat- ty acid-induced chronic inflammation in T2DM.
Recent studies reported that potential drug or chemical can- didates have been identified as the NLRP3 inflammasome in- hibitor [24-29]. The potential NLRP3 inflammasome inhibi- tors, such as MCC950, CY-09, OLT1177, Tranilast, and Orido- nin, were validated in vitro, and in a mouse model including Parkinson’s disease, acute arthritis, or HFD‐induced diabetes [24-29]. Each potential NLRP3 inflammasome inhibitor re- duced NLRP3 inflammasome activation via the regulation of upstream signaling events of NLRP3 inflammasome activa- tion, such as potassium efflux and mitochondrial damage [24- 29]. In our study, we found that the inhibition of TG synthesis by PF-04620110 treatment or DGAT1 deficiency suppresses K+ efflux and the formation of ASC specks, which is required for NLRP3 inflammasome activation. Since K+ efflux is an im- portant mechanism for fatty acid-induced NLRP3 inflamma- some activation [23], our results suggest that PF-04620110 could be a specific inhibitor for fatty acid-induced NLRP3 in- flammasome activation by regulating K+ efflux. Recent studies have shown that the inhibition of DGAT1 promotes weight loss, reduction of TGs, and improved insulin sensitivity [16,30, 31]. In contrast, a previous paper suggests that the over-expres- sion of DGAT1 contributes to the reduction of M1 inflamma- tory gene expression, such as IL-6 or TNF-α, in aP2-Dgat1 BMDMs treated with palmitate for 24 hours [32]. Since long- term exposure to fatty acids can affect cellular function [33],
DGAT1-induced lipid droplets might be a negative regulator in their system. However, our results showed that DGAT1 in- hibition did not change TNF-α in response to short-term stimulation with PA-BSA for 3 hours in LPS-primed BMDMs in our system. Consistent with recent studies [16,30,31], our results suggest that the inhibition of DGAT1 can regulate im- proved insulin sensitivity by the inhibition of fatty acid-in- duced NLRP3 inflammasome activation. Given the previous findings, the regulation of DGAT1-mediated lipid droplets in NLRP3 inflammasome activation needs to be considered by further studies. Although the effects of DGAT1 inhibition in the changes of metabolic phenotype were reported [16,31], the function of DGAT1 in the regulation of NLRP3 inflamma- some-dependent chronic inflammation is not well understood.
Our results suggest that the DGAT1-dependent TG synthesis pathway is critical for fatty acid-induced NLRP3 inflamma- some activation via K+ efflux and NLRP3 inflammasome com- plex formation.
In conclusion, our current findings demonstrate that the in- hibition of NLRP3 inflammasome by PF-04620110 could be a potential therapeutic target of fatty acid-induced chronic in- flammation in T2DM.
SUPPLEMENTARY MATERIALS
Supplementary materials related to this article can be found online at https://doi.org/10.4093/dmj.2019.0112.
CONFLICTS OF INTEREST
No potential conflict of interest relevant to this article was re- ported.
AUTHOR CONTRIBUTIONS
Conceived of the study: S.I.J., J.H.B., J.S.M.
Performed the in vitro and in vivo experiments: S.I.J., J.H.B., S.J.K., J.M.L., J.H.J., J.S.M.
Wrote the paper: S.I.J., J.H.B., J.S.M.
Supervised the entire project: J.S.M.
ORCID
Seung Il Jo https://orcid.org/0000-0001-9638-5969 Jong-Seok Moon https://orcid.org/0000-0002-2537-7854
ACKNOWLEDGMENTS
This work was supported by the Soonchunhyang University Research Fund and National Research Foundation of Korea (NRF-2019M3E5D1A02069071) (to Jong-Seok Moon).
REFERENCES
1. Franchi L, Eigenbrod T, Munoz-Planillo R, Nunez G. The in- flammasome: a caspase-1-activation platform that regulates immune responses and disease pathogenesis. Nat Immunol 2009;10:241-7.
2. Sutterwala FS, Ogura Y, Szczepanik M, Lara-Tejero M, Lich- tenberger GS, Grant EP, Bertin J, Coyle AJ, Galan JE, Askenase PW, Flavell RA. Critical role for NALP3/CIAS1/cryopyrin in innate and adaptive immunity through its regulation of cas- pase-1. Immunity 2006;24:317-27.
3. Tschopp J, Schroder K. NLRP3 inflammasome activation: the convergence of multiple signalling pathways on ROS produc- tion? Nat Rev Immunol 2010;10:210-5.
4. Latz E, Xiao TS, Stutz A. Activation and regulation of the in- flammasomes. Nat Rev Immunol 2013;13:397-411.
5. Hotamisligil GS. Inflammation and metabolic disorders. Na- ture 2006;444:860-7.
6. Wen H, Gris D, Lei Y, Jha S, Zhang L, Huang MT, Brickey WJ, Ting JP. Fatty acid-induced NLRP3-ASC inflammasome acti- vation interferes with insulin signaling. Nat Immunol 2011;12:
408-15.
7. Youm YH, Nguyen KY, Grant RW, Goldberg EL, Bodogai M, Kim D, D’Agostino D, Planavsky N, Lupfer C, Kanneganti TD, Kang S, Horvath TL, Fahmy TM, Crawford PA, Biragyn A, Alnemri E, Dixit VD. The ketone metabolite β-hydroxybutyrate blocks NLRP3 inflammasome-mediated inflammatory disease.
Nat Med 2015;21:263-9.
8. Moon JS, Hisata S, Park MA, DeNicola GM, Ryter SW, Naka- hira K, Choi AMK. mTORC1-induced HK1-dependent gly- colysis regulates NLRP3 inflammasome activation. Cell Rep 2015;12:102-15.
9. Moon JS, Nakahira K, Chung KP, DeNicola GM, Koo MJ, Pa- bon MA, Rooney KT, Yoon JH, Ryter SW, Stout-Delgado H, Choi AM. NOX4-dependent fatty acid oxidation promotes NLRP3 inflammasome activation in macrophages. Nat Med 2016;22:1002-12.
10. Spranger J, Kroke A, Mohlig M, Hoffmann K, Bergmann MM, Ristow M, Boeing H, Pfeiffer AF. Inflammatory cytokines and
the risk to develop type 2 diabetes: results of the prospective population-based European Prospective Investigation into Cancer and Nutrition (EPIC)-Potsdam Study. Diabetes 2003;
52:812-7.
11. Mandrup-Poulsen T. The role of interleukin-1 in the pathogen- esis of IDDM. Diabetologia 1996;39:1005-29.
12. Maedler K, Sergeev P, Ris F, Oberholzer J, Joller-Jemelka HI, Spinas GA, Kaiser N, Halban PA, Donath MY. Glucose-in- duced beta cell production of IL-1beta contributes to glucotox- icity in human pancreatic islets. J Clin Invest 2002;110:851-60.
13. Jager J, Gremeaux T, Cormont M, Le Marchand-Brustel Y, Tanti JF. Interleukin-1beta-induced insulin resistance in adipo- cytes through down-regulation of insulin receptor substrate-1 expression. Endocrinology 2007;148:241-51.
14. Lagathu C, Yvan-Charvet L, Bastard JP, Maachi M, Quignard- Boulange A, Capeau J, Caron M. Long-term treatment with in- terleukin-1beta induces insulin resistance in murine and hu- man adipocytes. Diabetologia 2006;49:2162-73.
15. Boden G. Interaction between free fatty acids and glucose me- tabolism. Curr Opin Clin Nutr Metab Care 2002;5:545-9.
16. Dow RL, Li JC, Pence MP, Gibbs EM, LaPerle JL, Litchfield J, Piotrowski DW, Munchhof MJ, Manion TB, Zavadoski WJ, Walker GS, McPherson RK, Tapley S, Sugarman E, Guzman- Perez A, DaSilva-Jardine P. Discovery of PF-04620110, a po- tent, selective, and orally bioavailable inhibitor of DGAT-1.
ACS Med Chem Lett 2011;2:407-12.
17. Enayetallah AE, Ziemek D, Leininger MT, Randhawa R, Yang J, Manion TB, Mather DE, Zavadoski WJ, Kuhn M, Treadway JL, des Etages SA, Gibbs EM, Greene N, Steppan CM. Modeling the mechanism of action of a DGAT1 inhibitor using a causal reasoning platform. PLoS One 2011;6:e27009.
18. King AJ, Segreti JA, Larson KJ, Souers AJ, Kym PR, Reilly RM, Zhao G, Mittelstadt SW, Cox BF. Diacylglycerol acyltransferase 1 inhibition lowers serum triglycerides in the Zucker fatty rat and the hyperlipidemic hamster. J Pharmacol Exp Ther 2009;
330:526-31.
19. Lu A, Magupalli VG, Ruan J, Yin Q, Atianand MK, Vos MR, Schroder GF, Fitzgerald KA, Wu H, Egelman EH. Unified po- lymerization mechanism for the assembly of ASC-dependent inflammasomes. Cell 2014;156:1193-206.
20. Yu JW, Wu J, Zhang Z, Datta P, Ibrahimi I, Taniguchi S, Sagara J, Fernandes-Alnemri T, Alnemri ES. Cryopyrin and pyrin acti- vate caspase-1, but not NF-kappaB, via ASC oligomerization.
Cell Death Differ 2006;13:236-49.
21. Horwood NJ, Mahon T, McDaid JP, Campbell J, Mano H,
Brennan FM, Webster D, Foxwell BM. Bruton’s tyrosine kinase is required for lipopolysaccharide-induced tumor necrosis fac- tor alpha production. J Exp Med 2003;197:1603-11.
22. Horwood NJ, Page TH, McDaid JP, Palmer CD, Campbell J, Mahon T, Brennan FM, Webster D, Foxwell BM. Bruton’s tyro- sine kinase is required for TLR2 and TLR4-induced TNF, but not IL-6, production. J Immunol 2006;176:3635-41.
23. Schroder K, Tschopp J. The inflammasomes. Cell 2010;140:
821-32.
24. Coll RC, Robertson AA, Chae JJ, Higgins SC, Munoz-Planillo R, Inserra MC, Vetter I, Dungan LS, Monks BG, Stutz A, Cro- ker DE, Butler MS, Haneklaus M, Sutton CE, Nunez G, Latz E, Kastner DL, Mills KH, Masters SL, Schroder K, Cooper MA, O’Neill LA. A small-molecule inhibitor of the NLRP3 inflam- masome for the treatment of inflammatory diseases. Nat Med 2015;21:248-55.
25. Gordon R, Albornoz EA, Christie DC, Langley MR, Kumar V, Mantovani S, Robertson AAB, Butler MS, Rowe DB, O’Neill LA, Kanthasamy AG, Schroder K, Cooper MA, Woodruff TM.
Inflammasome inhibition prevents α-synuclein pathology and dopaminergic neurodegeneration in mice. Sci Transl Med 2018;10:eaah4066.
26. Duncan JA, Bergstralh DT, Wang Y, Willingham SB, Ye Z, Zim- mermann AG, Ting JP. Cryopyrin/NALP3 binds ATP/dATP, is an ATPase, and requires ATP binding to mediate inflammato- ry signaling. Proc Natl Acad Sci U S A 2007;104:8041-6.
27. Marchetti C, Swartzwelter B, Koenders MI, Azam T, Tengesdal IW, Powers N, de Graaf DM, Dinarello CA, Joosten LAB.
NLRP3 inflammasome inhibitor OLT1177 suppresses joint in-
flammation in murine models of acute arthritis. Arthritis Res Ther 2018;20:169.
28. Huang Y, Jiang H, Chen Y, Wang X, Yang Y, Tao J, Deng X, Li- ang G, Zhang H, Jiang W, Zhou R. Tranilast directly targets NLRP3 to treat inflammasome-driven diseases. EMBO Mol Med 2018;10:e8689.
29. He H, Jiang H, Chen Y, Ye J, Wang A, Wang C, Liu Q, Liang G, Deng X, Jiang W, Zhou R. Oridonin is a covalent NLRP3 in- hibitor with strong anti-inflammasome activity. Nat Commun 2018;9:2550.
30. Cases S, Smith SJ, Zheng YW, Myers HM, Lear SR, Sande E, Novak S, Collins C, Welch CB, Lusis AJ, Erickson SK, Farese RV Jr. Identification of a gene encoding an acyl CoA:diacylglycerol acyltransferase, a key enzyme in triacylglycerol synthesis. Proc Natl Acad Sci U S A 1998;95:13018-23.
31. Cao J, Zhou Y, Peng H, Huang X, Stahler S, Suri V, Qadri A, Gareski T, Jones J, Hahm S, Perreault M, McKew J, Shi M, Xu X, Tobin JF, Gimeno RE. Targeting Acyl-CoA:diacylglycerol acyl- transferase 1 (DGAT1) with small molecule inhibitors for the treatment of metabolic diseases. J Biol Chem 2011;286:41838- 51.
32. Koliwad SK, Streeper RS, Monetti M, Cornelissen I, Chan L, Terayama K, Naylor S, Rao M, Hubbard B, Farese RV Jr.
DGAT1-dependent triacylglycerol storage by macrophages protects mice from diet-induced insulin resistance and inflam- mation. J Clin Invest 2010;120:756-67.
33. Zhou YP, Grill V. Long term exposure to fatty acids and ke- tones inhibits B-cell functions in human pancreatic islets of Langerhans. J Clin Endocrinol Metab 1995;80:1584-90.
Supplementary Fig. 1. PF-04620110 suppressed nucleotide-binding domain, leucine-rich-repeat-containing receptor (NLR), pyrin-domain-containing 3 (NLRP3) inflammasome activation. Quantification of (A) interleukin 1β (IL-1β; left), (B) IL-18 (mid- dle), and (C) tumor necrosis factor α (TNF-α; right) secretion from secretion from wild-type bone marrow-derived macrophages were pretreated with PF-04620110 (50 μM, 2 hours) of dimethyl sulfoxide (DMSO) followed by stimulation with nigericin or ad- enosine triphosphate (ATP) after lipopolysaccharide incubation. Data are mean±standard deviation. Data are representative of three independent experiments and each carried out in triplicate. aP<0.01, by two-tailed t-test.
1.0 0.8 0.6 0.4 0.2 0
0.5 0.4 0.3 0.2 0.1 0
1.0 0.8 0.6 0.4 0.2 0
IL-1β (ng/mL) IL-18 (ng/mL) TNF-α (ng/mL)
+ − + − + −
DMSO DMSO DMSO
− + − + − +
PF-04620110 PF-04620110 PF-04620110
a a
a a
Control Nigericin ATP
C B
A
Supplementary Fig. 2. The levels of diacylglycerol acyltransferase-1 (DGAT1) expression were elevated during nucleotide-bind- ing domain, leucine-rich-repeat-containing receptor (NLR), pyrin-domain-containing 3 (NLRP3) inflammasome activation. (A) Representative immunoblot analysis for DGAT1 (left) and densitometry quantification of DGAT1 levels (right) from wild-type (WT) bone marrow-derived macrophages (BMDMs) stimulated lipopolysaccharide (LPS) and palmitate–bovine serum albumin (PA-BSA). (B) Representative immunoblot analysis for DGAT1 (left) and densitometry quantification of DGAT1 levels (right) from WT BMDMs stimulated LPS and adenosine triphosphate (ATP). (C) Representative immunoblot analysis for DGAT1 (left) and densitometry quantification of DGAT1 levels (right) from WT BMDMs stimulated LPS and nigericin. (D) Representative immunoblot analysis for DGAT1 (left) and densitometry quantification of DGAT1 levels (right) from WT BMDMs stimulated LPS and flagellin. (E) Representative immunoblot analysis for DGAT1 (left) and densitometry quantification of DGAT1 levels (right) from WT BMDMs stimulated LPS and poly(dA:dT). For immunoblots, β-actin was used as loading control. All data are mean±standard deviation. Data are representative of three independent experiments and each carried out in triplicate. aP<0.05, by two-tailed t-test.
3 2 1 0
3 2 1 0
3 2 1 0
3 2 1 0
3 2 1 0
Fold change/ β-actinFold change/ β-actinFold change/ β-actin Fold change/ β-actinFold change/ β-actin
− + + −
− + + −
− + + −
− + + −
− + + − − + + −
− + + −
− + + −
− + + −
− + + − − − + +
− − + +
− − + +
− − + +
− − + + LPS
LPS
LPS
LPS
LPS LPS
LPS
LPS
LPS
LPS PA-BSA
Nigericin
Poly(dA;dT)
ATP
Flagellin DGAT1
DGAT1
DGAT1
DGAT1
DGAT1 β-Actin
β-Actin
β-Actin
β-Actin
β-Actin
−55
−55
−55
−55
−55
−42
−42
−42
−42
−42 Mr (kDa)
Mr (kDa)
Mr (kDa)
Mr (kDa)
Mr (kDa) − − + +
− − + +
− − + +
− − + +
− − + + PA-BSA
Nigericin
Poly(dA;dT)
ATP
Flagellin DGAT1
DGAT1
DGAT1
DGAT1
DGAT1
a
a
a a
a
a
A
C
E
B
D
1.5
1.0
0.5
0
Fold change/β-actin
DGAT1 −55
β-Actin −42
Mr (kDa)
DGAT1 Control Dgat1
gRNA #1 Dgat1
gRNA #2 a
a
Supplementary Fig. 3. Diacylglycerol acyltransferase-1 (Dgat1) gRNAs suppress the levels of DGAT1 expression. Representative immunoblot analysis for DGAT1 (left) and densitometry quantification of DGAT1 (normalized to levels of β-actin) (right) from wild-type bone marrow-derived macrophages were transduced with Dgat1-targeting gRNAs (Dgat1 gRNA #1 and Dgat1 gRNA
#2), or with a control plasmid (control). All data are mean±standard deviation. Data are representative of three independent ex- periments and each carried out in triplicate. aP<0.01, by two-tailed t-test.
Control Dgat1 gRNA #1 Dgat1 gRNA #2
4 3 2 1 0
6 5 4 3 2 1 0
4 3 2 1 0
Fold change/β-actin Fold change/β-actin Fold change/β-actin
− + − + − + − + − + − + − + − + − + − + + − − + + − − + + −
− − + + − − + + − − + +
LPS LPS LPS
NigericinLPS DGAT1 Pro-caspase-1
−55
−45
Caspase-1 p10 −10
Pro-IL-1β −31
IL-1β p17 −17
β-Actin −42
Mr (kDa)
− + − + − + − + − + − + − + − + − +
Nigericin Nigericin Nigericin
Control
Caspase-1 p10
DGAT1 IL-1β p17
Control Dgat1 gRNA #1 Dgat1
gRNA #2 Dgat1 gRNA #1 Dgat1 gRNA #2
a a
a a a
a
a b
a
Supplementary Fig. 4. Deficiency of diacylglycerol acyltransferase-1 (DGAT1) suppresses nucleotide-binding domain, leucine- rich-repeat-containing receptor (NLR), pyrin-domain-containing 3 (NLRP3) inflammasome activation. (A) Representative im- munoblot analysis for DGAT1, caspase-1, and interleukin 1β (IL-1β; left), and densitometry quantification of DGAT1, caspase-1 p10 and IL-1β p17 levels (normalized to levels of β-actin; right) from wild-type (WT) bone marrow-derived macrophages (BM- DMs) were transduced with Dgat1-targeting gRNAs (Dgat1 gRNA #1 and Dgat1 gRNA #2), or with a control plasmid (control), and were stimulate with nigericin after lipopolysaccharide (LPS) incubation. (B) Quantification of IL-1β (left), IL-18 (middle), and tumor necrosis factor α (TNF-α; right) secretion from WT BMDMs were transduced with Dgat1-targeting gRNAs (Dgat1 gRNA #1 and Dgat1 gRNA #2), or with a control plasmid (control), and were stimulated with nigericin or adenosine triphosphate (ATP) after LPS incubation. All data are mean±standard deviation. Data are representative of three independent experiments and each carried out in triplicate. aP<0.01, bP<0.05, by two-tailed t-test.
A
B Control Nigericin 0.8 ATP
0.6 0.4 0.2 0
0.6
0.4
0.2
0
1.0 0.8 0.6 0.4 0.2 0
IL-1β (ng/mL) IL-18 (ng/mL) TNF-α (ng/mL)
Control Dgat1 Control Control
gRNA #1 Dgat1
gRNA #1 Dgat1
gRNA #1 Dgat1
gRNA #2 Dgat1
gRNA #2 Dgat1
gRNA #2
a a
a a a a
a a