Received on March 9, 2011. Revised on March 15, 2011. Accepted on March 17, 2011.
CC This is an open access article distributed under the terms of the Creative Commons Attribution Non-Commercial License (http://creativecommons.org/licenses/by-nc/3.0) which permits unrestricted non-commercial use, distribu- tion, and reproduction in any medium, provided the original work is properly cited.
*Corresponding Author. Tel: 82-2-740-8919; Fax: 82-2-741-8918; E-mail: eycii@snu.ac.kr Keywords: CTL clone, Proliferation, Cytotoxicity, Avidity, TCR usage
Characterization of CTL Clones Specific for Single Antigen, H60 Minor Histocompatibility Antigen
Ji Yeong Jeon1, Kyung Min Jung2, Jun Chang3 and Eun Young Choi1,2*
1Department of Biomedical Sciences and 2Graduate Program of Immunology, Seoul National University College of Medicine, Seoul 110-799, 3Division of Life and Pharmaceutical Sciences, Ewha Womans University, Seoul 120-750, Korea
Background: Disparities of Minor H antigens can induce graft rejection after MHC-matched transplantation. H60 has been characterized as a dominant antigen expressed on hema- topoietic cells and considered to be an ideal model antigen for study on graft-versus-leukemia effect. Methods: Spleno- cytes from C57BL/6 mice immunized with H60 congenic splenocytes were used for establishment of H60-specific CTL clones. Then the clones were characterized for pro- liferation capacity and cytotoxicity after stimulation with H60. Clone #14, #15, and #23 were tested for the TCR binding avidity to H60-peptide/H-2Kb and analyzed for TCR sequences. Results: H60-specific CTL clones showed differ- ent levels of proliferation capacity and cytotoxic activity to H60-stimulation. Clones #14, #15, and #23 showed high proliferation activity, high cytotoxicity, and low activities on both aspects, respectively, and have TCRs with different binding avidities to H60-peptide/H-2Kb with t1/2 values of 4.87, 6.92, and 13.03 minutes, respectively. The TCR usages were Vα12D-3-01+Jα11-01 and Vβ12-1-01+Dβ1-01
+J2-7-01 for clone #14, Vα13D-1-02+Jα34-02 and Vβ13-1-02+Dβ2-01+Jβ2-7-01 for clone #15, and Vα16D+Jα45-01 and Vβ12-1-01+Dβ1-01+Jβ2-5-01 for clone #23. Conclusion: The results will be useful for mod- eling GVL and generation TCR transgenic mouse.
[Immune Network 2011;11(2):100-106]
INTRODUCTION
Allograft rejection is the major barrier for the success of solid tissue and stem cell transplantation. Major risk factor for the
rejection is mismatch at MHC locus between donor and recipient. Allograft rejection, however, still occurs even after MHC-matched transplantation for incompatibility of minor his- tocompatibility (H) antigens (1). Minor H antigens are peptide fragments derived from polymorphic proteins in association with MHC class I and II, able to induce CD4 and CD8 T cell responses (2). Considering the disparities at multiple minor H antigens upon the transplantation between MHC-matched but background-mismatched individuals, antigenic complexity could be enormous but, in reality, immune response focuses on a few dominant H antigens, exhibiting the phenomenon of immunodominance (3,4). In B6 anti-BALB.B system, a multiple minor H antigen-mismatched case, immune re- sponses against a few dominant minor H antigens, H60, H28, H4, and H7, account for more than 85% of total CD8 T cells response and, among those dominant minor H antigens, H60 is dominant over all other minor H antigens, with high fre- quency of reactive CD8 T cells detected in blood during the B6 anti-BALB.B response (4).
Not only for the dominancy of specific CD8 T cell re- sponse, also for its hematopoietic cell-restricted expression, H60 has been paid attention to and considered as an ideal model antigen for study on graft-versus-leukemia (GVL) effect (5). T cells originated from hematopoietic stem cell donor recognize and react against allo-minor H antigens expressed in leukemic tumor cells residing in the recipient of the stem cells, exerting GVL effect, in addition to their capability to induce graft-versus-host disease (GVHD) through the allo-re- action against minor H antigens expressed on tissues (6-9).
In this respect, CD8 T cells reactive to dominant and hema- topoietic cell-restricted H60 would be exploited for tumor therapy and, for this, H60-specific CD8 T cell clones would be useful tool for modeling GVL effect in mouse.
The H60-specific response is initiated by the recognition of 8-a.a. peptide (LTFNYRNL) in the context of H-2Kb by TCR expressed on CD8 T cells (5). H60 peptide/MHC complexes induce specific CD8 T cell response in CD4 help dependent manner. The help is mediated via CD40-CD40L interaction and is required not only for the induction of primary response but also for the memory cell expansion (10). The dominance of H60-specific response has been ascribed to high precursor frequency of the reactive CD8 T cells and the frequency was estimated to be one out of 10,000∼20,000 cells (11). Spectra- typing and sequencing of the CD8 T cells participating in H60-specific responses revealed the involvement of T cells with wide variety of TCRs (12). Based upon these results, we decided to establish CD8 T cell clones reactive to H60 and identify the TCR sequences of the clones, which would be basis for modeling of GVL and generating TCR transgenic mouse, a useful tool for detailed analysis on the mechanism of the GVL effects. In order to do this, we established and characterized H60-specific CTL clones. And the TCR usages of those were identified.
MATERIALS AND METHODS Mice and immunization
C57BL/6 (B6) mouse was purchased from The Jackson labo- ratory (Bar Harbor, ME, USA). H60 congenic mouse (B6.C- H60c/DCR) was a kind gift from Dr. Roopenian (The Jackson Laboratory). The mice were bred and kept under specific pathogen free (SPF) condition at the center for animal re- source development of Seoul National University College of Medicine. To induce H60-specific CD8 T cell response in the B6 mice, splenocytes from male H60 congenic mice were in- jected into female B6 mice via intraperitoneal route (2×10⁷ cells/mouse).
Antibodies and flow cytometry
Peripheral blood lymphocytes and splenocytes from immu- nized mice, MLC cells, CTL lines, or CTL clones were in- cubated at 4oC for 30 min in staining buffer (1×PBS contain- ing 0.1% bovine serum albumin and 0.1% sodium azide) con- taining PE-labeled H60-tetramer and FITC-labeled CD11a (M17/4; eBioscience, San Diego, CA) and APC-labeled CD8
(53-6.7; eBioscience) antibodies. The stained cells were ana- lyzed using a FACSCalibur equipped with CellQuest software (BD Pharmingen, San Diego, CA).
Generation of CTL clones
H60-specific CTL lines were established through mixed lym- phocyte culture (MLC) of splenocytes obtained from the im- munized B6 mice with those from H60 congenic mouse after irradiation (2,000 cGy) and regular re-stimulation with irradi- ated H60 congenic splenocytes afterward in DMEM media supplemented with 5% FBS and IL-2 (50 U/ml). Limiting dilu- tion was performed with the H60-specific CTL lines at the 5th passage to obtain the H60-specific CTL clones. Then the es- tablished clones were maintained through regular re-stim- ulation with irradiated H60 congenic cells.
Proliferation assay of H60-specific CTL clones CTL clones (5×10⁴ cells) were cultured with irradiated H60 congenic splencoytes (5×10⁵ cells) in the presence of 5 U/ml and 20 U/ml of IL-2. After 48 hr, the co-culture was added with 3H and further incubated for 18 hr. Then, the cells were harvested and the incorporation of 3H was measured.
Cell-mediated lysis assay
The standard 51Cr release assay was performed as described previously (4). In brief, 51Cr-labeled T2-Kb cells were in- cubated with 1μM concentration of synthetic peptides (LTFNYRNL for H60 and RGYVYQGL for VSV) for 30 min at 37oC for peptide loading onto the target cells and then co-in- cubated at 37oC with CTL clones (effectors) at E:T cell ratios of 2:1 and 10:1. Lysis of target cells was measured as spe- cific lysis based on the levels of 51Cr released by H60-loaded target cells relative to those by VSV-loaded target cells.
Inverse RT-PCR and identification of TCR usage of H60-specific clones
Total RNA was isolated from H60-speicific CTL clones and 2 μg were used for 1st strand synthesis of cDNAs correspond- ing to TCR alpha chain using a primer 5’-CTGGTTGCTCCAG- GCAATGGCCCCATT-3’ (TCRαR), and beta chains using a primer 5’-AGGATTGTGCCAGAAGGTAGCAGAGAC-3’ (TCRβR).
Second strand synthesis was done with E. coli DNA polymer- ase (Koschem, Daejon, Korea) and E. Coli RNAse H (Kos- chem). For circularization, the ds cDNAs were incubated with T4 DNA ligase at 16oC for overnight. The ligation mixtures were used for PCR amplification using the Cα-specific pri-
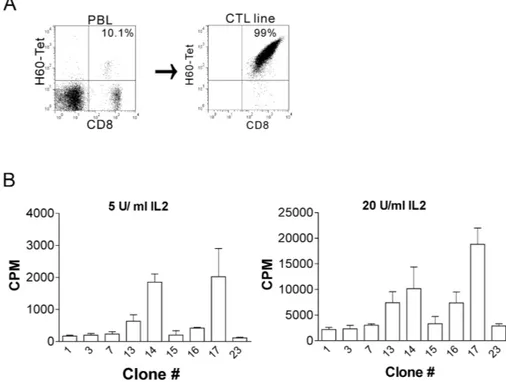
Figure 1. Establishment and characterization of H60-specific CTL clones. (A) Female C57Bl/6 (B6) mice were immunized with splenocytes from male H60 congenic mice, and, then, peripheral blood lymphocytes (PBLs) from the immunized mice were examined to see whether H60-specific response was induced by staining with H60 tetramer and subsequent flow cytometry on day 10 post-immunization (left). On day 14, splenocytes from the immunized mice were cultured with irradiated splenocytes from H60 congenic mouse and the mixed lymphocyte culture (MLC) was re-stimulated regularly on weekly basis to generate H60-specific CTL line (right). H60-specific CTL clones were derived from the CTL line on passage 5. (B) Proliferation assay of the H60-specific CTL clones. Established H60-specific CTL clones were examined for their proliferation capacity in reaction to the stimulation with H60 congenic cells in the presence of IL-2 at the concentrations of 5 U/ml (left) and 20 U/ml (right). 3H was added to the culture on 48 hr later and, after further induction for 18 hr, cells were harvested and 3H-incorporation was measured. The assay was performed in triplicates and the data represent three independent experiments.
mers, TCRAinvF (5’-TCTGGAACGTTCATCACTGACAAA ACT-3’) and TCRAinvR (5’-GGTGCT GTCCTGAGACCGAGGATC-3’), and Cβ-specific primers TCRBinvF (5’-TACAAGGAGAGCAA- TTATAGCTACTGC-3’) and TCRBinvR (5’-GCTTTTGATGGCT- CAAACAAGGAGAC-3’). 35 cycles at an annealing temper- ature of 60oC were performed. Products of the inverse PCR were then cloned to pGEM-T vector and subsequently sub- jected to sequence analysis. The TCR usages were identified according to the IMGT database.
Determination of relative avidity
CTL clones were labeled with 50μg/ml of PE-labeled H60- tetramer, incubated at 4oC for 1 hr in FACs buffer and, then, washed extensively. Following this initial tetramer binding, an aliquot of 105 cells was chased in FACs buffer with incubation at 37oC for indicated times. The clones were also stained with FITC-labeled anti-TCRβ antibody to monitor TCR levels.
Cells were analyzed by flow cytometry. Mean fluorescence intensity (MFI) values of binding of tetramer and anti-TCRβ antibody were plotted. The t1/2 of TCR-peptide/MHC inter- action was calculated from specific mean fluorescence in- tensity using nonlinear regression analysis fitted to classical Michaelis-Menten Kinetics (Prism version 5, GraphPad, San Diego, CA).
RESULTS AND DISCUSSION
Generation of H60 specific CTL clones
Female B6 mice were immunized with male H60 congenic splenocytes and, on day 14 post-immunization, mixed leuko- cyte culture (MLC) was set up with irradiated H60 congenic splenocytes. Through five rounds of re-stimulation of the MLC cells with irradiated H60 congenic splenocytes, H60-specific CTL line was established (Fig. 1A). While the frequency of
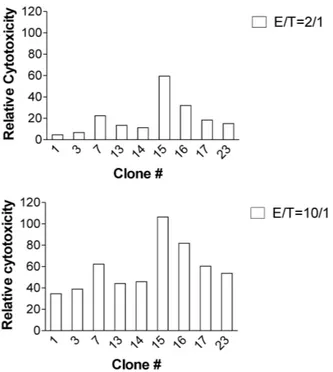
Figure 2. Cytotoxicity of H60-specific CTL clones. CTL clones were incubated with 51Cr-labeled T2-Kb cells after loading with H60 or VSV peptide at the E:T ratios of 2:1 and 10:1. 51Cr released into culture supernatant was measured and specific cytotoxicity was calculated in relation to the 51Cr released in the VSV-peptide-included wells. The assay was performed in triplicates and the mean values were plotted. The data represent three independent experiments.
H60-specific CD8 T cells was in ranges of 5∼10% of CD8 T cells in blood of the immunized B6 mice at the peak of response, 99% of the established CTL line was positive for H60-tetramer as shown by flow cytometry analysis (Fig. 1A).
With this CTL line at the 5th passage, limiting dilution was performed to obtain H60-specific CTL clones. Then, CTL clones, each of which was originated from a single cell via the limiting dilution, were maintained through re-stimulation with irradiated H60 congenic cells on weekly basis and 24 CTL clones reactive to H60 were established.
CTL clones have different capacity of proliferation Among the initial 24 CTL clones obtained, finally, nine CTL clones (#1, 3, 7, 13, 14, 15, 16, 17, and 23) were able to be maintained beyond the passage seven and subjected to clonal characterization. First, each CTL clone was tested for proliferation capacity in response to stimulation with irradi- ated H60 congenic cells. When 3H-incorporation by the CTL clones during the stimulation was measured, clone # 14 and
#17 proliferated relatively highly (Fig. 2), even when the con- centration of supplemented IL-2 was limiting (5 U/ml). The other cells, clone #1, #3, #7, #15, and #23, showed rather minimal, but enough to be maintained for next passage, pro- liferation by the stimulation. These data demonstrated that even though they were all H60-specific, each clone showed a different level of proliferation capacity in reaction to the H60-stimulation.
Different capacity of CTL activity of the H60-specific CTL clones
Next, we examined whether cytotoxic activity of the H60-spe- cific CTL clones would be different. In order to do this, the nine CTL clones were subjected to cell mediated lysis (CML) assay by incubating with 51Cr-labeled and H60-peptide loaded T-2Kb target cells at two different effector/target ratios of 2:1 and 10:1. In overall, cytotoxicity of the nine CTL clones was higher at the E:T ratio of 10:1 than 2:1 and, among the clones, clone #15 was distinguished for its high CTL activity against H60-loaded T-2Kb cells. The clone #14, which showed the second highest proliferation activity in reaction to stim- ulation with H60 congenic cells (Fig. 1B), belonged to the group with low CTL activity. This result combined with that from proliferation assay demonstrated that even though all the CTL clones were specific for H60, they possessed different levels of proliferation capacity and cytotoxicity.
Different binding affinity of H60-specific CTL clones for peptide/MHC complexes
Then, we wondered whether CTL clones would show differ- ent levels of TCR affinity to cognate ligand, H60-peptide/
H-2Kb complexes. To examine this, the affinity was empiri- cally measured via determining t1/2 of H60-peptide/H-2Kb-TCR interactions. We selected CTL clone #14, #15, and #23 based upon the clonal characteristics, for high proliferation capacity (#14), high cytotoxicity activity (#15), and low activities in both aspects (#23), respectively. The CTL clones were stained with saturating amount (50μg/ml) of H60-teramer for 1 hr and, after washing, the cells were incubated at 37oC for in- dicated time period and examined for falling-off the tetramers from their TCR by flow cytometry analysis, measuring the mean fluorescence intensity. To see whether TCR expression itself was influenced, the cells were also stained with anti-TCRβ antibody before flow cytometry analysis. When the mean flu- orescence intensity (MFI) values of H60-tetramer and anti-TCRβ antibody staining were plotted, we found that initial MFI val-
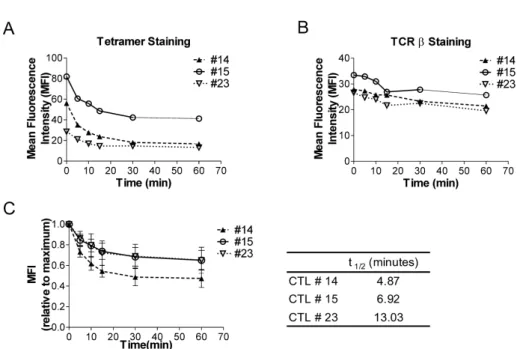
Figure 3. Biochemical features of the interaction of H60-peptide/
H-2Kb-TCR of H60-specific CTL clones (A) CTL clones, #14, #15, and #23, were reacted with H60- tetramer-PE, washed extensively and incubated 37oC for 1 hr. The disso- ciation of the tetramer from cells during the chase was monitored by flow cytometry. (B) Cells were also stained with anti-TCRβ antibody post-chase to detect TCR levels of the cells. The MFI values from the flow cytometry (A and B) were plotted. (C) Relative MFIs were MFI values at indicated time points fractionated by MFI value detected at the beginning of the chase. And the t1/2 was obtained based on this dissociation curve. The data repre- sent two independent experiments.
ues of tetramer staining were different among the three CTL clones (Fig. 3A). The initial MFI value was highest with clone
#15 (82) and lowest with clone #23 (30) with #14 in the inter- mediate (58), even though the TCR level on the cell surfaces were not significantly different in a range of 28∼33 MFI val- ues (Fig. 3B). This demonstrated that the three CTL clones,
#14, #15, and #23, bound to H60-tetramer with different avidities. When the t1/2 of H60-peptide/H-2Kb-TCR inter- actions was calculated (Fig. 3C), the duration of the inter- action was shortest in clone #14 (4.87 minutes) and longest in clone #23 (13.93 minutes), demonstrating that even though the TCR of clone #23 has very low initial avidity to the H60-peptide/H-2Kb, the interaction is stable. Moreover, the results demonstrate that TCR of clone #14, which has high proliferation capacity, has modest initial binding avidity to H60-peptide/H-2Kb but the duration of the binding is short.
In the case of clone #15, the TCR interaction with H60 pep- tide/H-2Kb initiated with high avidity and the interaction was rather stable with about 7 minutes of t1/2. All these results showed that each clone has its own TCR binding avidity to the specific ligand as well as proliferation and cytotoxic capacities.
Identification of TCR sequences of the H60-specific CTL clones
Then we thought that such clonal differences in proliferation activity, cytotoxicity, and TCR binding avidity to H60 pep-
tide/H-2Kb would reflect different TCR usages of the clones.
To identify the sequences encoding the TCRs expressed by clone #14, #15, and #23, inverse PCR was performed with the RNAs extracted from each clone and the PCR products were cloned to pGEM-T vector and analyzed for sequence (Fig. 4). The sequence analysis revealed that the three CTL clones had different usages of TCRα and TCRβ. TCR com- plex of CTL clone #14 consists of Vα12D-3-01 and Jα11-01 for TCRα chain and Vβ12-1-01, Dβ1-01, and Jβ2-7-01 for TCRβ chain. CTL clone #15 consists of Vα13D-1-02 and Jα 34-02, and Vβ13-1-02, Dβ2-01, and Jβ2-7-01 for TCRα and β chains, respectively. TCR α and β chains of Clone
#23 consists of Vα16D and Jα45-01, and Vβ12-1-01, Dβ 1-01, and Jβ2-5-01, respectively. Based upon the sequence analysis data, we could suggest that the different TCR usages by each clone would have been reflected to differences in the clonal characteristics.
From an antigenic standpoint, H60 has been found to re- cruit CD8 T cells with diverse TCRs into the specific response, after primary challenge as well as after memory expansion stimulation (12). The results from this study through a series of clonal characterization showed that the CD8 T cells re- cruited to H60-specific CD8 T cells responses would have each different capacity, in terms of proliferation, cycotoxicity, and TCR avidity to the cognate ligand H60 peptide/H-2Kb. And the H60-specific CTL clones and TCR information ob- tained in this study would be useful for understanding the
Figure 4. Sequence analysis of H60- specific CTL clones. (A) Annotation of TCR usages of H60-specific CTL clones, #14, #15, and #23, and (B) sequences of the CDR3 regions were shown.
cellular mechanism of graft rejections and GVHD, and also for modeling the GVL effect under MHC-matched trans- plantation condition.
ACKNOWLEDGEMENTS
This study was supported by a grant from National Research Foundation of Korea (313-2008-2-E00216).
CONFLICTS OF INTEREST
The authors have no financial conflict of interest.
REFERENCES
1. Simpson E: Minor histocompatibility antigens. Immunol Lett 29;9-14, 1991
2. Simpson E, Roopenian D: Minor histocompatibility anti- gens. Curr Opin Immunol 9;655-661, 1997
3. Wettstein PJ: Immunodominance in the T-cell response to multiple non-H-2 histocompatibility antigens. II. Observat- ion of a hierarchy among dominant antigens. Immunoge- netics 24;24-31, 1986
4. Choi EY, Yoshimura Y, Christianson GJ, Sproule TJ, Malarkannan S, Shastri N, Joyce S, Roopenian DC: Quanti- tative analysis of the immune response to mouse non-MHC transplantation antigens in vivo: the H60 histocompatibility
antigen dominates over all others. J Immunol 166;4370- 4379, 2001
5. Malarkannan S, Shih PP, Eden PA, Horng T, Zuberi AR, Christianson G, Roopenian D, Shastri N: The molecular and functional characterization of a dominant minor H antigen, H60. J Immunol 161;3501-3509, 1998
6. Korngold R: Lethal graft-versus-host disease in mice di- rected to multiple minor histocompatibility antigens: fea- tures of CD8+ and CD4+ T cell responses. Bone Marrow Transplant 9;355-364, 1992
7. van Lochem E, de Gast B, Goulmy E: In vitro separation of host specific graft-versus-host and graft-versus-leukemia cytotoxic T cell activities. Bone Marrow Transplant 10;181- 183, 1992
8. Goulmy E: Human minor histocompatibility antigens: new concepts for marrow transplantation and adoptive immuno- therapy. Immunol Rev 157;125-140, 1997
9. Choi JH, Yoon H, Min CK, Choi EY: Effects of Pre-con-
ditioning Dose on the Immune Kinetics and Cytokine Production in the Leukocytes Infiltrating GVHD Tissues af- ter MHC-matched Transplantation. Immune Netw 11;68-78, 2011
10. Ryu SJ, Jung KM, Yoo HS, Kim TW, Kim S, Chang J, Choi EY: Cognate CD4 help is essential for the reactivation and expansion of CD8 memory T cells directed against the hem- atopoietic cell-specific dominant minor histocompatibility antigen, H60. Blood 113;4273-4280, 2009
11. Choi EY, Christianson GJ, Yoshimura Y, Sproule TJ, Jung N, Joyce S, Roopenian DC: Immunodominance of H60 is caused by an abnormally high precursor T cell pool di- rected against its unique minor histocompatibility antigen peptide. Immunity 17;593-603, 2002
12. Choi JH, Ryu SJ, Jung KM, Kim S, Chang J, Kim TW, Choi EY: TCR diversity of H60-specific CD8 T cells during the response evolution and influence of CD4 help. Transplan- tation 87;1609-1616, 2009