Original Article
Received: Oct 6, 2016; Revised: Jul 7, 2017; Accepted: Jul 9, 2017; Published online Sep 6, 2017 Correspondence to: Jae Seog Hyun https://orcid.org/0000-0002-8820-4117
Department of Urology, Gyeongsang National University Hospital, 79 Gangnam-ro, Jinju 52727, Korea.
Tel: +82-55-750-8192, Fax: +82-55-750-8192, E-mail: [email protected]
The Correlation between Body Mass Index and Routine Parameters in Men Over Fifty
Deok Ha Seo1, Sol Yoon2, Jae Hwi Choi2, Jungmo Do2, Sin Woo Lee2, Chunwoo Lee1, Seong Uk Jeh2, See Min Choi2, Sung Chul Kam1,3, Jeong Seok Hwa2,3, Ky Hyun Chung1,3, Sung Won Kwon4,9,
Sae Chul Kim5,9, Dong Soo Park6,9, Jae Mann Song7,9, Kyung Seop Lee8,9, Jae Seog Hyun2,3
1Department of Urology, Gyeongsang National University Changwon Hospital, Changwon, 2Department of Urology, Gyeongsang National University Hospital, 3Department of Urology, Gyeongsang National University School of Medicine, Jinju, 4Department of Urology, CHA Gangnam Medical Center, CHA University, Seoul, 5Department of Urology, Seonam University Myongji Hospital, Goyang, 6Department of Urology, CHA Bundang Medical Center, CHA University, Seongnam, 7Department of Urology, Yonsei University Wonju College of Medicine, Wonju, 8Department of Urology, Dongguk University College of Medicine, Gyeongju, 9Korea Prostate Health Council. Inc., Seoul, Korea
Purpose: This study aimed to investigate the relationships between body mass index (BMI) and prostate-specific antigen (PSA) levels, international prostate symptom score (IPSS), quality of life (QoL), and prostate volume (PV).
Materials and Methods: Height, weight, PSA levels, PV, and IPSS were analyzed in 15,435 patients who underwent a prostate examination between 2001 and 2014. Patients aged <50 years or with a PSA level ≥10 ng/mL were excluded. The relationships between BMI and PSA, IPSS, QoL, and PV were analyzed by a scatter plot, one-way analysis of variance, and the Pearson correlation coefficient.
Results: The mean age was 71.95±7.63 years, the mean BMI was 23.59±3.08 kg/m2, the mean PSA level was 1.45±1.45 ng/mL, the mean IPSS was 15.53±8.31, the mean QoL score was 3.48±1.25, and the mean PV was 29.72±14.02 mL. PSA, IPSS, and QoL showed a tendency to decrease with increasing BMI, and there were statistically significant differences for each parameter (p≤0.001). PV showed a significant tendency to increase with BMI (p<0.001). In the correlation analysis, BMI showed a statistically significant correlation (p<0.001) with PSA, IPSS, and QoL, although the correlations were very weak. In contrast, BMI showed a significant correlation with PV (p<0.001), with a meaningful Pearson correlation coefficient of 0.124.
Conclusions: Higher BMI was associated with lower PSA levels and higher IPSS and QoL scores. Meanwhile, PV increased with BMI. Although obese individuals had a greater PV, obesity did not aggravate lower urinary tract symptoms.
Key Words: Body mass index; Lower urinary tract symptoms; Prostate-specific antigen; Prostatic hyperplasia
https://doi.org/10.5534/wjmh.16032
www.wjmh.org
INTRODUCTION
Obesity is an issue in medicine that has recently re- ceived considerable attention worldwide. The prevalence of obesity is increasing at a greater rate than ever before [1]. Various studies have demonstrated that obesity causes physical and mental problems, including diabetes, car- diovascular disease, as manifested via risk factors, such as hyperlipidemia and hypertension, several types of cancer, osteoarthritis [2], and depression [3]. Its negative impact on socioeconomic parameters is making it as much a prob- lem of society as of personal health [4].
Prostate-specific antigen (PSA) is the most widely used tumor marker in prostate cancer screening [5,6]. There is some debate about the appropriate PSA cut-off value to trigger performing a prostate biopsy to diagnose prostate cancer [7,8], and an elevated PSA level is not entirely spe- cific to prostate cancer. Nevertheless, it is clear that PSA plays an important role in the screening and diagnosis of prostate cancer. In a study by Freedland et al [9] in 2008, it was reported that body mass index (BMI) could affect prostate cancer detection, since PSA levels were found to decrease with increasing BMI. The relationship between obesity and PSA levels needs to be clearly elucidated in or- der to enable appropriate prostate cancer detection—that is, discovering cancer at the right time, before it develops into high-grade prostate cancer, but without performing excessive histological examinations. Although there have been studies on the effects of obesity on PSA levels, the re- lationship between them is still not clear.
Patients complaining of lower urinary tract symptoms (LUTS) experience considerable physical and mental suf- fering and reduced quality of life (QoL) [10]. The preva- lence of symptoms increases with age [11], meaning that the global increase in life expectancy is producing an in- creasing number of patients with LUTS. It has been re- ported that prostate volume (PV) increased with the se- verity of obesity [9]. However, debates about LUTS con- tinue, because some studies have reported that obesity was associated with LUTS [12], while others have reported that obesity had no effect on LUTS [13]. Moreover, some reports have suggested that LUTS severity increases with PV, but this is not clear either. Neither the effect of obesity on LUTS nor its interaction with QoL has been clearly
demonstrated.
Even though the relationship between PSA levels and LUTS is an important element in male health, the inter- action of these parameters with obesity has not yet been conclusively assessed. Therefore, this study examined the relationships of the BMI, an objective measure of obesity, with PSA levels, international prostate symptom score (IPSS), QoL, and PV.
MATERIALS AND METHODS
A retrospective analysis was conducted on the prostate examination results of male patients in a single commun- ity in South Korea from January 1, 2001 to January 1, 2014.
Age, medical history, height, weight, PSA level, PV, and IPSS were investigated in a total of 72,679 patients. PSA levels were measured at a single institution, and PV was measured using a biplane transrectal ultrasound probe. An additional QoL item was included on the IPSS, ranging from 0 (delighted) to 6 (terrible). The 7 items of the IPSS and the QoL item were measured by self-response.
Of the patients, 16,265 were excluded because they had been treated for benign prostatic hyperplasia (BPH), were under 50 years of age, or had a PSA level ≥10 ng/mL. Of the remaining 56,414 patients, 40,895 patients were excluded because one of the examination items had been omitted, such as height or weight, making it impos- sible to calculate the BMI, or the IPSS. Of the remaining 15,519 patients, 84 patients were excluded because their medical history included the diagnosis or treatment (e.g., surgery) of prostate cancer, a history of treatment for BPH, a diagnosis of bladder cancer or radical cystectomy, or a diagnosis of diabetic bladder or neurogenic bladder. The remaining 15,435 patients were included in the final analysis. We calculated the BMI as weight in kilograms divided by height in meters squared (kg/m2). In accord- ance with the National Institutes of Health standards, we classified subjects into 5 groups by BMI: underweight for BMI values of <18.5 kg/m2, normal weight for BMI values of 18.5∼23.0 kg/m2, overweight for BMI values of 23.0∼
25.0 kg/m2, obese I for BMI values of 25.0∼30.0 kg/m2, and obese II for BMI values of ≥30.0 kg/m2 [14].
Together with the subjects’ basic information, one-way analysis of variance (ANOVA) was performed to examine
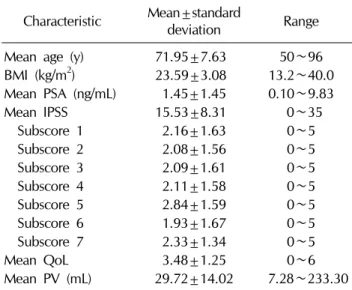
Table 1. Baseline characteristics of the subjects (n=15,435) Characteristic Mean±standard
deviation Range
Mean age (y) 71.95±7.63 50∼96
BMI (kg/m2) 23.59±3.08 13.2∼40.0 Mean PSA (ng/mL) 1.45±1.45 0.10∼9.83
Mean IPSS 15.53±8.31 0∼35
Subscore 1 2.16±1.63 0∼5
Subscore 2 2.08±1.56 0∼5
Subscore 3 2.09±1.61 0∼5
Subscore 4 2.11±1.58 0∼5
Subscore 5 2.84±1.59 0∼5
Subscore 6 1.93±1.67 0∼5
Subscore 7 2.33±1.34 0∼5
Mean QoL 3.48±1.25 0∼6
Mean PV (mL) 29.72±14.02 7.28∼233.30 BMI: body mass index, PSA: prostate-specific antigen, IPSS:
international prostate symptom score, QoL: quality of life, PV: prostate volume.
Table 2. Comparison of subjects across BMI groups
Variable
BMI group (kg/m2)
p-value
<18.5
(underweight) 18.5∼23.0
(normal weight) 23.0∼25.0
(overweight) 25.0∼30.0 (obese I)
≥30.0 (obese II)
No. of patient 702 5,949 3,831 4,614 339 -
Mean age (y) 75.19±7.42 73.51±7.19 71.31±7.41 70.24±7.76 68.27±8.26 <0.001 Mean BMI (kg/m2) 17.44±0.99 21.20±1.21 23.98±0.57 26.71±1.23 31.55±1.69 <0.001
Mean PSA (ng/mL) 1.69±1.59 1.51±1.53 1.44±1.39 1.35±1.36 1.28±1.51 0.001
Mean total IPSS 18.11±8.38 16.00±8.45 15.46±8.07 14.75±8.15 13.68±8.88 <0.001
Subscore 1 2.54±1.73 2.16±1.67 2.18±1.58 2.10±1.58 2.03±1.65 0.004
Subscore 2 2.47±1.59 2.12±1.59 2.02±1.51 2.02±1.54 1.91±1.54 <0.001
Subscore 3 2.33±1.72 2.12±1.64 2.11±1.56 2.02±1.59 1.75±1.69 0.008
Subscore 4 2.59±1.66 2.19±1.61 2.08±1.53 1.97±1.56 1.83±1.63 <0.001
Subscore 5 3.16±1.60 2.95±1.58 2.84±1.59 2.69±1.57 2.40±1.68 <0.001
Subscore 6 2.26±1.75 2.01±1.72 1.94±1.64 1.78±1.59 1.60±1.67 <0.001
Subscore 7 2.77±1.38 2.45±1.39 2.28±1.28 2.17±1.30 2.16±1.31 <0.001
Mean QoL 3.79±1.17 3.55±1.24 3.47±1.26 3.37±1.25 3.34±1.37 <0.001
Mean PV (mL) 27.30±12.36 28.43±12.76 29.44±11.63 31.31±15.65 38.88±27.55 <0.001 the statistical significance of differences among the 5 BMI
groups in mean PSA levels, IPSS, QoL, and PV. The Scheffé method was used for post hoc testing. In order to investigate the correlations of BMI with PSA levels, IPSS, and QoL, a univariate analysis was performed using the Pearson correlation coefficient. Additionally, we used a scatter plot to investigate the relationship between BMI and PSA as continuous variables. Statistical analyses were performed using SPSS ver. 21 (IBM Co., Armonk, NY, USA) and considered p-values <0.05 to be statistically significant.
Ethics statement
The present study was exempted from institutional re- view board approval.
RESULTS
The study subjects consisted of a total of 15,435 pa- tients, and their mean age was 71.95±7.63 years, ranging from 50 to 96 years. The subjects’ BMI ranged from 13.2 to 40.0 kg/m2, with a mean of 23.59±3.08 kg/m2. The mean PSA level was 1.45±1.45 ng/mL, the mean total IPSS was 15.53±8.31, and the mean QoL was 3.48±
1.25. PV ranged from 7.28 to 233.30 mL, with a mean of 29.72±14.02 mL (Table 1). After classifying subjects into 5 groups according to BMI, there were 702 subjects in the underweight group (BMI <18.5 kg/m2), 5,949 subjects in the normal weight group (BMI 18.5∼23.0 kg/m2), 3,831 subjects in the overweight group (BMI 23.0∼25.0 kg/m2),
www.wjmh.org Table 3. Relationships of BMI with PSA, IPSS, QoL, and PV
Variable PSA IPSS QoL PV
R value by the Pearson correlation test −0.056 −0.095 −0.079 0.124
p-value by the Pearson correlation test 0.000 0.000 0.000 0.000
B value by the linear regression model −0.026 −0.255 −0.032 0.563
R2 value by the linear regression model 0.003 0.009 0.006 0.015
p-value by the linear regression model 0.000 0.000 0.000 0.000
BMI: body mass index, PSA: prostate-specific antigen, IPSS: international prostate symptom score, QoL: quality of life, PV:
prostate volume.
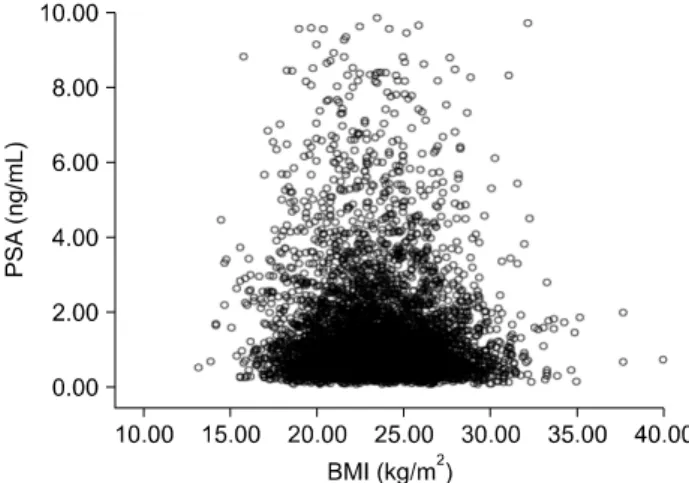
Fig. 1. Scatter plot of the relationship between body mass index (BMI) and prostate-specific antigen (PSA).
4,614 subjects in the obese I group (BMI 25.0∼30.0 kg/m2), and 339 subjects in the obese II group (BMI ≥30.0 kg/m2).
One-way ANOVA was performed to examine the differ- ences among the BMI groups in mean PSA levels, mean to- tal IPSS, mean QoL score, and mean PV. With increasing BMI, the mean PSA level showed a decreasing trend, with values of 1.69, 1.51, 1.44, 1.35, and 1.28 ng/mL, respec- tively (p=0.001). The mean total IPSS likewise showed a decreasing trend with increasing BMI, with values of 18.11, 16.00, 15.46, 14.75, and 13.68 (p<0.001). QoL also showed a decreasing trend with increasing BMI, with values of 3.79, 3.55, 3.47, 3.37, and 3.34 (p<0.001). In contrast, PV showed an increasing trend with increasing BMI, with values of 27.30, 28.43, 29.44, 31.31, and 38.88 mL (p<0.001) (Table 2).
A correlation analysis was performed using the Pearson correlation coefficient to examine the relationships of BMI with PSA, IPSS, QoL, and PV. Although the correlation be- tween BMI and PSA level was significant, the Pearson cor- relation coefficient (R value) was −0.056, indicating al- most no correlation (p<0.001). There was also a sig- nificant correlation between BMI and IPSS, but the Pearson correlation coefficient (R value) of −0.095 in- dicated almost no correlation (p<0.001). BMI and QoL showed a significant correlation as well, but again, the Pearson correlation coefficient (R value) was only −0.079, meaning that there was almost no correlation (p<0.001).
In contrast, BMI and PV showed a significant positive cor- relation, with a meaningful R value of 0.124 (p<0.001) (Table 3).
A scatter plot was made to show the relationship be- tween BMI and PSA levels as continuous variables.
Likewise, BMI and PSA were not found to be related in the
scatter plot (Fig. 1).
DISCUSSION
In 2004, Thompson et al [15] examined the relationship between BMI and PSA levels in 1,565 subjects in a local community and reported that there was no association be- tween BMI and PSA levels in either the whole-group anal- ysis or the analysis by ethnicity. No association was re- ported between BMI and PSA levels when comparisons were made across Hispanic, African American, and Cau- casian subjects or when subjects were divided based on their family history of prostate cancer. Fowke et al [16] in- vestigated the associations of body size with PV and PSA level, measuring waist and hip circumference and using the waist-to-hip ratio as an index of body size. That study reported that obesity and height were independently re- lated to PV, as well as to an increase in the PSA level. This was thought to suggest an interaction of PSA expression
with insulin regulation or metabolic syndrome. In addi- tion, in a study by Lee et al [17], PSA levels were reported to increase with larger waist circumference, an index of obesity.
In a study in 2010 by Jeong et al [18] on 23,601 subjects, the mean PSA level was confirmed to increase with in- creasing age and decreasing BMI. However, after correct- ing for age and BMI, there was no statistically significant association between metabolic syndrome and PSA levels.
Of the 5 components of metabolic syndrome, waist cir- cumference and fasting plasma glucose levels were asso- ciated with lower PSA levels, while hypertension was as- sociated with a higher PSA level. The authors claimed that these results reflected the heterogeneous relationship be- tween metabolic risk factors and PSA levels.
In 2007, Werny et al [19] also investigated the relation- ship between obesity and PSA levels in US men aged 40 years or older, by analyzing data from the 2001 to 2004 National Health and Nutrition Examination Survey. After dividing subjects into Caucasians, African-Americans, and Mexican-Americans, weight, BMI, waist circumference, triceps skin fold, and total body water were used as indices of obesity. In this study, Caucasians showed a decrease in PSA levels with increasing obesity, while Mexican- Americans showed a decrease in PSA levels specifically with increasing BMI, and African-Americans showed a de- crease in PSA levels with increasing triceps thickness. In a multivariate linear regression analysis correcting for age and ethnicity, PSA levels were found to decrease with in- creasing weight, BMI, waist circumference, triceps skin fold, and total body water.
Hence, although it has not been completely proven, nu- merous studies have reported that PSA levels were lower in obese men [20,21]. These studies hypothesized that this is a result of hemodilution, due to an increase in the circu- lating plasma volume. The results of the present study also confirmed a decrease in PSA level with increasingly se- vere obesity, and support the claims that this effect is a re- sult of hemodilution of PSA due to increased plasma volume.
Although a study by Freedland et al [9] did not show an association between obesity and prostate cancer risk, it
2007, Wright et al [22] performed a study of obesity, pros- tate cancer incidence, and mortality in 9,986 subjects. In their study, obesity did not increase prostate cancer in- cidence, but adult weight gain was associated with fatal prostate cancer. In 2010, Hekal and Ibrahiem [23] pro- posed an equation that corrected for age and BMI by tak- ing the patient’s total PSA level, multiplying by their age, and dividing by their BMI. This supports claims that obe- sity should be reflected in factors that affect the PSA cut-off value used when deciding whether to perform a biopsy during prostate cancer screening.
In the present study, more severe obesity was asso- ciated with a decrease in IPSS and QoL and with an in- crease in PV. In 2000, Haidinger et al [24] examined LUTS risk factors in 1,557 elderly men, and reported that while there was no correlation of IPSS with weight or BMI, men with higher blood pressure and a larger waist size tended to show a higher IPSS. In a prospective study by Kim et al [13] in 2010, a multivariate analysis showed that waist cir- cumference was the only obesity index that was sig- nificantly associated with PV, while a univariate analysis showed no statistically significant relationships between LUTS and any obesity-related indices, as well as no associ- ations between PV and LUTS. Yee et al [25] examined the effects of weight loss on LUTS severity in obese men, and reported no relationship between obesity and LUTS severity. However, the authors did suggest that their result could be due to insufficient weight loss, and predicted that weight loss would still alleviate LUTS. In contrast, a study has also reported that PV and IPSS increased with increas- ing central obesity [17,26]. Regarding these results, al- though PV has been confirmed to increase with the se- verity of obesity in several papers, it is thought that the se- verity of LUTS may have varied according to the statistical analyses used. In the present study, although there was al- most no correlation in the correlation analysis, LUTS were found to show improvement with increasing BMI, and PV also showed an increase in the correlation analysis. This shows that an increase in PV does not necessarily mean an increase in the severity of LUTS. It seems that the PV in- crease is due to an increase in the volume of the peripheral zone, rather than the transitional zone.
www.wjmh.org
instruments have been used for the objective evaluation of QoL, showing a decrease in QoL with increasing LUTS severity. According to a study of 4,800 men and 3,674 women by Boyle et al [27], LUTS severity and the QoL question in the IPSS were clearly correlated in both men and women. The authors also reported that this could im- pact the health of the affected individuals and their partners. The present study found a negative correlation between obesity severity and QoL. While it is likely that PV is not necessarily correlated with LUTS, LUTS and QoL can be considered to be affected in the same way. The present study also showed a negative correlation of obe- sity severity with the IPSS total score and QoL. In compar- ison with other studies, we expected increasing prostate size to be unrelated to, or to be associated with, a deterio- ration in IPSS total score and QoL. However, that was not the case in the present study. Therefore, we suggest that obesity itself does not always make LUTS more severe.
Our study has some limitations, such as being a retro- spective study, and the inability to include other physical measurements apart from BMI, such as waist circum- ference or skin folds. Other studies have made compar- isons using BMI and other physical measurements, but the present study used only BMI, without any analysis of other obesity indices. In addition, because the patients self-re- ported IPSS and QoL, there is the possibility of bias having a negative impact on the objectivity of the IPSS and QoL measurements. We hypothesized that increased PV repre- sented an increase in the peripheral zone, rather than the transitional zone; in future studies, it will be necessary to investigate the transitional zone size to confirm this correlation.
Nevertheless, this was a large-scale study in a local community. It is significant because it could aid in the in- terpretation of PSA values according to obesity in actual clinical situations, as well as helping to ascertain the ef- fects of obesity on LUTS. Together with existing studies, additional prospective research will be required to adjust the PSA cut-off value according to obesity, which could be expected to increase the accuracy of prostate cancer diag- nosis in the obese population. Finally, we expect that addi- tional studies on the association between obesity and LUTS could help identify lifestyle improvement methods that are likely to alleviate symptoms.
CONCLUSIONS
PSA levels were found to decrease with increasing BMI, which was used as a measure of obesity. This shows that the interpretation of PSA levels may need to change ac- cording to the obesity status of the patient. BMI showed a positive correlation with PV, but BMI was not associated with exacerbated LUTS or QoL. Additional prospective studies will be required in the future to examine the PSA cut-off values used in prostate cancer screening according to obesity, and to further investigate the effects of obesity on LUTS and QoL.
Disclosure
The authors have no potential conflicts of interest to disclose.
Author Contribution
Research conception & design: Seo DH, Choi SM, Hyun JS.
Performing the experiments: Seo DH, Yoon S, Choi JH, Do J, Choi SM. Data acquisition: Kwon SW, Kim SC, Park DS, Song JM, Lee KS, Hyun JS. Data analysis and interpretation: Seo DH, Lee SW, Lee C, Jeh SU, Choi SM, Kam SC. Statistical analysis: Seo DH, Choi SM, Hwa JS, Chung KH. Drafting of the manuscript: Seo DH, Choi SM.
Critical revision of the manuscript: Seo DH, Kam SC, Hyun JS.
Approval of final manuscript: all authors.
ORCID
Deok Ha Seo, https://orcid.org/0000-0002-3883-409X Sol Yoon, https://orcid.org/0000-0002-3627-3858 Jae Hwi Choi, https://orcid.org/0000-0002-9305-2015 Jungmo Do, https://orcid.org/0000-0002-1601-5210 Sin Woo Lee, https://orcid.org/0000-0002-3050-6366 Chunwoo Lee, https://orcid.org/0000-0002-5846-7039 Seong Uk Jeh, https://orcid.org/0000-0002-0206-0555 See Min Choi, https://orcid.org/0000-0002-6599-2640 Sung Chul Kam, https://orcid.org/0000-0001-5403-3623 Jeong Seok Hwa, https://orcid.org/0000-0003-3821-5237 Ky Hyun Chung, https://orcid.org/0000-0003-2854-8708 Sung Won Kwon, https://orcid.org/0000-0002-4178-4521 Sae Chul Kim, https://orcid.org/0000-0002-2040-4251 Dong Soo Park, https://orcid.org/0000-0002-9642-6481 Jae Mann Song, https://orcid.org/0000-0002-5835-0527 Kyung Seop Lee, https://orcid.org/0000-0002-0554-4272 Jae Seog Hyun, https://orcid.org/0000-0002-8820-4117
REFERENCES
1. Parikh NI, Pencina MJ, Wang TJ, Lanier KJ, Fox CS, D'Agostino RB, et al. Increasing trends in incidence of over- weight and obesity over 5 decades. Am J Med 2007;120:
242-50.
2. Guh DP, Zhang W, Bansback N, Amarsi Z, Birmingham CL, Anis AH. The incidence of co-morbidities related to obesity and overweight: a systematic review and meta-analysis.
BMC Public Health 2009;9:88.
3. Faith MS, Butryn M, Wadden TA, Fabricatore A, Nguyen AM, Heymsfield SB. Evidence for prospective associations among depression and obesity in population-based studies.
Obes Rev 2011;12:e438-53.
4. Ananthapavan J, Sacks G, Moodie M, Carter R. Economics of obesity: learning from the past to contribute to a better future. Int J Environ Res Public Health 2014;11:4007-25.
5. Stamey TA, Yang N, Hay AR, McNeal JE, Freiha FS, Redwine E. Prostate-specific antigen as a serum marker for adenocarcinoma of the prostate. N Engl J Med 1987;317:
909-16.
6. Oesterling JE, Chan DW, Epstein JI, Kimball AW Jr, Bruzek DJ, Rock RC, et al. Prostate specific antigen in the pre- operative and postoperative evaluation of localized prostatic cancer treated with radical prostatectomy. J Urol 1988;139:
766-72.
7. Krumholtz JS, Carvalhal GF, Ramos CG, Smith DS, Thorson P, Yan Y, et al. Prostate-specific antigen cutoff of 2.6 ng/mL for prostate cancer screening is associated with favorable pathologic tumor features. Urology 2002;60:469-73; dis- cussion 473-4.
8. Thompson IM, Pauler DK, Goodman PJ, Tangen CM, Lucia MS, Parnes HL, et al. Prevalence of prostate cancer among men with a prostate-specific antigen level < or =4.0 ng per milliliter. N Engl J Med 2004;350:2239-46.
9. Freedland SJ, Wen J, Wuerstle M, Shah A, Lai D, Moalej B, et al. Obesity is a significant risk factor for prostate cancer at the time of biopsy. Urology 2008;72:1102-5.
10. Pietrzyk B, Olszanecka-Glinianowicz M, Owczarek A, Gabryelewicz T, Almgren-Rachtan A, Prajsner A, et al.
Depressive symptoms in patients diagnosed with benign prostatic hyperplasia. Int Urol Nephrol 2015;47:431-40.
11. Parsons JK, Bergstrom J, Silberstein J, Barrett-Connor E.
Prevalence and characteristics of lower urinary tract symp- toms in men aged > or = 80 years. Urology 2008;72:318- 21.
12. Zhao S, Chen C, Chen Z, Xia M, Tang J, Shao S, et al.
Relationship between metabolic syndrome and predictors for clinical benign prostatic hyperplasia progression and in- ternational prostate symptom score in patients with moder- ate to severe lower urinary tract symptoms. Urol J 2016;13:
Korean men. Korean J Urol 2010;51:344-7.
14. Clinical Guidelines on the Identification, Evaluation, and Treatment of Overweight and Obesity in Adults: The Evi- dence Report. National Institutes of Health. Obes Res 1998;
6 Suppl 2:51S-209S.
15. Thompson IM, Leach R, Troyer D, Pollock B, Naylor S, Higgins B. Relationship of body mass index and prostate specific antigen in a population-based study. Urol Oncol 2004;22:127-31.
16. Fowke JH, Motley SS, Cookson MS, Concepcion R, Chang SS, Wills ML, et al. The association between body size, prostate volume and prostate-specific antigen. Prostate Cancer Prostatic Dis 2007;10:137-42.
17. Lee RK, Chung D, Chughtai B, Te AE, Kaplan SA. Central obesity as measured by waist circumference is predictive of severity of lower urinary tract symptoms. BJU Int 2012;110:
540-5.
18. Jeong IG, Hwang SS, Kim HK, Ahn H, Kim CS. The associa- tion of metabolic syndrome and its components with serum prostate-specific antigen levels in a Korean-screened popula- tion. Cancer Epidemiol Biomarkers Prev 2010;19:371-80.
19. Werny DM, Thompson T, Saraiya M, Freedman D, Kottiri BJ, German RR, et al. Obesity is negatively associated with prostate-specific antigen in U.S. men, 2001-2004. Cancer Epidemiol Biomarkers Prev 2007;16:70-6.
20. Freedland SJ, Platz EA, Presti JC Jr, Aronson WJ, Amling CL, Kane CJ, et al. Obesity, serum prostate specific antigen and prostate size: implications for prostate cancer detection. J Urol 2006;175:500-4; discussion 504.
21. Bañez LL, Hamilton RJ, Partin AW, Vollmer RT, Sun L, Rodriguez C, et al. Obesity-related plasma hemodilution and PSA concentration among men with prostate cancer.
JAMA 2007;298:2275-80.
22. Wright ME, Chang SC, Schatzkin A, Albanes D, Kipnis V, Mouw T, et al. Prospective study of adiposity and weight change in relation to prostate cancer incidence and mortality. Cancer 2007;109:675-84.
23. Hekal IA, Ibrahiem EI. Obesity-PSA relationship: a new formula. Prostate Cancer Prostatic Dis 2010;13:186-90.
24. Haidinger G, Temml C, Schatzl G, Brössner C, Roehlich M, Schmidbauer CP, et al. Risk factors for lower urinary tract symptoms in elderly men. For the Prostate Study Group of the Austrian Society of Urology. Eur Urol 2000;37:413-20.
25. Yee CH, So WY, Yip SK, Wu E, Yau P, Ng CF. Effect of weight reduction on the severity of lower urinary tract symptoms in obese male patients with benign prostatic hy- perplasia: a randomized controlled trial. Korean J Urol 2015;56:240-6; discussion 246-7.
26. Cyrus A, Kabir A, Goodarzi D, Talaei A, Moradi A, Rafiee M, et al. Impact of metabolic syndrome on response to medical treatment of benign prostatic hyperplasia. Korean J Urol 2014;55:814-20.
www.wjmh.org 2003;92:575-80.
28. Perchon LF, Pintarelli VL, Bezerra E, Thiel M, Dambros M.
Quality of life in elderly men with aging symptoms and low- er urinary tract symptoms (LUTS). Neurourol Urodyn 2011;
30:515-9.
29. Pintarelli VL, Perchon LF, Lorenzetti F, Toniolo Neto J, Dambros M. Elderly men's quality of life and lower urinary tract symptoms: an intricate relationship. Int Braz J Urol 2011;37:758-65.