ABSTRACT
Although various studies on predictive markers in the use of PD-1/PD-L1 inhibitors are in progress, only PD-L1 expression levels in tumor tissues are currently used. In the present study, we investigated whether baseline serum levels of IL-6 can predict the treatment response of patients with advanced non-small cell lung cancer (NSCLC) treated with PD-1/
PD-L1 inhibitors. In our cohort of 125 NSCLC patients, the objective response rate (ORR) and disease control rate (DCR) were significantly higher in those with low IL-6 (<13.1 pg/ml) than those with high IL-6 (ORR 33.9% vs. 11.1%, p=0.003; DCR 80.6% vs. 34.9%, p<0.001).
The median progression-free survival was 6.3 months (95% confidence interval [CI], 3.9–8.7) in the low IL-6 group, significantly longer than in the high IL-6 group (1.9 months, 95% CI, 1.6–2.2, p<0.001). The median overall survival in the low IL-6 group was significantly longer than in the high IL-6 group (not reached vs. 7.4 months, 95% CI, 4.8–10.0). Thus, baseline serum IL-6 levels could be a potential biomarker for predicting the efficacy and survival benefit of PD-1/PD-L1 inhibitors in NSCLC.
Keywords: IL-6; Lung cancer; Immunological antineoplastic agents; PD-1/PD-L1
INTRODUCTION
The survival of patients with advanced non-small cell lung cancer (NSCLC) has recently improved with the use of targeted agents and immune checkpoint inhibitors (ICIs), including nivolumab, pembrolizumab, and atezolizumab. These ICIs have shown favorable antitumor effects and duration of response as compared to cytotoxic chemotherapy. High expression of PD-L1 with a tumor proportion score (TPS) ≥50% can be a reliable biomarker of the response and survival of ICI treatment. However, the predictive power could be diminished among
Brief Communication
Da Hyun Kang 1,†, Cheol-Kyu Park 2,†, Chaeuk Chung 1, In-Jae Oh 2, Young-Chul Kim 2, Dongil Park 1, Jinhyun Kim 1, Gye Cheol Kwon 3, Insun Kwon 4, Pureum Sun5, Eui-Cheol Shin 6, Jeong Eun Lee 1,*
1Department of Internal Medicine, College of Medicine, Chungnam National University, Daejeon, Korea
2Lung Cancer Clinic, Chonnam National University Hwasun Hospital, Hwasun, Korea
3Department of Laboratory Medicine, College of Medicine, Chungnam National University, Daejeon, Korea
4Clinical Trials Center, Chungnam National University Hospital, Daejeon, Korea
5 Research Institute for Medical Sciences, College of Medicine, Chungnam National University, Daejeon, Korea
6 Laboratory of Immunology and Infectious Diseases, Graduate School of Medical Science and Engineering, Korea Advanced Institute of Science and Technology (KAIST), Daejeon, Korea
Baseline Serum Interleukin-6 Levels Predict the Response of Patients with Advanced Non-small Cell Lung Cancer to PD-1/PD-L1 Inhibitors
Received: Feb 18, 2020 Revised: Apr 26, 2020 Accepted: May 3, 2020
*Correspondence to Jeong Eun Lee
Department of Internal Medicine, College of Medicine, Chungnam National University, 282 Munhwa-ro, Jung-gu, Daejeon 35015, Korea.
E-mail: [email protected] [email protected]
†These authors contributed equally to this work.
Copyright © 2020. The Korean Association of Immunologists
This is an Open Access article distributed under the terms of the Creative Commons Attribution Non-Commercial License (https://
creativecommons.org/licenses/by-nc/4.0/) which permits unrestricted non-commercial use, distribution, and reproduction in any medium, provided the original work is properly cited.
ORCID iDs Da Hyun Kang
https://orcid.org/0000-0002-3495-0931 Cheol-Kyu Park
https://orcid.org/0000-0001-8701-0786 Chaeuk Chung
https://orcid.org/0000-0002-3978-0484 In-Jae Oh
https://orcid.org/0000-0003-4837-1321 Young-Chul Kim
https://orcid.org/0000-0001-7019-7687 Dongil Park
https://orcid.org/0000-0001-7329-1724 Jinhyun Kim
https://orcid.org/0000-0001-5235-2612
Gye Cheol Kwon
https://orcid.org/0000-0002-4886-0590 Insun Kwon
https://orcid.org/0000-0002-1723-436X Eui-Cheol Shin
https://orcid.org/0000-0002-6308-9503 Jeong Eun Lee
https://orcid.org/0000-0001-6173-2748 Conflict of Interest
The authors declare no potential conflicts of interest.
Abbreviations
AE, adverse event; AUC, area under the curve;
CI, confidence interval; CNUH, Chungnam National University Hospital; CNUHH, Chonnam National University Hwasun Hospital; CV, coefficient of variation; DCR, disease control rate; ICI, immune checkpoint inhibitor; IHC, immunohistochemical; NSCLC, non-small cell lung cancer; ORR, objective response rate; OS, overall survival; PFS, progression-free survival; ROC, receiver- operating characteristic; TIL, tumor-infiltrating lymphocyte; TMB, tumor mutation burden;
TPS, tumor proportion score Author Contributions
Conceptualization: Lee JE, Kang DH; Data curation: Kang DH, Park CK, Sun P; Formal analysis: Kang DH, Park CK, Sun P; Funding acquisition: Lee JE, Kang DH; Investigation:
Park D, Chung C, Oh IJ, Kim YC; Methodology:
Shin EC, Lee JE, Kim J, Kwon GC, Kwon I;
Resources: Park D, Chung C, Oh IJ, Kim YC;
Supervision: Lee JE, Shin EC; Validation: Kim J, Kwon GC; Writing - original draft: Kang DH, Park CK; Writing - review & editing: Lee JE, Shin EC.
patients with low (TPS 1%–49%) or no PD-L1 expression (TPS <1%) (1-4). Therefore, various studies have attempted to identify other potential biomarkers, such as tumor mutation burden (TMB), tumor-infiltrating lymphocytes (TILs), changes in peripheral blood CD8+ T cells, and immune cell repertoires (5-7). However, none of these candidate biomarkers are easily available in clinical practice (5).
In contrast to expectations, some patients experienced rapid cancer progression, called hyperprogressive disease, or severe immune-related adverse events (AEs), such as pneumonitis, hepatitis, and encephalitis, leading to the discontinuation of immunotherapy or death (8,9).
Recently, low serum IL-6 levels at baseline were reported to be independent risk factors for immune-related AEs in patients treated with anti-CTLA4 inhibitors in melanoma (10). IL-6 is a pro-inflammatory cytokine, and engagement of IL-6 receptors stimulates Janus kinase and STATs, which regulate cell proliferation and the expression of pro-inflammatory genes (11). Several studies have shown that serum IL-6 levels are associated with tumor stage, size, metastasis, and survival in various cancers (12-15). Serum IL-6 levels are elevated in NSCLC patients compared to normal controls (16) and have been reported to be a prognostic factor for worse overall survival (OS) in NSCLC patients undergoing chemotherapy (17).
Despite the results of previous studies, the application of serum IL-6 levels in clinical practice are limited to inflammatory or infectious diseases. In addition, no study has examined the predictive value of circulating IL-6 levels in patients with NSCLC treated with ICIs. In the present study, we investigated baseline serum IL-6 levels as a predictive marker of the therapeutic effects of PD-1/PD-L1 inhibitors in patients with advanced NSCLC.
MATERIALS AND METHODS
Patients and treatment
This study included patients with advanced NSCLC who were treated with PD-1/PD-L1 inhibitors at Chungnam National University Hospital (CNUH) and Chonnam National University Hwasun Hospital (CNUHH) from January 2018 to March 2019. Patients were given intravenous nivolumab (3 mg per kilogram of body weight every 2 wk), pembrolizumab (2 mg per kilogram of body weight every 3 wk in previously treated patients and 200 mg in previously untreated patients), or atezolizumab (1,200 mg every 3 wk). Treatment was continued until the patient experienced serious AEs, had confirmed investigator-assessed disease progression, or withdrew informed consent. Patients who the investigator expected to experience clinical benefit could continue treatment beyond radiological disease progression.
This study was conducted in accordance with the Declaration of Helsinki and Good Clinical Practice guidelines, and was approved by the Institutional Review Board of each institution (2018-01-059 at Chungnam National University Hospital and CNUHH-2019-108 at Chonnam National University Hwasun Hospital). All patients were required to provide written informed consent before participating in this study.
PD-L1 expression
PD-L1 expression was assessed by qualitative immunohistochemical (IHC) staining using the in vitro diagnostic PD-L1 IHC 22C3 pharmDx test (Agilent Technologies, Santa Clara, CA, USA) on the Dako Autostainer (Dako, Carpinteria, CA, USA) and PD-L1 IHC SP263 test on the Ventana BenchMark platform (Ventana Medical Systems, Tucson, AZ, USA). The
percentage of immunoreactive tumor cells was quantified according to the manufacturer's recommendations. Cancer cells were considered positive when any cell membrane staining was present, ignoring pure cytoplasmic immunoreactions. Staining of immune cells was also disregarded. PD-L1 protein expression was determined based on the percentage of viable tumor cells showing partial or complete membrane staining (TPS) (18). We designed 3 categories of PD-L1 expression according to TPS cut-offs of 1% and 50%: no (<1%), low (1%–49%), and high (≥50%) PD-L1 expression. The classification of subgroups according to PD-L1 expression was based on the results of the 22C3 pharmDx assay, and patients without 22C3 pharmDx assay results were classified based on the SP263 assay.
Serum IL-6 levels
Serum IL-6 levels were measured using the Elecsys IL-6 kit (Roche Diagnostics, Mannheim, Germany) on the electrochemiluminescence-based COBAS e602 (Roche Diagnostics) in a clinical laboratory at CNUH. The measurement range of the Elecsys IL-6 kit is 1.5-5,000 pg/ml, and the reference range is up to 7 pg/ml (95th percentile in normal healthy controls). The intra-assay coefficient of variation (CV) of the kit is less than 6.0% and the inter-assay CV less than 8.5%.
Blood samples were obtained from patients immediately before the administration of ICIs, and the test was performed as soon as possible. Serum samples obtained at CNUHH were separated within 2 h of blood collection on day 1 before initiation of ICI treatment, stored in a deep freezer, and transferred to a central lab in CNUH for testing.
Treatment response and survival analysis
A response assessment with computed tomography was performed every 3 cycles for patients treated with pembrolizumab or atezolizumab, and every 4 cycles for patients treated with nivolumab. The response to ICI treatment was assessed based on the Response Evaluation Criteria in Solid Tumors version 1.1. Clinical benefit was defined using the disease control rate (DCR), including partial response and stable disease.
Progression-free survival (PFS) was defined as the time from the date of the first ICI
treatment to the date of documented progression or death from any cause. OS was measured from the date of the first ICI treatment to the date of death or the last day of follow-up.
Statistical analysis
To calculate the sensitivity and specificity of biomarkers, conventional receiver-operating characteristic (ROC) curves were generated and the area under the curve (AUC) calculated.
The optimal cut-off value was determined as the point at which the Youden index was maximized by the ROC curve. Chi-squared and independent t-tests were used to analyze differences in patients' clinicopathological data. Survival was estimated using the Kaplan- Meier method and survival rates compared using the log-rank test. The p<0.05 was
considered significant. SPSS version 22 (IBM Corp., Armonk, NY, USA) and MedCalc (version 19) were used for all statistical analyses.
RESULTS
Patient baseline characteristics
From January 2018 to March 2019, a total of 125 patients were enrolled in the study: 54 patients at CNUH and 71 patients at CNUHH. The baseline characteristics and efficacy
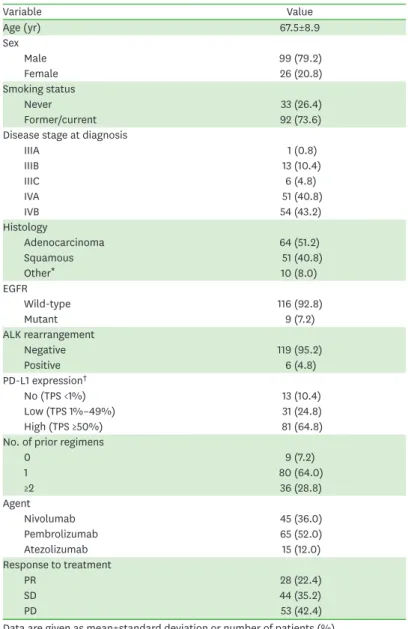
outcomes of ICI treatment are summarized in Table 1. The mean age was 67.5±8.9 years, and most patients were male and former/current smokers. The major histological types were adenocarcinoma (51.2%) and squamous cell carcinoma (40.8%). Most patients had stage IV NSCLC and had received at least one previous systemic treatment. A total of 35.2% (44/125) of patients had no/low expression of PD-L1, and 64.8% (81/125) of patients had high PD-L1 expression. The objective response rate (ORR) to ICI treatment in all patients was 22.4%
(28/125) and the DCR was 57.6% (72/125).
Predictive value of baseline serum IL-6 levels
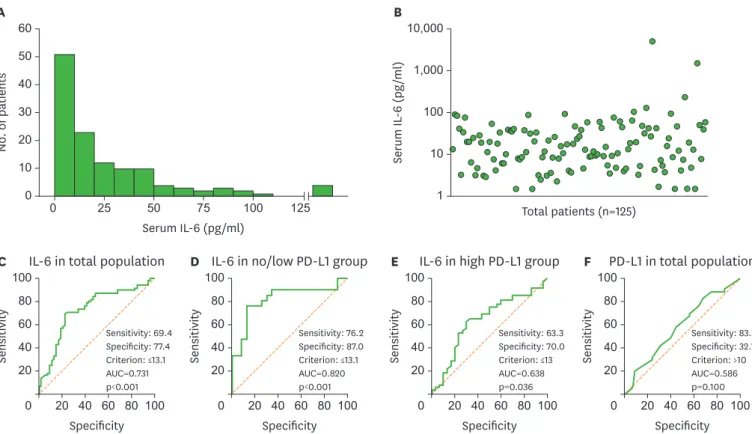
The distribution of the baseline serum IL-6 levels among the patient population is shown in Fig. 1A. The median value was 13.5 pg/ml. The scatter plot of individual serum IL-6 levels
Table 1. Baseline characteristics and efficacy outcomes in all patients (n=125)
Variable Value
Age (yr) 67.5±8.9
Sex
Male 99 (79.2)
Female 26 (20.8)
Smoking status
Never 33 (26.4)
Former/current 92 (73.6)
Disease stage at diagnosis
IIIA 1 (0.8)
IIIB 13 (10.4)
IIIC 6 (4.8)
IVA 51 (40.8)
IVB 54 (43.2)
Histology
Adenocarcinoma 64 (51.2)
Squamous 51 (40.8)
Other* 10 (8.0)
EGFR
Wild-type 116 (92.8)
Mutant 9 (7.2)
ALK rearrangement
Negative 119 (95.2)
Positive 6 (4.8)
PD-L1 expression†
No (TPS <1%) 13 (10.4)
Low (TPS 1%–49%) 31 (24.8)
High (TPS ≥50%) 81 (64.8)
No. of prior regimens
0 9 (7.2)
1 80 (64.0)
≥2 36 (28.8)
Agent
Nivolumab 45 (36.0)
Pembrolizumab 65 (52.0)
Atezolizumab 15 (12.0)
Response to treatment
PR 28 (22.4)
SD 44 (35.2)
PD 53 (42.4)
Data are given as mean±standard deviation or number of patients (%).
EGFR, epidermal growth factor receptor; ALK, anaplastic lymphoma kinase; PR, partial response; SD, stable disease; PD, progression disease.
*One adenosquamous, 3 large cell, one large cell neuroendocrine, 5 non-small cell lung cancer not otherwise specified; †The classification of subgroups according to PD-L1 expression was based on the results of the 22C3 pharmDx assay, and patients without 22C3 pharmDx assay results were classified based on the SP263 assay.
in all patients is shown in Fig. 1B. In the ROC curve for distinguishing patients with disease control from the total population, the AUC for IL-6 was 0.731 (p<0.001) based on a 13.1 pg/ml cut-off (Fig. 1C). The AUC was 0.820 (p<0.001) based on the same cut-offs in patients with no or low PD-L1 expression, which exhibited higher sensitivity and specificity than in the total population (Fig. 1D). The AUC was 0.638 (p=0.036) based on the same cut-offs in patients with high PD-L1 expression, which represents lower sensitivity and specificity than in the total population (Fig. 1E). In the ROC curve for disease control, the AUC for PD-L1 expression level, which is currently used as a predictive marker, was 0.586 (p=0.100) based on a 10%
cut-off (Fig. 1F).
Clinical outcomes according to serum IL-6 levels
Based on the cut-off value for baseline IL-6 determined by the ROC curve analysis (13.1 pg/
ml), all patients were classified as low IL-6 (62 patients) or high IL-6 (63 patients). Baseline characteristics (age, sex, disease stage, PD-L1 expression, histological type, number of prior regimens, and type of agents) were not significantly different between the 2 groups (Table 2).
The ORR of the low IL-6 group was 33.9%, which is significantly higher than the ORR in the high IL-6 group (11.1%, p=0.003), and the DCR of the low IL-6 group was 80.6%, which is significantly higher than the DCR in the high IL-6 group (34.9%, p<0.001).
Subgroup analysis was performed in patients based on PD-L1 expression. Eighty-one patients with high PD-L1 expression were classified according to the same IL-6 cut-off criteria: 43 0
100 80 60 40 20
20 40 60 80 100 Specificity
Sensitivity
C IL-6 in total population
Sensitivity: 69.4 Specificity: 77.4 Criterion: ≤13.1 AUC=0.731 p<0.001
A
0 0 60
40 50
30 20 10
25 50 75 100 125
Serum IL-6 (pg/ml)
No. of patients
0 100 80 60 40 20
20 40 60 80 100 Specificity
Sensitivity
D IL-6 in no/low PD-L1 group
Sensitivity: 76.2 Specificity: 87.0 Criterion: ≤13.1 AUC=0.820 p<0.001
0 100 80 60 40 20
20 40 60 80 100 Specificity
Sensitivity
E IL-6 in high PD-L1 group
Sensitivity: 63.3 Specificity: 70.0 Criterion: ≤13 AUC=0.638 p=0.036
0 100 80 60 40 20
20 40 60 80 100 Specificity
Sensitivity
F PD-L1 in total population
Sensitivity: 83.3 Specificity: 32.1 Criterion: >10 AUC=0.586 p=0.100
B
1 10,000
1,000
100
10
Total patients (n=125)
Serum IL-6 (pg/ml)
Figure 1. Predictive value of serum IL-6 in lung cancer patients treated with PD-1/PD-L1 inhibitors. (A) Histogram of serum IL-6 levels in all patients. (B) Scatter plot of individual serum IL-6 levels in all patients. (C) The AUC for IL-6 was 0.731 (p<0.001) based on a 13.1 pg/ml cut-off in the ROC curve for distinguishing patients with disease control from the total population (n=125). (D) The AUC for IL-6 was 0.820 (p<0.001) based on a 13.1 pg/ml cut-off in the ROC curve for the DCR in patients with no or low PD-L1 expression (n=44). (E) The AUC for IL-6 was 0.638 (p=0.036) based on a 13.1 pg/ml cut-off in the ROC curve for the DCR in patients with high PD-L1 expression (n=81). (F) The AUC for PD-L1 expression was 0.586 (p=0.100) based on a 10% cut-off for PD-L1 in the ROC curve for the DCR in all patients (n=125).
patients in the low IL-6 group and 38 patients in the high IL-6 group. The ORR and DCR were significantly higher in the low IL-6 group than the high IL-6 group (p=0.045 and p=0.002, respectively). Forty-four patients with no or low PD-L1 expression were classified according to the same IL-6 cut-off criteria: 19 patients in the low IL-6 group and 25 patients in the high IL-6 group. The ORR and DCR were significantly higher in the low IL-6 group than the high IL-6 group (p=0.033 and p<0.001, respectively). These differences were more prominent than in the total population and high PD-L1 group (Table 2).
Survival analysis according to serum IL-6 levels
The median PFS of the low IL-6 group was 6.3 months (95% confidence interval [CI], 3.9–8.7), which is significantly longer than the PFS in the high IL-6 group (1.9 months, Table 2. Baseline characteristics and clinical outcomes according to baseline serum IL-6 level
Variable Total patients (n=125) No/low PD-L1 group (n=44) High PD-L1 group (n=81)
Low IL-6 (n=62) High IL-6 (n=63) p-value Low IL-6 (n=19) High IL-6 (n=25) p-value Low IL-6 (n=43) High IL-6 (n=38) p-value
Age (yr) 68.7±7.6 66.3±9.9 0.123 69.0±6.7 65.3±8.4 0.129 68.6±8.0 66.9±10.9 0.423
Sex 0.192 0.620 0.263
Male 46 (74.2) 53 (84.1) 14 (73.7) 20 (80.0) 32 (74.4) 33 (86.8)
Female 16 (25.8) 10 (15.9) 5 (26.3) 5 (20.0) 11 (25.6) 5 (13.2)
Smoking status 0.160 0.214 0.347
Never 20 (32.3) 13 (20.6) 7 (36.8) 5 (20.0) 13 (30.2) 8 (21.1)
Former/current 42 (67.7) 50 (79.4) 12 (63.2) 20 (80.0) 30 (69.8) 30 (78.9)
Disease stage at diagnosis 0.111 0.024 0.546
IIIA 1 (1.6) 0 (0.0) 0 (0.0) 0 (0.0) 1 (2.3) 0 (0.0)
IIIB 9 (14.5) 4 (6.3) 3 (15.8) 0 (0.0) 6 (14.0) 4 (10.5)
IIIC 3 (4.8) 3 (4.8) 0 (0.0) 2 (8.0) 3 (7.0) 1 (2.6)
IVA 29 (46.8) 22 (34.9) 10 (52.6) 7 (28.0) 19 (44.2) 15 (39.5)
IVB 20 (32.3) 34 (54.0) 6 (31.6) 16 (64.0) 14 (32.6) 18 (47.4)
Histology 0.173 0.473 0.028
Adenocarcinoma 33 (53.2) 31 (49.2) 9 (47.4) 14 (56.0) 24 (55.8) 17 (44.7)
Squamous 27 (43.5) 24 (38.1) 9 (47.4) 11 (44.0) 18 (41.9) 13 (34.2)
Other* 2 (3.2) 8 (12.7) 1 (5.3) 0 (0.0) 1 (2.3) 8 (21.1)
PD-L1 expression† 0.518
No (TPS <1%) 5 (8.1) 8 (12.7) 5 (26.3) 8 (32.0) 0.682 - - -
Low (TPS 1%–49%) 14 (22.6) 17 (27.0) 14 (73.7) 17 (68.0) - - -
High (TPS ≥50%) 43 (69.4) 38 (60.3) - - - - - -
No. of prior regimens 0.115 0.052 0.359
0 6 (9.7) 3 (4.8) 0 (0.0) 1 (4.0) 6 (14.0) 2 (5.3)
1 43 (69.4) 37 (58.7) 17 (89.5) 14 (56.0) 26 (60.5) 23 (60.5)
≥2 13 (21.0) 23 (36.5) 2 (10.5) 10 (40.0) 11 (25.6) 13 (34.2)
Agent 0.279 0.793 0.565
Nivolumab 21 (33.9) 24 (38.1) 15 (78.9) 18 (72.0) 6 (14.0) 6 (15.8)
Pembrolizumab 36 (58.1) 29 (46.0) 1 (5.3) 1 (4.0) 35 (81.4) 28 (73.7)
Atezolizumab 5 (8.1) 10 (15.9) 3 (15.8) 6 (24.0) 2 (4.7) 4 (10.5)
Response
PR 21 (33.9) 7 (11.1) <0.001 5 (26.3) 1 (4.0) <0.001 16 (37.2) 6 (15.8) 0.005
SD 29 (46.8) 15 (23.8) 11 (57.9) 4 (16.0) 18 (41.9) 11 (28.9)
PD 12 (19.4) 41 (65.1) 3 (15.8) 20 (80.0) 9 (20.9) 21 (55.3)
ORR 21 (33.9) 7 (11.1) 0.003 5 (26.3) 1 (4.0) 0.033 16 (37.2) 6 (15.8) 0.045
DCR 50 (80.6) 22 (34.9) <0.001 16 (84.2) 5 (20.0) <0.001 34 (79.1) 17 (44.7) 0.002
AEs
Immune-related 17 (27.4) 14 (22.2) 0.540 4 (21.1) 7 (28.0) 0.731 13 (30.2) 7 (18.4) 0.303
Severe immune-related 11 (17.7) 10 (15.9) 0.815 3 (15.8) 5 (20.0) 1.000 8 (18.6) 5 (13.2) 0.558
Data are given as mean±standard deviation or number of patients (%).
PR, partial response; SD, stable disease; PD, progressive disease.
*One adenosquamous, 3 large cell, one large cell neuroendocrine, 5 non-small cell lung cancer NSCLC not otherwise specified; †The classification of subgroups according to PD-L1 expression was based on the results of the 22C3 pharmDx assay, and patients without 22C3 pharmDx assay results were classified based on the SP263 assay.
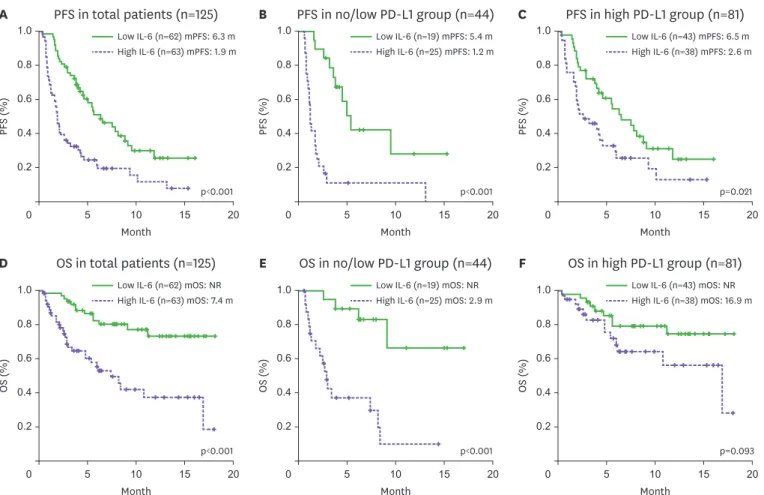
95% CI, 1.6–2.2, p<0.001; Fig. 2A). In the subgroup analysis of patients with no/low PD-L1 expression, the median PFS of the low IL-6 group was 5.4 months (95% CI, 4.0–6.8), which is significantly longer than the PFS in the high IL-6 group (1.2 months, 95% CI, 1.0–1.4, p<0.001; Fig. 2B). Among patients with high PD-L1 expression, the median PFS of the low IL-6 group was 6.5 months (95% CI, 3.9–9.1), which is significantly longer than the PFS in the high IL-6 group (2.6 months, 95% CI, 0.3–4.9, p=0.021; Fig. 2C).
The median OS of patients in the low IL-6 group was significantly longer than the OS in the high IL-6 group (not reached vs. 7.4 months, 95% CI, 4.8–10.0, p<0.001; Fig. 2D). In the subgroup analysis of patients with no/low PD-L1 expression, the median OS of the low IL-6 group was significantly longer than the OS in the high IL-6 group (not reached vs. 2.9 months, 95% CI, 2.2–3.6, p<0.001; Fig. 2E). In patients with high PD-L1 expression, we found no significant difference in OS between the low IL-6 and high IL-6 groups (not reached vs. 16.9 months, 95% CI, 8.1–25.7, p=0.093; Fig. 2F).
A
PFS (%)
0 5 10 15 20
1.0
0.6 0.8
0.4 0.2
Month
PFS in total patients (n=125)
p<0.001 Low IL-6 (n=62) mPFS: 6.3 m High IL-6 (n=63) mPFS: 1.9 m
B
PFS (%)
0 5 10 15 20
1.0
0.6 0.8
0.4 0.2
Month
PFS in no/low PD-L1 group (n=44)
p<0.001 Low IL-6 (n=19) mPFS: 5.4 m High IL-6 (n=25) mPFS: 1.2 m
C
PFS (%)
0 5 10 15 20
1.0
0.6 0.8
0.4 0.2
Month
PFS in high PD-L1 group (n=81)
p=0.021 Low IL-6 (n=43) mPFS: 6.5 m High IL-6 (n=38) mPFS: 2.6 m
D
OS (%)
0 5 10 15 20
1.0
0.6 0.8
0.4 0.2
Month
OS in total patients (n=125)
p<0.001 Low IL-6 (n=62) mOS: NR High IL-6 (n=63) mOS: 7.4 m
E
OS (%)
0 5 10 15 20
1.0
0.6 0.8
0.4 0.2
Month
OS in no/low PD-L1 group (n=44)
p<0.001 Low IL-6 (n=19) mOS: NR High IL-6 (n=25) mOS: 2.9 m
F
OS (%)
0 5 10 15 20
1.0
0.6 0.8
0.4 0.2
Month
OS in high PD-L1 group (n=81)
p=0.093 Low IL-6 (n=43) mOS: NR High IL-6 (n=38) mOS: 16.9 m
Figure 2. Survival analysis according to the baseline serum IL-6 level in lung cancer patients treated with PD-1/PD-L1 inhibitors. (A) PFS in all patients (n=125).
The median PFS of the low IL-6 group was 6.3 months (95% CI, 3.9–8.7), which is significantly longer than the PFS in the high IL-6 group (1.9 months, 95% CI, 1.6–2.2, p<0.001). (B) PFS in the no/low PD-L1 group (n=44). The median PFS of the low IL-6 group was 5.4 months (95% CI, 4.0–6.8), which is significantly longer than the PFS in the high IL-6 group (1.2 months, 95% CI, 1.0–1.4, p<0.001). (C) PFS in the high PD-L1 group (n=81). The median PFS of the low IL-6 group was 6.5 months (95% CI, 3.9–9.1), which is significantly longer than the PFS in the high IL-6 group (2.6 months, 95% CI, 0.3–4.9, p=0.021). (D) OS in total patients (n=125). The median OS of patients in the low IL-6 group was significantly longer than the OS in the high IL-6 group (not reached vs. 7.4 months, 95% CI, 4.8–10.0, p<0.001). (E) OS in the no/low PD-L1 group (n=44). The median OS of the low IL-6 group was significantly longer than the OS in the high IL-6 group (not reached vs. 2.9 months, 95% CI, 2.2–3.6, p<0.001). (F) OS in the high PD-L1 group (n=81). We found no significant difference in OS between the low IL-6 and high IL-6 groups (not reached vs. 16.9 months, 95% CI, 8.1–25.7, p=0.093).
DISCUSSION
This is the first study to demonstrate that baseline levels of circulating IL-6 can be a potential marker for predicting the response and survival after ICI treatment in advanced NSCLC patients. Serum IL-6 levels have been identified as a prognostic factor for poor outcomes in various cancers, but little is known about their value in immunotherapy. In this study, baseline serum IL-6 levels were found to be a biomarker with high sensitivity and specificity for predicting the clinical benefit of ICI treatment, especially in advanced NSCLC patients with no/low PD-L1 expression. In addition, baseline serum IL-6 levels are better predictors in response to PD-l/PD-L1 inhibitors than PD-L1 expression levels in tumor tissue, which are conventionally used in the clinic.
ICIs have led to significant paradigm changes in the treatment of NSCLC, but a lack of a clear biomarker that can predict the efficacy of ICIs is still an unmet need in clinical settings. High PD-L1 expression in tumor tissues has been identified as predictive of a favorable outcome of ICI treatment, but the predictive power is very low in patients with no or low PD-L1 expression.
PD-L1 IHC as a predictive and prognostic biomarker has limitations due to tumor heterogeneity and sampling variability (19,20). TIL density is a tumor microenvironment-related biomarker associated with a clinical benefit of ICIs, but its predictive power is not satisfactory (21).
The TMB is a tumor intrinsic feature-related biomarker, and several studies have shown that it significantly correlates with the ORR and survival of ICI treatment, regardless of PD-L1 expression (22,23). However, tissue biopsy for a single tumor site does not fully represent the global landscape of clonal mutations (24), and tissue TMB still has limitations in clinical applications due to various testing methods and unclear cut-offs (25-27). Several studies have shown that blood-based biomarkers, such as peripheral immune cells, neutrophil/lymphocyte ratios, and peripheral cytokines, are associated with the treatment response to ICIs. However, the majority of candidates are under investigation and require validation (6,7,28).
Cytokine profiles in the peripheral blood can reflect the systemic immune conditions of patients.
Systemic inflammation clearly affects the efficacy of immunotherapy in cancer patients (29).
In advanced melanoma patients, pre-treatment serum levels of interferon-gamma, IL-6, and IL-10 are significantly higher in responders than in non-responders (28), and high IL-6 levels at baseline have been associated with resistance to ipilimumab treatment in small cell lung cancer patients (30). Although changes in serum IL-8 levels after treatment predicted the response to anti-PD-1 treatment, baseline serum IL-6 and IL-8 levels do not differ significantly between responders and non-responders (31). That previous study was performed on patients treated with PD-1 inhibitor, the same drug used in the present study, but the main target disease was malignant melanoma, and a very small number of NSCLC patients were included. Even with the same drug, predictive factors for the treatment response may be different depending on the type of cancer. In the present study, we confirmed that the treatment response and survival were significantly different based on baseline serum IL-6 levels in a larger number of NSCLC patients.
Increased IL-6 signaling in the tumor microenvironment induces STAT3 activation, which inhibits Th1 cell activation by suppressing MHC class II expression in dendritic cells (12,32-34).
Based on this mechanism, several murine model studies have demonstrated that IL-6 is involved in ICI resistance in pancreatic cancer and hepatocellular carcinoma, and a combination of IL-6 blockade and anti-PD-L1 blocking antibody is more effective than each treatment (35,36).
This study has some limitations. First, the basic mechanism underlying the correlation between baseline serum IL-6 levels and treatment response has not been established.
Additional experimental studies are needed to determine why the efficacy of immune checkpoint blockade is low when the levels of circulating IL-6 are elevated. Second, the number of patients involved in this study was not enough to come to a definitive conclusion, and serum IL-6 levels were not validated in an independent validation cohort. Thus, our results must be further validated in larger cohorts.
Serum IL-6 levels can easily be tested in a short period of time with a small volume of blood.
In this study, we found that the baseline serum IL-6 level is associated with clinical benefit and significantly longer PFS and OS in NSCLC patients treated with ICIs, especially in patients with no or low PD-L1 expression. In conclusion, serum IL-6 could be a potential biomarker to predict the efficacy and survival benefit of immunotherapy in NSCLC patients.
ACKNOWLEDGEMENTS
This research was supported by the Basic Science Research Program through the National Research Foundation of Korea (NRF) funded by the Ministry of Education, Science and Technology (NRF-2018R1D1A1B07050870 and NRF-2019R1C1C1008864).
The biospecimens and data recruited from Chonnam National University Hwasun Hospital (CNUHH) were provided by the Biobank of CNUHH, a member of the Korea Biobank Network.
A patent for this research has been submitted and is under review in Korea (10-2019-0004082).
REFERENCES
1. Borghaei H, Paz-Ares L, Horn L, Spigel DR, Steins M, Ready NE, Chow LQ, Vokes EE, Felip E, Holgado E, et al. Nivolumab versus docetaxel in advanced nonsquamous non–small-cell lung cancer. N Engl J Med 2015;373:1627-1639.
PUBMED | CROSSREF
2. Brahmer J, Reckamp KL, Baas P, Crinò L, Eberhardt WE, Poddubskaya E, Antonia S, Pluzanski A, Vokes EE, Holgado E, et al. Nivolumab versus docetaxel in advanced squamous-cell non–small-cell lung cancer.
N Engl J Med 2015;373:123-135.
PUBMED | CROSSREF
3. Herbst RS, Baas P, Kim DW, Felip E, Pérez-Gracia JL, Han JY, Molina J, Kim JH, Arvis CD, Ahn MJ, et al.
Pembrolizumab versus docetaxel for previously treated, PD-L1-positive, advanced non-small-cell lung cancer (KEYNOTE-010): a randomised controlled trial. Lancet 2016;387:1540-1550.
PUBMED | CROSSREF
4. Rittmeyer A, Barlesi F, Waterkamp D, Park K, Ciardiello F, von Pawel J, Gadgeel SM, Hida T, Kowalski DM, Dols MC, et al. Atezolizumab versus docetaxel in patients with previously treated non-small-cell lung cancer (OAK): a phase 3, open-label, multicentre randomised controlled trial. Lancet 2017;389:255-265.
PUBMED | CROSSREF
5. Topalian SL, Taube JM, Anders RA, Pardoll DM. Mechanism-driven biomarkers to guide immune checkpoint blockade in cancer therapy. Nat Rev Cancer 2016;16:275-287.
PUBMED | CROSSREF
6. Mitsuhashi A, Okuma Y. Perspective on immune oncology with liquid biopsy, peripheral blood mononuclear cells, and microbiome with non-invasive biomarkers in cancer patients. Clin Transl Oncol 2018;20:966-974.
PUBMED | CROSSREF
7. Kim KH, Cho J, Ku BM, Koh J, Sun JM, Lee SH, Ahn JS, Cheon J, Min YJ, Park SH, et al. The first-week proliferative response of peripheral blood PD-1+ CD8+ T cells predicts the response to anti-PD-1 therapy in solid tumors. Clin Cancer Res 2019;25:2144-2154.
PUBMED | CROSSREF
8. Kang DH, Chung C, Kim JO, Jung SS, Park HS, Park DI, Jung SY, Park M, Lee JE. Pleural or pericardial metastasis: a significant factor affecting efficacy and adverse events in lung cancer patients treated with PD-1/PD-L1 inhibitors. Thorac Cancer 2018;9:1500-1508.
PUBMED | CROSSREF
9. Kurman JS, Murgu SD. Hyperprogressive disease in patients with non-small cell lung cancer on immunotherapy. J Thorac Dis 2018;10:1124-1128.
PUBMED | CROSSREF
10. Valpione S, Pasquali S, Campana LG, Piccin L, Mocellin S, Pigozzo J, Chiarion-Sileni V. Sex and interleukin-6 are prognostic factors for autoimmune toxicity following treatment with anti-CTLA4 blockade. J Transl Med 2018;16:94.
PUBMED | CROSSREF
11. Hodge DR, Hurt EM, Farrar WL. The role of IL-6 and STAT3 in inflammation and cancer. Eur J Cancer 2005;41:2502-2512.
PUBMED | CROSSREF
12. Kitamura H, Ohno Y, Toyoshima Y, Ohtake J, Homma S, Kawamura H, Takahashi N, Taketomi A.
Interleukin-6/STAT3 signaling as a promising target to improve the efficacy of cancer immunotherapy.
Cancer Sci 2017;108:1947-1952.
PUBMED | CROSSREF
13. Chung YC, Chang YF. Serum interleukin-6 levels reflect the disease status of colorectal cancer. J Surg Oncol 2003;83:222-226.
PUBMED | CROSSREF
14. Nakashima J, Tachibana M, Horiguchi Y, Oya M, Ohigashi T, Asakura H, Murai M. Serum interleukin 6 as a prognostic factor in patients with prostate cancer. Clin Cancer Res 2000;6:2702-2706.
PUBMED
15. Zhang GJ, Adachi I. Serum interleukin-6 levels correlate to tumor progression and prognosis in metastatic breast carcinoma. Anticancer Res 1999;19:1427-1432.
PUBMED
16. Silva EM, Mariano VS, Pastrez PR, Pinto MC, Castro AG, Syrjanen KJ, Longatto-Filho A. High systemic IL-6 is associated with worse prognosis in patients with non-small cell lung cancer. PLoS One 2017;12:e0181125.
PUBMED | CROSSREF
17. Chang CH, Hsiao CF, Yeh YM, Chang GC, Tsai YH, Chen YM, Huang MS, Chen HL, Li YJ, Yang PC, et al.
Circulating interleukin-6 level is a prognostic marker for survival in advanced nonsmall cell lung cancer patients treated with chemotherapy. Int J Cancer 2013;132:1977-1985.
PUBMED | CROSSREF
18. Park HY, Oh IJ, Kho BG, Kim TO, Shin HJ, Park CK, Kwon YS, Kim YI, Lim SC, Kim YC, et al. Clinical characteristics of Korean patients with lung cancer who have programmed death-ligand 1 expression.
Tuberc Respir Dis 2019;82:227-233.
PUBMED | CROSSREF
19. Madore J, Vilain RE, Menzies AM, Kakavand H, Wilmott JS, Hyman J, Yearley JH, Kefford RF, Thompson JF, Long GV, et al. PD-L1 expression in melanoma shows marked heterogeneity within and between patients: implications for anti-PD-1/PD-L1 clinical trials. Pigment Cell Melanoma Res 2015;28:245-253.
PUBMED | CROSSREF
20. McLaughlin J, Han G, Schalper KA, Carvajal-Hausdorf D, Pelekanou V, Rehman J, Velcheti V, Herbst R, LoRusso P, Rimm DL. Quantitative assessment of the heterogeneity of pd-l1 expression in non–small-cell lung cancer. JAMA Oncol 2016;2:46-54.
PUBMED | CROSSREF
21. Xing X, Guo J, Ding G, Li B, Dong B, Feng Q, Li S, Zhang J, Ying X, Cheng X, et al. Analysis of PD1, PDL1, PDL2 expression and T cells infiltration in 1014 gastric cancer patients. OncoImmunology 2017;7:e1356144.
PUBMED | CROSSREF
22. Goodman AM, Kato S, Bazhenova L, Patel SP, Frampton GM, Miller V, Stephens PJ, Daniels GA, Kurzrock R. Tumor mutational burden as an independent predictor of response to immunotherapy in diverse cancers. Mol Cancer Ther 2017;16:2598-2608.
PUBMED | CROSSREF
23. Yarchoan M, Hopkins A, Jaffee EM. Tumor mutational burden and response rate to pd-1 inhibition. N Engl J Med 2017;377:2500-2501.
PUBMED | CROSSREF
24. McGranahan N, Furness AJ, Rosenthal R, Ramskov S, Lyngaa R, Saini SK, Jamal-Hanjani M, Wilson GA, Birkbak NJ, Hiley CT, et al. Clonal neoantigens elicit T cell immunoreactivity and sensitivity to immune checkpoint blockade. Science 2016;351:1463-1469.
PUBMED | CROSSREF
25. Voong KR, Feliciano J, Becker D, Levy B. Beyond PD-L1 testing-emerging biomarkers for immunotherapy in non-small cell lung cancer. Ann Transl Med 2017;5:376.
PUBMED | CROSSREF
26. Teng F, Meng X, Kong L, Yu J. Progress and challenges of predictive biomarkers of anti PD-1/PD-L1 immunotherapy: a systematic review. Cancer Lett 2018;414:166-173.
PUBMED | CROSSREF
27. Yi M, Jiao D, Xu H, Liu Q, Zhao W, Han X, Wu K. Biomarkers for predicting efficacy of PD-1/PD-L1 inhibitors. Mol Cancer 2018;17:129.
PUBMED | CROSSREF
28. Yamazaki N, Kiyohara Y, Uhara H, Iizuka H, Uehara J, Otsuka F, Fujisawa Y, Takenouchi T, Isei T, Iwatsuki K, et al. Cytokine biomarkers to predict antitumor responses to nivolumab suggested in a phase 2 study for advanced melanoma. Cancer Sci 2017;108:1022-1031.
PUBMED | CROSSREF
29. Kauffmann-Guerrero D, Kahnert K, Syunyaeva Z, Kiefel R, Tufman A, Huber RM. Pretherapeutic inflammation status and cytokine profile may predict response to immunotherapy in NSCLC patients.
Ann Oncol 2017;28:xi12.
PUBMED | CROSSREF
30. Hardy-Werbin M, Rocha P, Arpi O, Taus Á, Nonell L, Durán X, Villanueva X, Joseph-Pietras D, Nolan L, Danson S, et al. Serum cytokine levels as predictive biomarkers of benefit from ipilimumab in small cell lung cancer. OncoImmunology 2019;8:e1593810.
PUBMED | CROSSREF
31. Sanmamed MF, Perez-Gracia JL, Schalper KA, Fusco JP, Gonzalez A, Rodriguez-Ruiz ME, Oñate C, Perez G, Alfaro C, Martín-Algarra S, et al. Changes in serum interleukin-8 (IL-8) levels reflect and predict response to anti-PD-1 treatment in melanoma and non-small-cell lung cancer patients. Ann Oncol 2017;28:1988-1995.
PUBMED | CROSSREF
32. Ohno Y, Toyoshima Y, Yurino H, Monma N, Xiang H, Sumida K, Kaneumi S, Terada S, Hashimoto S, Ikeo K, et al. Lack of interleukin-6 in the tumor microenvironment augments type-1 immunity and increases the efficacy of cancer immunotherapy. Cancer Sci 2017;108:1959-1966.
PUBMED | CROSSREF
33. Kitamura H, Kamon H, Sawa S, Park SJ, Katunuma N, Ishihara K, Murakami M, Hirano T. IL-6-STAT3 controls intracellular MHC class II αβ dimer level through cathepsin S activity in dendritic cells. Immunity 2005;23:491-502.
PUBMED | CROSSREF
34. Park SJ, Nakagawa T, Kitamura H, Atsumi T, Kamon H, Sawa S, Kamimura D, Ueda N, Iwakura Y, Ishihara K, et al. IL-6 regulates in vivo dendritic cell differentiation through STAT3 activation. J Immunol 2004;173:3844-3854.
PUBMED | CROSSREF
35. Liu H, Shen J, Lu K. IL-6 and PD-L1 blockade combination inhibits hepatocellular carcinoma cancer development in mouse model. Biochem Biophys Res Commun 2017;486:239-244.
PUBMED | CROSSREF
36. Mace TA, Shakya R, Pitarresi JR, Swanson B, McQuinn CW, Loftus S, Nordquist E, Cruz-Monserrate Z, Yu L, Young G, et al. IL-6 and PD-L1 antibody blockade combination therapy reduces tumour progression in murine models of pancreatic cancer. Gut 2018;67:320-332.
PUBMED | CROSSREF