ISSN 2234-3806 • eISSN 2234-3814
http://dx.doi.org/10.3343/alm.2014.34.1.7
Quantification of Human Plasma-Busulfan
Concentration by Liquid Chromatography-Tandem Mass Spectrometry
Soo Young Moon, M.D.1, Min Kyoo Lim, M.T.1, Susie Hong, M.T.1, Yongbum Jeon, M.D.1, Minje Han, M.D.1, Sang Hoon Song, M.D.1, Kyoung Soo Lim, M.D.2, Kyung-Sang Yu, M.D.2, In-Jin Jang, M.D.2, Ji Won Lee, M.D.3, Hyoung Jin Kang, M.D.3, and Junghan Song, M.D.4
Departments of Laboratory Medicine1, Pharmacology and Clinical Pharmacology2, and Pediatrics3, Seoul National University Hospital, Seoul; Department of Laboratory Medicine4, Seoul National University Bundang Hospital, Seongnam, Korea
Background: Busulfan, an alkylating agent administered prior to hematopoietic stem cell transplantation, has a narrow therapeutic range and wide variability in metabolism. We developed a liquid chromatography-tandem mass spectrometry (LC-MS/MS) method for rapid and accurate quantification of plasma busulfan.
Methods: Busulfan was separated and detected using an LC system containing a C18 column equipped with MS/MS. The sample was eluted with a mobile phase gradient for a total run time of 10 min. Plasma busulfan concentration was quantified against a 6-point standard curve in a multiple reaction monitoring mode at mass-to-charge (m/z) 264.1 >
151.1. Precision, recovery, matrix effect, linearity, detection capability, carryover, and sta- bility were evaluated. The range of plasma busulfan concentration was obtained by ana- lyzing samples from 9 children receiving busulfan.
Results: The coefficients of variation of within-run and within-laboratory precision were all below 5%. Recoveries were all within the range of 100-105%. Linearity was verified from 0 to 5,000 ng/mL. Limit of detection and limit of quantification were 1.56 and 25 ng/mL, respectively. Carryover rate was within allowable limits. Plasma busulfan concentration was stable for 2 weeks at -20°C and -80°C, but decreased by 25% when the plasma was stored for 24 hr at room temperature, and by <5% in 24 hr at 4°C. The plasma busulfan concentrations were between 347 ng/mL and 5,076 ng/mL.
Conclusions: Our method using LC-MS/MS enables highly accurate, reproducible, and rapid busulfan monitoring with minimal sample preparation. The method may also enable safe and proper dosage.
Key Words: Busulfan, Drug monitoring, Tandem mass spectrometry, Liquid chromatogra- phy, Hematopoietic stem cell transplantation
Received: May 17, 2013 Revision received: June 27, 2013 Accepted: August 1, 2013
Corresponding author: Sang Hoon Song Department of Laboratory Medicine, Seoul National University Hospital, 101 Daehak-ro, Jongno-gu, Seoul 110-744, Korea
Tel: +82-2-2072-3326 Fax: +82-2-747-0359 E-mail: cloak21@snu.ac.kr
© The Korean Society for Laboratory Medicine This is an Open Access article distributed under the terms of the Creative Commons Attribution Non-Commercial License (http://creativecom- mons.org/licenses/by-nc/3.0) which permits unrestricted non-commercial use, distribution, and reproduction in any medium, provided the original work is properly cited.
INTRODUCTION
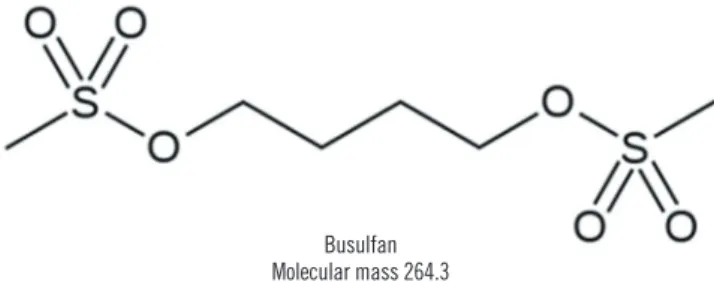
Busulfan (butane-1,4-diyl dimethanesulfonate, Fig. 1) is an al- kylating agent, which is commonly used as a component of my- eloablative regimens prior to hematopoietic stem cell transplan- tation (HSCT) [1]. It may be used in association with cyclophos-
phamide or fludarabine, as an alternative to regimens that in- volve total body irradiation [2]. Oral administration exhibits wide inter- and intra-individual variability in plasma levels due to vom- iting and highly variable bioavailability [3]. In contrast, when ad- ministered as intravenous (IV) formulation, pharmacokinetic (PK) features are more predictable through the removal of effect of
oral bioavailability and precise administration. For this reason, IV busulfan is gradually replacing oral busulfan but significant inter- individual variability is still observed, especially in children [4, 5].
Therapeutic drug monitoring (TDM) based on area under the curve (AUC) or steady state concentration has been widely in- vestigated [6, 7]. The major purpose of TDM is to prevent drug- related toxicity (for example, hepatic veno-occlusive disease, in- terstitial pneumonia) while maintaining high-dose busulfan to achieve effective myeloablation prior to HSCT. Inappropriately low drug levels may lead to relapse and even graft rejection, while high plasma busulfan levels are related to high incidence of complications [8, 9]. Currently, most institutes use AUC ac- quired from serial monitoring of post-administration concentra- tions to assess PK features in pediatric patients undergoing HSCT. For proper and rapid calculation of AUC, timely and ac- curate determination of plasma busulfan concentration is crucial.
A number of chromatographic techniques coupled with a few detection methods have been described for analyzing busulfan in plasma and in other biological fluids. Gas chromatography (GC) coupled with electron capture detector [10] or mass spec- trometry (MS) [11], liquid chromatography (LC) coupled with UV detectors [12] or fluorescence detectors [13] have been in- troduced, and an ELISA-based automated method was devel- oped recently [14]. Among the existing methods, LC coupled with MS [15, 16] or with tandem MS (MS/MS) [17, 18] offers a high level of sensitivity and requires a small sample volume, which is beneficial in a pediatric setting. Moreover, other major advantages include the possibility to eliminate complex de- rivatization procedures and the requirement of only a 10-min run. Recently, modified MS/MS methods employing turbulent flow extraction technology [19], or using dried blood spots as samples [20] were introduced.
We describe a simple, rapid, and sensitive LC-MS/MS assay for accurately quantifying busulfan in human plasma. This method was validated for the parameters of precision, recovery, matrix ef- fect, linearity, detection capability, carryover effect, and stability.
In addition, the method was applied to a clinical setting for mea- suring plasma busulfan concentration in pediatric patients.
METHODS
1. Chemicals and reagents
Glipizide purchased from Sigma Chemical Co. (St. Louis, MO, USA) was used as an internal standard (IS). Two milligrams of glipizide were dissolved into 10 mL of acetonitrile (ACN, Avantor Performance Materials, Center Valley, PA, USA) to make 0.2 mg/mL of IS stock solution. Working IS solution containing 100 ng/mL of glipizide was made by diluting the stock solution with 80% ACN. Busulfan (Sigma Chemical Co.) was dissolved into ACN to make 0.5 mg/mL of stock solution. Samples used for calibration and quality control were prepared by diluting the stock solution with Lyphochek drug-free plasma (Bio-Rad Labo- ratories, Irvine, CA, USA).
2. Sample preparation
Whole blood was collected in EDTA tubes and was centrifuged at 1,900×g for 10 min. Fifty microliters of the supernatant plasma was mixed with 450 µL of working IS solution, vortexed, and centrifuged at 3,750×g for 10 min at 10°C. One hundred micro- liters of the supernatant was transferred into injection vials for chromatographic analysis.
3. LC-MS/MS analysis
Agilent 1260 Infinity (Agilent Technologies, Santa Clara, CA, USA) LC system equipped with an XBridge™ C18 column (Wa- ters Co., Milford, MA, USA, 2.1×100 mm, 3.5 µm) was used and eluted using a gradient. The mobile phases were comprised of 0.1% formic acid with 2 mM ammonium acetate in distilled water (solvent A) or methanol (solvent B). Following sample in- jection (50 µL), elution was performed by generating a gradient from 10 to 50% solvent B in the starting/initial 2 min and 30 sec, followed by a run with 50% solvent B for 4 min, then rap- idly returned to the initial conditions and stabilized for 3 min.
The total run time was 10 min per run and the flow rate was maintained at 0.35 mL/min at 40°C. The retention time was 2.27 min for busulfan and 4.89 min for IS (Fig. 2 ).
The LC system was coupled with triple quadrupole MS/MS, Agilent 6490 (Agilent Technologies). The MS/MS was equipped with an electrospray ionization (ESI) source, operated in the positive ion mode, and the quantification was performed in the multiple reaction monitoring (MRM) mode with mass-to-charge (m/z) transitions at 264.1 >151.1 for busulfan and 446.1 >
Busulfan Molecular mass 264.3
Fig. 1. Chemical structure of busulfan (butane-1,4-diyl dimethane- sulfonate).
321.1 for IS (Fig. 2). Nitrogen gas was used for nebulization, desolvation, and collision. The instrument conditions were set as follows: collision energy 4 V for busulfan and 8 V for IS, capil- lary voltage 4.0 kV, dwell time 200 ms, sheath gas flow 12 L/min at 300°C, desolvation gas flow 14 L/min at 250°C, and 50 psi nebulization gas pressure. The injection volume was 2 μL and the data was acquired and analyzed using MassHunter Work- station software (Agilent technologies). The ratios of the peak areas of busulfan to that of IS were used for all calculations.
4. Preparation of calibrators and quality control (QC) samples
The samples used for calibration and QC were prepared by mix- ing busulfan stock solutions with drug-free plasma as recom- mended in the Food and Drug Administration (FDA) guidance for industry [21]. Six different concentrations of calibration solu- tions were prepared for obtaining a 6-point standard curve (25, 50, 200, 500, 2,000, 5,000 ng/mL) and 3 concentrations of samples were prepared for QC (200, 1,000, 4,000 ng/mL). The concentrations of the calibration solutions and QC samples were
selected to cover the targeted busulfan plasma levels measured during routine monitoring. A calibration curve was generated using y=ax+b applying the quadratic regression weighed by 1/x where x is the spiked concentration of busulfan and y is the ra- tio of the peak area of busulfan against that of IS.
5. Validation procedure
Within-run and within-laboratory precision were evaluated ac- cording to the procedures described in the CLSI guideline EP15-A2 [22]. The precision study was performed by assaying 3 levels of QC samples for 5 consecutive days in quadruplicates per day, overall 20 replicates per a concentration. In this proce- dure, recovery of analytes also could be calculated, because QCs were made by spiking of certain amount of purified busul- fan into drug-free plasma.
For evaluation of the matrix effect, plasma samples without busulfan were prepared in the same way as patient samples were. An equal amounts of busulfan and IS were spiked into the prepared plasma samples and the stock solutions. The busulfan concentrations were analyzed and the matrix effect was calcu- Fig. 2. Mass spectra and chromatograms of busulfan and internal standard obtained from the analysis of the lowest calibration solution (25 ng/mL). The MRM chromatograms (left panels) show well-separated busulfan and glipizide as indicated by different retention times. The right panels show the MRM transitions of busulfan and glipizide.
Abbreviations: IS, internal standard; MRM, multiple reaction monitoring; ESI, electrospray ionization.
5 4 3 2 1 0
40 60 80 100 120 140 160 180 200 220 240 260 280 300 54.9000
312.87
151.0000 555.85
204.9000
101.61 246.9000 106.19 222.9000
339.56
264.1000 637.03
Counts (%) vs. Mass-to-Charge (m/z)
+ESI Product lon:3 (0.542-0.834 min, 18 Scans) Frag=380.OV CID@10.0 (264.0000→**) bus-pro...
6 5 4 3 2 1 0
50 75 100 125 150 175 200 225 250 275 300 325 350 375 400 425 450 475 500 100.2000
912.36
×101
167.1000 163.83
321.0000 3914.27
446.3000 470.00 347.2000
1656.92
Counts (%) vs. Mass-to-Charge (m/z)
+ESI Product lon:4 (0.731-0.997 min, 10 Scans) Frag=380.OV CID@10.0 (446.1000→**) ISpro.d
Counts
4.7 4.6 4.5 4.4 4.3 4.2 4.1 4
1.5 2 2.5 3 +MRM (264.1→151.1) std1.d
RT=2.264 min Name=Busulfan
Area=38 Height=8
×101
Acquisition time (min)
Counts
1.4 1.2 1.0 0.8 0.6 0.4 0.2 0
4 4.5 5 5.5 Acquisition time (min) +MRM (446.1→321.1) std1.d Glipizide (IS)
Busulfan Fragmentor voltage
380 Collision energy
10 Ionization mode ESI
RT=4.889 min Name=glipizaide
Area=5,068 Height=1,095
×103
lated as the ratio of the concentrations in the stock solutions and the prepared plasma samples [23].
Linearity was evaluated according to the procedures de- scribed in CLSI guideline EP6-A [24]. Samples with 5 levels of busulfan (range, 0-5,000 ng/mL) were prepared by mixing drug-free plasma and busulfan-spiked plasma at varying ratios, assayed in quadruplicates, and the mean value was used to as- sess the linearity of the method.
The limit of detection (LOD) was determined as the lowest concentration with signal to noise ratio higher than 3 [25]. The limit of quantification (LOQ) was set as the lowest concentration of the calibration solution at CV less than 20% and recovery within 80-120% [21]. Two different QC samples (200 and 4,000 ng/mL) were used to investigate the carryover effect, and the or- der of analysis was as follows: high-high-high-high-low-low-low- low. Each result was designated separately as H1, H2, H3, H4, L1, L2, L3, L4, and the carryover was calculated by the equation:
bed [26].
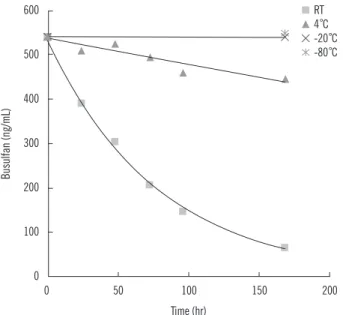
The short-term stability of busulfan in plasma was evaluated at various storage conditions. EDTA samples were spiked with 540 ng/mL busulfan and stored at room temperature and at 4°C for 1 week and at -20°C and -80°C for 2 weeks. Plasma sam- ples stored at room temperature and at 4°C were analyzed on days 1, 2, 3, 4, and 7, and samples frozen at -20°C and -80°C were analyzed after 1 week and 2 weeks of storage, respectively.
The validation data was analyzed using Microsoft Excel 2010 (Redmond, WA, USA).
6. Clinical samples
Peripheral blood was collected in EDTA tubes from 9 children.
IV busulfan was administered to the patients once daily for 4 consecutive days before HSCT [5]. On each day, samples were collected just after the administration and subsequently after 1,
2, and 4 hr. The dosage of busulfan on the 1st day of the schedule was 120 mg/m2 for children over 1 yr of age and 80 mg/m2 for infants below 1 yr of age. From day 2, the busulfan dosage was adjusted based on the previous day’s TDM results.
The distribution of the busulfan concentrations was plotted ac- cording to the box-whisker plot using MedCalc version 12.4 (Ostend, Belgium).
RESULTS
The mass spectra and chromatograms of busulfan and IS ac- quired from the analysis of the calibration solution containing the lowest busulfan concentration (25 ng/mL) are shown in Fig.
2. The spectra showed no interfering peaks around the reten- tion time of busulfan and IS from the calibration solutions, QC samples, and clinical samples.
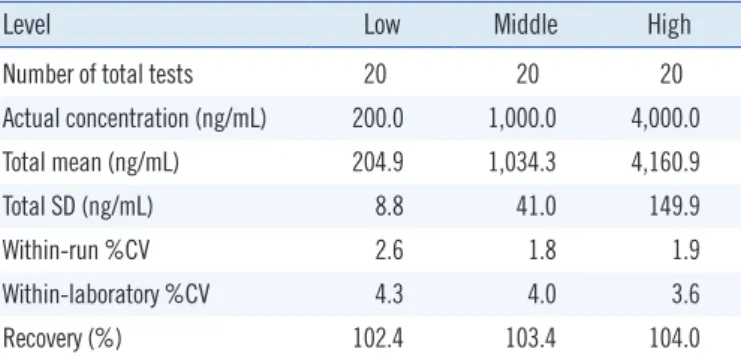
1. Precision, recovery, and matrix effect
The precision and recovery of the method were all within the acceptable range on using QC samples prepared by mixing a large amount of drug-free plasma with busulfan solution of known concentration (Table 1). The within-run and within-labo- ratory CVs were all below 5%, which were acceptable for clinical use. Recovery of busulfan was evaluated by comparison of the measured value with the expected value in busulfan-spiked plasma. The % recovery was between 100% and 105%, which was acceptable for clinical uses. The matrix effect was 100.3-
Measured concentration (ng/mL)
6,000
5,000
4,000
3,000
2,000
1,000
0
0 1,000 2,000 3,000 4,000 5,000 6,000 Actual concentration (ng/mL)
R2=0.9989
Fig. 3. Linearity of plasma busulfan analysis. At each concentration, 4 repeated test results are plotted and the mean values for each concentration are used for drawing a trend line. The R2 value of the trend line is presented.
Table 1. Results of within-run and within-laboratory precisions and recovery validation
Level Low Middle High
Number of total tests 20 20 20
Actual concentration (ng/mL) 200.0 1,000.0 4,000.0
Total mean (ng/mL) 204.9 1,034.3 4,160.9
Total SD (ng/mL) 8.8 41.0 149.9
Within-run %CV 2.6 1.8 1.9
Within-laboratory %CV 4.3 4.0 3.6
Recovery (%) 102.4 103.4 104.0
carryover %= ×100 as previously descri- L1-(L3+L4)/2 (H2+H3)/2-(L3+L4)/2
107.5% in the range of 220-2,887 ng/mL.
2. Linearity, detection capability, and carryover
In Fig. 3, the plot displayed linearity from 0 to 5,000 ng/mL, which covered the range of busulfan concentrations from most of clinical samples. Busulfan was not detected in any of the 20 samples from patients that had not been administered busulfan, confirming specificity of the assay for detection of busulfan in plasma. The LOD was 1.56 ng/mL, at which, the signal to noise ratio was 4.0 (Fig. 4 ). The LOQ was set as 25 ng/mL, the lowest concentration of the calibration solution that displayed a CV of 7.4% and a recovery of 95.2%. The carryover was under 1%, which was within allowable limits for clinical tests.
3. Stability of busulfan in plasma
The busulfan concentration decreased significantly especially
on being stored at room temperature, and 24 hr after storage, the concentration decreased by 25%, in comparison to less than 5% at 4°C. On storing for 2 weeks at -20°C and -80°C, the change in busulfan concentration was negligible (Fig. 5).
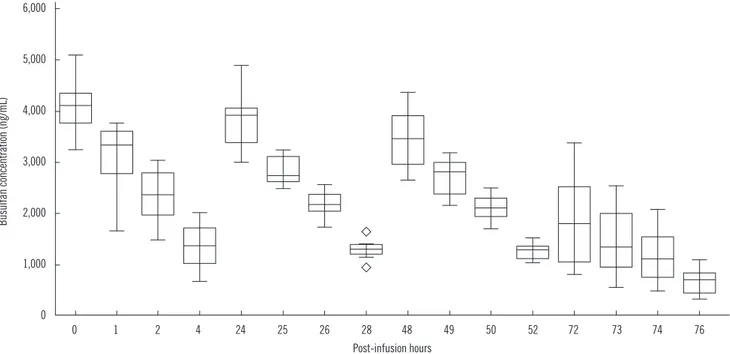
4. Clinical samples
The analysis results ranged 347-5,076 ng/mL, and the concen- trations were primarily dependent on the elapsed time post ad- ministration as expected. The median (interquartile range) bu- sulfan concentration in plasma at 0, 1, 2, and 4 hr after the 1st administrations were 3,999 (3,770-4,152), 3,281 (2,673- 3,579), 2,340 (1,979-2,708), and 1,249 ng/mL (893-1,558 ng/
mL), respectively (Fig. 6).
DISCUSSION
We describe a simple and rapid method for the quantification of plasma busulfan using LC-MS/MS. LC-MS/MS is the most pre- ferred method for measuring busulfan in a pediatric setting be- cause of its benefits over other methods. GC-based methods and LC-fluorescence/UV techniques are time-consuming and laborious, requiring derivatization steps for preparation and a large quantity of plasma of up to 1 mL, along with a long analy- sis time of up to 30 min per run [10-13]. The recently devel- oped ELISA-based automated method shows similar precision, required time, and sample volume compared with previously described methods, while having the risk of cross-reactivity and lot-to-lot variability of reagents [14]. In contrast, the LC-MS/MS provides the highest sensitivity and specificity, minimizes the preparation steps, and requires the smallest sample volume along with remarkably short analysis time [17, 18, 27].
In our method, plasma samples were pretreated with very simple liquid-to-liquid extraction procedure before analysis re- quiring only about 10 min, followed by the chromatographic analysis that required 10 min for 1 run. Short run time enables 1
0.5
0
0.5 1 1.5 2 2.5 3 3.5 4 4.5 5 5.5 6 6.5 7 7.5 8 8.5
×102
2.354 18
Counts (%) vs. Acquisition time (min) +ESI MRM Frag=380.OV CDI@4.0 (264.1000→151.1000) 1-r003.d
Noise (PeakToPeak)=1.06: SNR (2.354 min)=4.0
Fig. 4. Chromatogram at the limit of detection, 1.56 ng/mL. The signal to noise ratio (SNR) at the concentration is calculated as 4.0.
Fig. 5. Stability of plasma busulfan on storing at room temperature, 4°C, -20°C, and -80°C.
Abbreviation: RT, room temperature.
Busulfan (ng/mL)
600
500
400
300
200
100
0
0 50 100 150 200 Time (hr)
RT 4°C -20°C -80°C
rapid reporting of busulfan concentrations to the clinicians, which helps them decide whether to adjust next day’s dosage.
Moreover, this assay requires only 50 µL of plasma, which can be advantageous for infants and children. Such characteristics could be attractive for institutes, which are considering or plan- ning to implement TDM of busulfan for pediatricians.
In comparison with other known LC-MS/MS methods [17, 18, 27], a run time of 10 min required for chromatographic analysis is somewhat longer than the 3-4 min run time in previously de- scribed methods. However, considering the time needed for sample preparation, the total elapsed time is nearly as much as or slightly shorter than previous methods, as the present method does not require complex extraction procedures or evaporation processes. Besides, this difference may be attrib- uted to the temporal gradient of the mobile phase and time re- quired for stabilization of the chromatographic column. The amount of sample required for this method (50 µL) was slightly less than the previously known methods (50 to 200 µL). Fur- ther, all known LC-MS/MS methods employed ESI and MRM in positive ion mode, and there are subtle differences in the use of IS, conditions for chromatographic and mass spectrometric analysis.
Studies on precision, recovery, matrix effect, and linearity showed acceptable results. Compared with earlier studies, our method showed similar performances in precision, recovery,
Busulfan concentration (ng/mL)
6,000
5,000
4,000
3,000
2,000
1,000
0
0 1 2 4 24 25 26 28 48 49 50 52 72 73 74 76 Post-infusion hours
Fig. 6. Distribution and change of plasma busulfan concentrations in clinical samples. The central box represents the values from the lower to upper quartile (25-75 percentiles). The middle line represents the median value. A line extends from the minimum to the maximum value, excluding “outside” and “far out” values displayed as separate points (marked as ).
and matrix effect. However, this study was validated to be linear over the entire range of 2,000-5,000 ng/mL, which had not been fully validated in previous studies. This could be due to the difference in the interval and dosage of busulfan in each fa- cility. In our hospital, samples with higher busulfan concentra- tions than 2,000 ng/mL were frequently observed. Thus, the lin- earity of the test had to be validated including these ranges. On the other hand, relatively low concentrations ( <500 ng/mL) were not frequently observed in our clinical evaluation process, which makes verification of precision in lower range less impor- tant than in the previous studies, so precision tests with low QC (200 ng/mL) are enough for medical uses.
Implementation to the clinical setting was largely successful, but was accompanied with a problem in assaying samples col- lected during weekends. Busulfan was found to be unstable in human plasma, especially at room temperature, which is similar to previous report [15], and it was assumed that busulfan may react with nucleophilic groups such as amines in plasma during storage. Fortunately, the reduction in concentration of busulfan occurs at lesser extent on storing the samples in a refrigerator.
Therefore, in laboratories planning to establish analysis of plasma busulfan, it is essential not to store samples at room temperature before analysis.
There are some limitations in our method. We have not com- pared the results with those of other methods or institutes, be-
cause there are not adequate laboratories or accounts on the measurement of busulfan in plasma in clinical laboratories in Korea. To our knowledge, widely used external proficiency test- ing programs do not provide the programs for inter-laboratory comparison. Recently, some reports on determination of metab- olism of busulfan by analyzing urine or plasma [28-31] have appeared, and we have also searched for candidate metabolites that could be used to assess individual variability in metabolism.
Since the relationship with busulfan-related toxicity and concen- tration of specific metabolites is not yet clarified, studies for me- tabolites can be candidates for further evaluation.
In summary, we have developed an accurate and reproduc- ible method for quantification of busulfan in human plasma us- ing LC-MS/MS. The method requires relatively short analysis time and simple preparation procedures. Thus, this can be a useful protocol for laboratories especially in pediatric settings and considered for introduction of TDM of busulfan to achieve safe and proper dosing.
Authors’ Disclosures of Potential Conflicts of Interest
No potential conflicts of interest relevant to this article were re- ported.
Acknowledgements
This study was supported by grants of the Korea Healthcare Technology R&D Project, Ministry of Health, and Welfare, Re- public of Korea (A070001).
REFERENCES
1. Nath CE and Shaw PJ. Busulphan in blood and marrow transplantation:
dose, route, frequency and role of therapeutic drug monitoring. Curr Clin Pharmacol 2007;2:75-91.
2. Ciurea SO and Andersson BS. Busulfan in hematopoietic stem cell transplantation. Biol Blood Marrow Transplant 2009;15:523-36.
3. Russell JA and Kangarloo SB. Therapeutic drug monitoring of busulfan in transplantation. Curr Pharm Des 2008;14:1936-49.
4. Dean RM, Pohlman B, Sweetenham JW, Sobecks RM, Kalaycio ME, Smith SD, et al. Superior survival after replacing oral with intravenous busulfan in autologous stem cell transplantation for non-Hodgkin lym- phoma with busulfan, cyclophosphamide and etoposide. Br J Haematol 2010;148:226-34.
5. Lee JW, Kang HJ, Lee SH, Yu KS, Kim NH, Yuk YJ, et al. Highly variable pharmacokinetics of once-daily intravenous busulfan when combined with fludarabine in pediatric patients: phase I clinical study for determi- nation of optimal once-daily busulfan dose using pharmacokinetic mod- eling. Biol Blood Marrow Transplant 2012;18:944-50.
6. Gaziev J, Nguyen L, Puozzo C, Mozzi AF, Casella M, Perrone Donnorso M, et al. Novel pharmacokinetic behavior of intravenous busulfan in children with thalassemia undergoing hematopoietic stem cell trans- plantation: a prospective evaluation of pharmacokinetic and pharmaco- dynamic profile with therapeutic drug monitoring. Blood 2010;115:
4597-604.
7. Paci A, Vassal G, Moshous D, Dalle JH, Bleyzac N, Neven B, et al.
Pharmacokinetic behavior and appraisal of intravenous busulfan dosing in infants and older children: the results of a population pharmacoki- netic study from a large pediatric cohort undergoing hematopoietic stem-cell transplantation. Ther Drug Monit 2012;34:198-208.
8. Méresse V, Hartmann O, Vassal G, Benhamou E, Valteau-Couanet D, Brugieres L, et al. Risk factors for hepatic veno-occlusive disease after high-dose busulfan-containing regimens followed by autologous bone marrow transplantation: a study in 136 children. Bone Marrow Trans- plant 1992;10:135-41.
9. Carreras E, Rosiñol L, Terol MJ, Alegre A, de Arriba F, García-Laraña J, et al. Veno-occlusive disease of the liver after high-dose cytoreductive therapy with busulfan and melphalan for autologous blood stem cell transplantation in multiple myeloma patients. Biol Blood Marrow Trans- plant 2007;13:1448-54.
10. Chen TL, Grochow LB, Hurowitz LA, Brundrett RB. Determination of busulfan in human plasma by gas chromatography with electron-cap- ture detection. J Chromatogr 1988;425:303-9.
11. Quernin MH, Poonkuzhali B, Montes C, Krishnamoorthy R, Dennison D, Srivastava A, et al. Quantification of busulfan in plasma by gas chroma- tography-mass spectrometry following derivatization with tetrafluorothio- phenol. J Chromatogr B Biomed Sci Appl 1998;709:47-56.
12. Bleyzac N, Barou P, Aulagner G. Rapid and sensitive high-performance liquid chromatographic method for busulfan assay in plasma. J Chro- matogr B Biomed Sci Appl 2000;742:427-32.
13. Peris JE, Latorre JA, Castel V, Verdeguer A, Esteve S, Torres-Molina F.
Determination of busulfan in human plasma using high-performance liquid chromatography with pre-column derivatization and fluorescence detection. J Chromatogr B Biomed Sci Appl 1999;730:33-40.
14. Courtney JB, Harney R, Li Y, Lundell G, McMillin GA, Agarwal G, et al.
Determination of busulfan in human plasma using an ELISA format.
Ther Drug Monit 2009;31:489-94.
15. Mürdter TE, Coller J, Claviez A, Schönberger F, Hofmann U, Dreger P, et al. Sensitive and rapid quantification of busulfan in small plasma vol- umes by liquid chromatography-electrospray mass spectrometry. Clin Chem 2001;47:1437-42.
16. Quernin MH, Duval M, Litalien C, Vilmer E, Aigrain EJ. Quantification of busulfan in plasma by liquid chromatography-ion spray mass spec- trometry. Application to pharmacokinetic studies in children. J Chro- matogr B Biomed Sci Appl 2001;763:61-9.
17. Kellogg MD, Law T, Sakamoto M, Rifai N. Tandem mass spectrometry method for the quantification of serum busulfan. Ther Drug Monit 2005;27:625-9.
18. dos Reis EO, Vianna-Jorge R, Suarez-Kurtz G, Lima EL, Azevedo Dde A.
Development of a rapid and specific assay for detection of busulfan in human plasma by high-performance liquid chromatography/electrospray ionization tandem mass spectrometry. Rapid Commun Mass Spectrom 2005;19:1666-74.
19. Bunch DR, Heideloff C, Ritchie JC, Wang S. A fast and simple assay for busulfan in serum or plasma by liquid chromatography-tandem mass spectrometry using turbulent flow online extraction technology. J Chro- matogr B Analyt Technol Biomed Life Sci 2010;878:3255-8.
20. Ansari M, Uppugunduri CR, Déglon J, Théorêt Y, Versace F, Gumy‐
Pause F, et al. A simplified method for busulfan monitoring using dried
blood spot in combination with liquid chromatography/tandem mass spectrometry. Rapid Commun Mass Spectrom 2012;26:1437-46.
21. Food and Drug Administration. Guidance for Industry: Bioanalytical method validation. Rockville, MD: U.S. Department of Health and Hu- man Services, Food and Drug Administration, Center for Drug Evalua- tion and Research, 2001.
22. Clinical and Laboraotry Standards Institute. User verification of perfor- mance for precision and trueness; Approved guideline. 2nd ed. EP15- A2. Wayne, PA: Clinical and Laboraotry Standards Institute, 2005.
23. Matuszewski BK, Constanzer ML, Chavez-Eng CM. Strategies for the assessment of matrix effect in quantitative bioanalytical methods based on HPLC-MS/MS. Anal Chem 2003;75:3019-30.
24. NCCLS. Evaluation of the linearity of quantitative measurement proce- dures: a statistical approach; approved guideline. NCCLS document EP6-A. Wayne, PA: National Committee for Clinical Laboratory Stan- dards, 2003.
25. International Conference on Harmonization. Q2B: validation of analytical procedures: methodology. US FDA Federal Register 1997;62:27463-7.
26. Lee HJ, Kim SY, Lee SM, Heo J, Kim HH, Chang CL, et al. Elecsys hep- atitis B surface antigen quantitative assay: performance evaluation and
correlation with hepatitis B virus DNA during 96 weeks of follow-up in chronic hepatitis B patients. Ann Lab Med 2012;32:420-5.
27. Snyder ML and Ritchie JC. Quantification of busulfan in plasma using liquid chromatography electrospray tandem mass spectrometry (HPLC- ESI-MS/MS). Methods Mol Biol 2010;603:129-36.
28. Oechtering D, Boos J, Hempel G. Monitoring of N,N-dimethylacetamide in children during i.v.-busulfan therapy by liquid chromatography-mass spectrometry. J Chromatogr B Analyt Technol Biomed Life Sci 2006;
838:129-34.
29. Hempel G, Oechtering D, Lanvers-Kaminsky C, Klingebiel T, Vormoor J, Gruhn B, et al. Cytotoxicity of dimethylacetamide and pharmacokinetics in children receiving intravenous busulfan. J Clin Oncol 2007;25:1772-8.
30. Cooper AJ, Younis IR, Niatsetskaya ZV, Krasnikov BF, Pinto JT, Petros WP, et al. Metabolism of the cysteine S-conjugate of busulfan involves a beta-lyase reaction. Drug Metab Dispos 2008;36:1546-52.
31. Versace F, Uppugunduri CR, Krajinovic M, Théorêt Y, Gumy-Pause F, Mangin P, et al. A novel method for quantification of sulfolane (a metab- olite of busulfan) in plasma by gas chromatography-tandem mass spec- trometry. Anal Bioanal Chem 2012;404:1831-8.