INTRODUCTION
Asthma is a multifactorial disease characterized by chronic inflammation in the lungs. The signature of the disease is mas- sive infiltration of the bronchial mucosa by several cell types including lymphocytes, eosinophils, and mast cells, which is accompanied by a pronounced elevation in serum IgE. Desqua- mation of the lung epithelium occurs, along with goblet cell hyperplasia, thickening of the mucosal layer, and mucus pro- duction within the bronchioles, with the overall result being impeded airflow and airway hyperreactivity (AHR) (1).
Asthma is also defined as a complex genetic disorder with a heterogeneous phenotype attributed to the interactions among many genes and the environment (2). To comprehend the pathogenetic mechanisms underlying the many variants of asthma, it is essential to identify factors that initiate, intensify, and modulate the inflammatory response of the airway and
to determine how these immunological and biological pro- cesses produce the characteristic airway abnormalities (3).
The complex nature of the asthma phenotype, together with genetic heterogeneity and environmental influences, has made it difficult to uncover the aspects that underlie this common disease (4). Recently, a number of factors have been reported that might predispose or protect against asthma, but there is no single factor which can completely explain the develop- ment of asthma (5-10). Thus, large-scale, high-throughput, and whole-proteome studies are needed to understand the genetic contribution to asthma.
Two-dimensional polyacrylamide gel electrophoresis (2- DE), which separates polypeptides by their charge (pI) and relative molecular mass (Mr), has been shown to be a power- ful technique for analyzing complex mixtures of proteins (11).
The improvement of two-dimensional electrophoresis by the development of immobilized pH gradients (IPGs; 12), together
HoeSu Jeong, TaiYoun Rhim, Mi-Hyun Ahn, Pyoung-Oh Yoon, Sung-Ho Kim*, Il Yup Chung�, SooTaek Uh, Sung-Il Kim, Choon-Sik Park
Genome Research Center for Allergy and Respiratory Diseases, Soonchunhyang University Hospital;
Department of Chemistry*, Soonchunhyang University;
Department of Biochemistry and Molecular Biology�, Hanyang University, Seoul, Korea
HoeSu Jeong and TaiYoun Rhim equally contributed as the first authors.
Address for correspondence Sung Il Kim, Ph.D.
Genome Research Center for Allergy and Respiratory Diseases, Soonchunhyang University Bucheon Hospital, 1174 Jung dong, Wonmi gu, Bucheon 420-021, Korea
Tel : +82.32-621-5021, Fax : +82.32-621-5023 E-mail : [email protected]
*This work was supported by a grant from the Korea Health 21 R&D Project, Ministry of Heath & Welfare, Republic of Korea (01-PJ3-PG6-01GN04-0003 and 03-PJ10-PG6-GP01-0002).
579
Proteomic Analysis of Differently Expressed Proteins in a Mouse Model for Allergic Asthma
Allergic asthma is associated with persistent functional and structural changes in the airways and involves many different cell types. Many proteins involved in allergic asthma have been identified individually, but complete protein profiles (proteome) have not yet been reported. Here we have used a differential proteome mapping strategy to identify tissue proteins that are differentially expressed in mice with aller- gic asthma and in normal mice. Mouse lung tissue proteins were separated using two-dimensional gel electrophoresis over a pH range between 4 and 7, digested, and then analyzed by matrix-assisted laser desorption/ionization-time of flight mass spectrometry (MS). The proteins were identified using automated MS data acqui- sition. The resulting data were searched against a protein database using an inter- nal Mascot search routine. This approach identified 15 proteins that were differen- tially expressed in the lungs of mice with allergic asthma and normal mice. All 15 proteins were identified by MS, and 9 could be linked to asthma-related symptoms, oxidation, or tissue remodeling. Our data suggest that these proteins may prove useful as surrogate biomarkers for quantitatively monitoring disease state progres- sion or response to therapy.
Key Words : Electrophoresis, Gel; Two-Dimensional; Disease Models, Animal; Asthma; Proteomics; MALDI- TOF/MS; Chi313 protein, mouse
Received : 10 November 2004 Accepted : 3 March 2005
with improved solubilization techniques (13, 14), now per- mits the reproducible separation of up to 2000 proteins on a single two-dimensional electrophoresis gel. Such gel-sepa- rated proteins can be identified rapidly by mass spectrome- try (MS), and, if genomic information is also available, such analyses permit the systematic identification of the protein complement of a genome, known as the proteome (15-18).
In this study, we have adopted a proteomics approach to bet- ter understand the protein basis of this pathology of asthma on the whole, and to development of marker for ovalbumin induces asthma.
MATERIALS AND METHODS Animals
Male BALB/c mice (5 weeks old) were obtained from Charles River Laboratories (MA, U.S.A.) and were held under specific pathogen-free conditions. The experiments, approved by our institutional Committee on Animal Experimentation, were performed in compliance with governmental and internation- al guidelines on animal experimentation.
Sensitization and provocation procedures
The experimental mice were sensitized to ovalbumin (OVA, Grade V; Sigma-Aldrich, St. Louis, MO, U.S.A.) on days 1 and 14 by administration of three intraperitoneal (i.p.) injec- tions of 10 g OVA emulsified in 200 L phosphate-buffered
saline (PBS) with 1.5 mg aluminum hydroxide (Sigma-Ald- rich). The mice were subsequently challenged with an OVA aerosol (1% in PBS) for 20 min on days 28, 29, and 30 (Fig.
1A). The aerosol was delivered to a 9-L Perspex exposure chamber by a nebulizer (model 646; DeVilbiss, Somerset, PA, U.S.A.) driven by an airflow of 40 L/min, which provided an aerosol with an output of 0.33 mL/min. The control ani- mals received i.p. injections of aluminum hydroxide in PBS and were subsequently challenged with PBS aerosol.
Measurement of airway hyperreactivity
Responsiveness to methacholine was assessed in conscious, unrestrained mice by barometric plethysmography, using an apparatus and software from All Medicus (Seoul, Korea).
The measurements were conducted using standard methods, similar to those described previously (19). Each mouse was placed in a plethysmograph chamber and exposed to an aerosol of PBS for baseline readings, followed by increasing concen- trations of aerosolized methacholine (2.5-20 mg/mL; Sigma- Aldrich) for 3 min each. AHR was assessed using the enhanced pause parameter (Penh), which was calculated automatically by the software based on the mean pressure generated in the plethysmograph chambers during inspiration and expiration, combined with the time of each respiratory phase. Penh read- ings were recorded for 5 min after each aerosol exposure and averaged. The results are presented as the mean percent change in Penh at each methacholine concentration compared with the baseline readings, calculated from the data from groups of six mice.
day 0
sensitization challenge sacrifice
Macrophage Lymphocyte Neutrophil Eosinophil
14 28 29 30 32
A
B C
Penh
5.0 4.0
3.0 2.0 1.0 0.0
Total cell number
5.0 4.0
3.0 2.0
1.0
control PBS 3.125 6.25 12.5 25 50 0.0 Normal Allergic asthma
Methacholine (mg/mL)
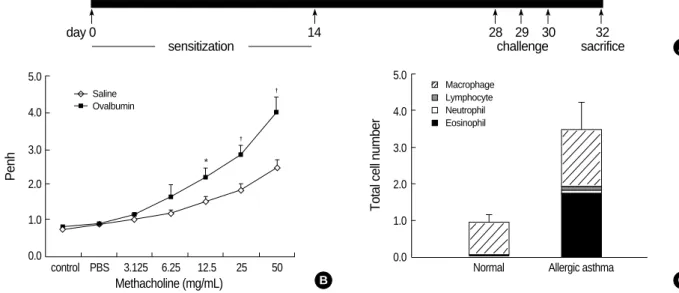
Fig. 1.Construction of the mouse model for allergic asthma. (A) Schematic representation of ovalbumin (OVA) sensitization and challenge protocol. (B) Airway responsiveness to methacholine in OVA-sensitized mice at 24 hr after the last challenge with saline (diamonds) or OVA (black rectangles). The results are expressed as the arithmetic means±SEM (n=6 per group). Significant differences from saline-challenged animals: *p<0.05; �p<0.01. (C) Numbers of mononuclear cells recovered in bronchial alveolar (BAL) fluid after saline or OVA challenge. Differ- ential cell counts were performed on a minimum of 500 cells per sample to identify eosinophils (black), neutrophils (open), macrophages (hatched), and lymphocytes (gray). Challenge with OVA significantly increased the total cell numbers. Eosinophils and macrophages recov- ered in BAL fluid were significantly increased, whereas the neutrophil and lymphocyte counts were unchanged in OVA-challenged mice.
�
�
*
Saline Ovalbumin
Sample preparation
All reagents used in 2-DE were obtained from Amersham Biosciences (Seoul, Korea). Fresh lung tissue was placed in a clean mortar containing liquid nitrogen and finely ground;
1 mL of sample buffer (7 M urea, 2 M thiourea, 4% CHAPS, 40 mM Tris-HCl, 20 mM DTT, 2% IPGphore buffer) was added and mixed thoroughly. The suspensions were sonicated for approximately 1 hr at 4℃and centrifuged at 15,000 g for 30 min at 4℃; the supernatants were stored at -80℃until use.
Two-dimensional gel electrophoresis
2-DE was performed in a horizontal apparatus (IPGphor and Hoefer 600 SE; Amersham Biosciences, Uppsala, Swe- den). For the analytical gels, 200 g of protein was applied onto immobilized pH gradient (IPG) strips (24 cm, pH 4- 7) containing Immobilines pH 4-7, thiourea, CHAPS, and urea, according to the method of Rabilloud et al. (13). After isoelectric focusing, the strips were applied to the top of SDS- PAGE gels (12.5%), and the proteins were separated accord- ing to their molecular mass. The SDS-PAGE gels were silver- stained to detect proteins (20). For the analysis of selected proteins after tryptic digestion, 2 mg of digested protein was applied to the IPG strip, and the final SDS-PAGE gel was stained using Coomassie Brilliant Blue G250 (Sigma-Aldrich).
Image analysis
Digitized images of the stained gels were analyzed using the 2-DE gel analysis program ImageMaster 2D ver. 4.0 (Amersham Pharmacia Biotech, Uppsala, Sweden). A com- parison report of the qualitative and quantitative differences between the samples for each data set of was generated.
In-gel digestion and mass spectrometric analysis
Differentially expressed protein spots were excised from the gels, cut into smaller pieces, and digested with trypsin (Promega, Madison, WI, U.S.A.), as previously described (21). For MALDI-TOF MS analysis, the tryptic peptides were concentrated on POROS R2 columns (Applied Biosystems, Foster City, CA, U.S.A.). After successive column washings with 40% methanol, 100% acetonitrile, and 50 mM ammo- nium bicarbonate, the samples were applied onto the R2 col- umn and eluted in 2 mL of a-cyano-4-hydroxycinnamic acid before MALDI-TOF analysis (22, 23). The spectra for the protein samples were obtained using a Voyager DE PROMA- LDI-TOF spectrometer (Applied Biosystems). The searches of protein databases were performed with the MSFit program (http://prospector.ucsf.edu/ucsfhtml3.4/msfit.htm) using monoisotopic peaks. A mass tolerance within 50 ppm was allowed for the first analysis; the system was subsequently recalibrated at 20 ppm using the lists of proteins obtained
from the initial analysis. The spectra were also internally cali- brated using trypsin autolysis products. The resulting peptide masses were used to search the databases managed by SWIS- SPROT (http://kr.expasy.org) and the National Center for Biotechnology Information (http://www.ncbi.nlm.nih.gov).
Semiquantitative RT-PCR
Single-stranded cDNA was synthesized from 3 g of total RNA using an oligodeoxythymidylic acid primer and Super- script II reverse transcriptase (Invitrogen, Carlsbad, CA, U.S.A.). Each cDNA was diluted for subsequent PCR ampli- fication. GAPDH (glyceraldehyde 3-phosphate dehydroge- nase) was amplified as a quantitative control. Each PCR was carried out in a 20- L volume of 1× PCR buffer with a pro- gram of 10 min at 94℃for initial denaturing, followed by 26 cycles of 94℃for 30 sec, 56℃for 30 sec, and 72℃for 30 sec, in a GeneAmp PCR system 9600 (Perkin-Elmer Applied Biosystems, Foster City, CA). The following primers were used: YM1-forward, 5′-taccagttgggctaagga-3′; YM1- reverse, 5′-atgctggaaatcccaca-3′; YM2-forward, 5′-gccattg- gaggatggaa-3′; and YM2-reverse, 5′-tggaatgtggttcaaagt.
Statistical analysis
The proteins from the asthmatic and control groups were analyzed for differences in levels of expression using Student’s t-test or the Mann-Whitney U-test. Values of p<0.05 were considered significant.
RESULTS
Construction of the asthmatic mouse model
The intraperitoneal sensitization and nebulized provoca- tion of mice with ovalbumin resulted in a dose-dependent increase in airway responsiveness to inhaled methacholine (Fig. 1B). The treated mice had significantly increased num- bers of total cells in bronchoalveolar lavage (BAL) fluid, as well as in the number and percentage of eosinophils in the BAL fluid (Fig. 1C). Also, the levels of ovalbumin-specific IgE were increased in the plasma of ovalbumin-challenged asthmatic mice (data not shown).
2-DE analysis of mouse lung tissues from control and OVA-challenged mice
To examine the differential expression of proteins in lung tissues from asthmatic mice and normal controls, proteomic analysis was performed using high-resolution 2-DE. Fig. 2 is a representative master gel image showing the separation of proteins from normal mouse lung tissue. More than 1,000 protein spots with pIs between 3 and 10 and with relative
molecular masses between 15 and 150 kDa were detected on the 2-DE gels. A computer-assisted comparative analysis of the respective silver-stained spot patterns of six paired sam- ples (six normal controls and six OVA-challenged, asthmatic mice) showed that one protein spot appearing in the 2-DE gels of control tissues (Fig. 2, arrows) were slightly increased
in the lung tissues of OVA-challenged mice. However, most of the variable spots were located in two limited areas of the gels (Fig. 2, boxed).
By conducting 2-DE using several types of IPG strips, we found that the 4-7 pH range covers a majority of the proteins of interest in mouse lung tissue, and thus was the best choice
Fig. 2.2-dimension electrophoresis (DE) of proteins from normal (Sham) and allergic asthma (OVA) mouse lung tissues. Proteins from the whole lung were extracted and separated on an IPG strip with a nonlinear gradient of pH 3-10, followed by separation in the second dimension on an 8-18% SDS polyacrylamide gel. The gel was stained with Coomassie Blue G-250. Spots 1 was determined to be transthyretin.
pH 3
A
B
1 1
A
B
10 pH 3 10 MW
(kDa) 150
75 50 37 25
15
Sham Ova
100
Fig. 3.2-DE of proteins from normal (Sham) and allergic asthma (OVA) mouse lung tissues. In the first dimension, proteins were loaded on a 24-cm IPG strip with a linear gradient of pH 4-7. A 12%
SDS polyacrylamide gel was used for second dimension separa- tion. Proteins were visualized by silver staining. Indicated spots represent proteins differentially expressed between normal and asthmatic lung tissues.
pH 4 7 pH 4 7 MW
(kDa)
50 37 25
15
Sham Ova
100
3 2
6
5
12 13 8
7
11 9
144 10
15
1,500
1,000
0.500
0.000
Sham Asthma
1 � 1,000
0.500
0.000
Sham Asthma
2 � 1,500
1,000
0.500
0.000
Sham Asthma
4 �
1,000
0.500
0.000
Sham Asthma
3 � 1,000
0.500
0.000
Sham Asthma
5 �
1,000
0.500
0.000
Sham Asthma
6 � 1,000
0.500
0.000
Sham Asthma
7 � 1,000
0.500
0.000
Sham Asthma
9 �
1,000
0.500
0.000
Sham Asthma
8 � 1,000
0.500
0.000
Sham Asthma
10 �
1,000
0.500
0.000
Sham Asthma
11 � 1,000
0.500
0.000
Sham Asthma
12 � 1,000
0.500
0.000
Sham Asthma
14 �
1,000
0.500
0.000
Sham Asthma
13 � 1,000
0.500
0.000
Sham Asthma
15 �
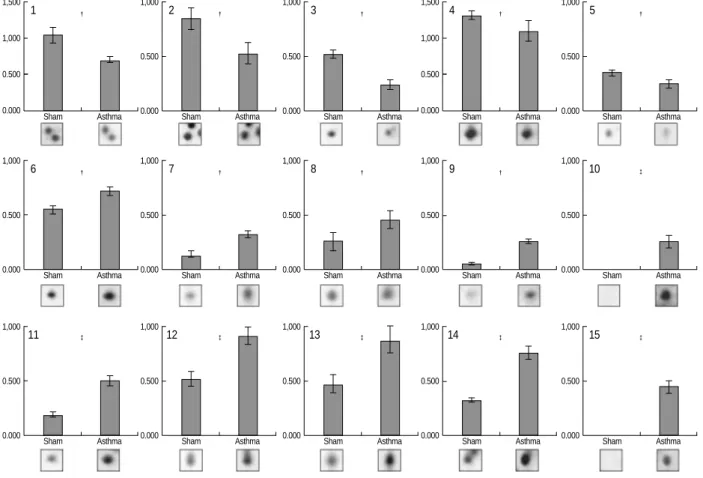
Fig. 4.Protein expression levels were determined by relative intensity using image analysis. Normalized spot intensities of the asthma ver- sus normal control (sham) group were compared. Mean intensity and spot intensities on individual gels are shown. *p<0.05, �p<0.01, �p<
0.001 by Student’s t-test.
for initial survey investigations (data not shown). In order to preselect proteins exhibiting variations in expression levels, the protein patterns from asthmatic and control lung tissues were divided into two classes, and the quantities of all detect- ed spots in both classes were compared by Student’s t-test using ImageMaster 2-DE gel analysis software. After com- paring the 2-DE protein patterns on duplicate gels of lung tissue from six asthmatic and six control mice, we found 14 protein spots that were significantly different in asthmatic and control tissues (Fig. 3). Among them, eight spots were meaningfully increased, and five spots were decreased in the lungs of OVA-challenged mice (Fig. 4). Two protein spots were exclusively expressed in asthmatic lung tissues (Fig. 3, spots 10 and 15).
Protein identification
The protein spots that revealed statistically significant dif- ferences between asthmatic mice and normal controls were excised from the gels, trypsinized, and analyzed by MALDI- TOF MS. Of these, we have been able to identify 16 proteins (Table 1). The number of matching peptides, the percentage of sequence coverage, and the accuracy of mass estimates were used to evaluate the database search results. Trypsin autolysis peaks were regularly used for internal calibration of the mass spectra to achieve a 50 ppm mass accuracy. Also, in most cases the apparent Mr and pI determined from the 2-DE protein pattern were in agreement with the theoretical values of the
identified proteins.
Differential expression of YM1 and YM2 genes
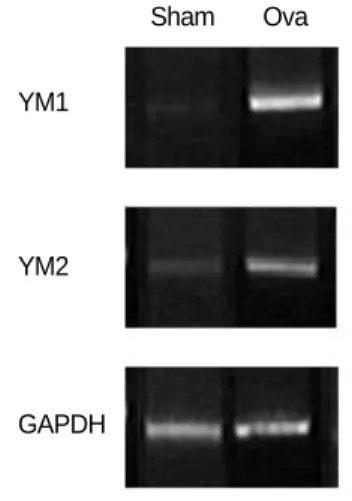
To determine whether the up-regulation of YM1 and YM2 expression occurred at the mRNA level, we performed semi- quantitative RT-PCR analysis (Fig. 5) using YM1- and YM2- specific primers. The results confirmed that the mRNAs of YM1 and YM2 were expressed at very low levels in normal mouse lung tissue (Fig. 5, SHAM), and were present at con- siderably higher levels in the lungs of asthmatic mice (Fig. 5, OVA). These results substantiate the specific up-regulation of YM1 and YM2 expression in the lungs of asthmatic mice compared with those of normal mice.
DISCUSSION
In this report, we present the comparative proteome anal- ysis of normal and asthmatic lung tissues from mice. The pH ranges used for the first-dimension gel electrophoresis in this study (3-10 and 4-7) separated a proportion of the soluble proteins in the lung tissues, allowing a focus on the high-res- olution, more unambiguous comparison of proteins with iso- electric points between pH 4 and 7.
To avoid individual and experimental variation, we pro- duced a large number of replicate gels from the same sample or treatment group in order to obtain statistically significant changes in protein levels between the different groups, i.e., asthma versus normal. Using 2-DE, we found 15 proteins that were differentially expressed in the lung tissues of mice with OVA-induced allergic asthma. Five protein spots were down-regulated and eight protein spots were up-regulated in asthmatic lungs compared with normal lung. These pro- tein spots were identified by in-gel digestion and MALDI- TOF MS.
The identified proteins could be classified into three differ- ent groups based on their cellular functions and participation in biochemical pathways. Four proteins (cytochrome b5, and
Spot No.
Protein Mr (kDa) /pI
Acce- ssion No.
Sequence Coverage
(%)*
Protein Name
Down-regulated proteins in allergic asthma
1�Transthyretin 13.6/5.8 P07309 51
2 Peroxiredoxin 2 21.9/5.2 Q61171 39
3 Myosin light chain 2 18.4/4.4 P51667 52 4 Thioether S-methyltransferase 30.1/6.0 P40936 26
5 Cytochrome b-5 15.2/4.9 P56395 48
Up-regulated proteins in allergic asthma
6 Rho, GDP dissociation inhibitor 22.8/4.9 Q61599 46 (GDI)
7 Myosin binding protein C, cardiac 21.2/5.5 O70468 37
8 Transthyretin 13.6/5.8 P07309 51
9 Peroxiredoxin 1 22.4/8.6 P35700 42
10 Chitinase 3-like 3 (YM1) 42.6/5.3 P70201 38
11 Ferritin L chain 20.7/5.6 P29391 41
12 -galactoside binding protein 15.1/5.3 P16045 47 13 Fatty acid binding protein 5, 15.5/6.1 Q05816 35
epidermal
14 Peroxiredoxin 6 24.9/5.7 O08709 36
15 Chitinase 3-like 4 (YM2) 45.3/5.8 Q91Z98 41 Table 1.Differentially expressed proteins in the lungs of mice with OVA-induced allergic asthma
*Sequencing coverage is defined as the percentage of the whole length of the protein sequence which is covered by matched peptides identi- fied by the MALDI-TOF MS analysis, �Spots shown in Fig. 2.
Fig. 5. RT-PCR analysis of the mRNA expression of differentially express- ed YM proteins. Primers specific for YM1 and YM2 were used as indi- cated to amplify the tran- scripts from total RNA isolated from normal and asthmatic lung tissues.
RT-PCR of the house- keeping gene GAPDH was used to control for RNA variation (bottom).
YM1
Sham Ova
YM2
GAPDH
peroxiredoxins 1, 2, and 6) are thought to be related to oxi- dation and reduction. As antioxidant enzymes in humans, peroxiredoxins appear to be involved in the redox regulation of cellular signaling and differentiation, displaying opposing effects (24). Our 2-DE data showed that peroxiredoxin 2 was down-regulated and peroxiredoxins 1 and 6 were up-regulat- ed in asthmatic mouse lungs compared with normal lungs.
This result suggests that oxidants play an important role in the development of asthma.
Hegesh et al. (25) reported that cytochrome b5 levels were very low in the red blood cells of a patient with congenital methemoglobinemia, but were normal in the healthy unrelat- ed parents and in the patient’s siblings. This finding confirmed the conclusion of Hultquist and Passon (26) that cytochrome b5 is required for methemoglobin reduction in vivo. The reduc- tase converts ferric cytochrome b5 to ferrous cytochrome b5;
the latter then converts methemoglobin (ferric hemoglobin) to normal hemoglobin (ferrous Hb). These reports together with our findings in the lungs of mice with experimental asthma suggest that the decreased levels of cytochrome b5 might be related to the increases in methemoglobin in the lung tissues of asthmatic patients.
Three other differentially expressed proteins (rho-GDP dis- sociation inhibitor-beta, myosin light chain 2, and myosin binding protein C) can be classified as structural proteins (27, 28). Airway remodeling is a term used to describe the dynamic processes that lead to structural changes in the air- ways of patients with asthma. These structural changes are thought to result in an irreversible component of the airway obstruction seen in asthma and perhaps also in the develop- ment of airway hyperresponsiveness. The dynamic processes underlying these structural changes are viewed as injury-repair processes driven by airway inflammation. Although the con- cept of airway remodeling and its role in chronic persistent airflow obstruction is widely accepted, it should be recognized that airway remodeling is still just a concept (27). Numerous histopathologic abnormalities have been described in asth- matic airways, and yet the functional consequences of these abnormalities and their role in the natural history of asthma remain unknown. In this context, we consider that cytoskele- ton-related proteins such as myosin light chain 2 and myosin binding protein C might be directly involved with airway remodeling. Rho-GDP dissociation inhibitor-beta was also differentially expressed during the process of angiogenesis, which may indicate a link between its up-regulation in asth- ma and the cellular proliferation and migration events that are required for angiogenesis and vascular remodeling (28).
YM1 and YM2 were the most interesting among the iden- tified proteins. According to our 2-DE, the protein spots for YM1 and YM2 were scarcely detectable in normal mice. In contrast, these two protein spots were dramatically up-reg- ulated in asthmatic mouse lung tissues. The semi-quantita- tive RT-PCR results (Fig. 5) established that the 2-DE find- ings reflected increased gene transcription of YM1 and YM2.
These findings were consistent with a previous report (29) demonstrating that both TH2 cytokines and allergic chal- lenge both induced YM1 expression in macrophages by a STAT6-dependent mechanism. YM proteins are thought to be bi-functional with roles in eosinophil chemotaxis and tis- sue remodeling (30). More recently, Zhu et al. (31) reported that acidic mammalian chitinase (AMCase), a human homo- logue of YM1 and YM2, was induced via an interleukin-13 mediated pathway in epithelial cells and macrophages in an aeroallergen model and was expressed in very large quantities in human asthma. In addition, the neutralization of AMCase ameliorated Th2 inflammation and airway hyperresponsive- ness (31).
In summary, we used 2-DE to identify proteins that are differentially expressed in normal and allergic asthmatic mouse lung tissues. Most of the identified proteins are related to oxi- dation-reduction and airway remodeling, which may provide an important connection to the thickening of airway walls observed in the allergic lung. Recently, many reports demon- strated associations between the expression of certain proteins and asthma. However, a comparative analysis of the total pro- tein profiles for allergic asthmatic and normal lung tissues has not been reported. Our data suggest that the identified proteins may provide tools for gauging the success of thera- peutic interventions designed to reduce the chronic inflam- mation underlying asthma.
REFERENCES
1. Jember AG, Zuberi R, Liu FT, Croft M. Development of allergic inflammation in a murine model of asthma is dependent on the cos- timulatory receptor OX40. J Exp Med 2001; 193: 387-92.
2. Hakonarson H, Halapi E. Genetic analyses in asthma: current concepts and future directions. Am J Pharmacogenomics 2002; 2: 155-66.
3. Busse WW, Lemanske RF Jr. Asthma. N Engl J Med 2001; 344:
350-62.
4. Hakonarson H, Bjornsdottir US, Halapi E, Palsson S, Adalsteinsdottir E, Gislason D, Finnbogason G, Gislason T, Kristjansson K, Arnason T, Birkisson I, Frigge ML, Kong A, Gulcher JR, Stefansson K. A major susceptibility gene for asthma maps to chromosome 14q24.
Am J Hum Genet 2002; 71: 483-91.
5. Coyle AJ, Le Gros G, Bertrand C, Tsuyuki S, Heusser CH, Kopf M, Anderson GP. Interleukin-4 is required for the induction of lung Th2 mucosal immunity. Am J Respir Cell Mol Biol 1995; 13: 54-9.
6. Foster PS, Hogan SP, Ramsay AJ, Matthaei KI, Young IG. Interleukin 5 deficiency abolishes eosinophilia, airways hyperreactivity, and lung damage in a mouse asthma model. J Exp Med 1996; 183: 195-201.
7. Grunig G, Warnock M, Wakil AE, Venkayya R, Brombacher F, Ren- nick DM, Sheppard D, Mohrs M, Donaldson DD, Locksley RM, Corry DB. Requirement for IL-13 independently of IL-4 in experimental asthma. Science 1998; 282: 2261-3.
8. Cohn L, Homer RJ, MacLeod H, Mohrs M, Brombacher F, Bottomly K. Th2-induced airway mucus production is dependent on IL-4Ral-
pha, but not on eosinophils. J Immunol 1999; 162: 6178-83.
9. Townsend MJ, Fallon PG, Matthews DJ, Smith P, Jolin HE, McKen- zie AN. IL-9-deficient mice establish fundamental roles for IL-9 in pulmonary mastocytosis and goblet cell hyperplasia but not T cell development. Immunity 2000; 13: 573-83.
10. Gavett SH, Chen X, Finkelman F, Wills-Karp M. Depletion of murine CD4+T lymphocytes prevents antigen-induced airway hyperreactivity and pulmonary eosinophilia. Am J Respir Cell Mol Biol 1994; 10:
587-93.
11. O'Farrell PH. High resolution two-dimensional electrophoresis of proteins. J Biol Chem 1975; 250: 4007-21.
12. Gorg A, Postel W, Gunther S. The current state of two-dimensional electrophoresis with immobilized pH gradients. Electrophoresis 1988;
9: 531-46.
13. Rabilloud T, Adessi C, Giraudel A, Lunardi J. Improvement of the solubilization of proteins in two-dimensional electrophoresis with immobilized pH gradients. Electrophoresis 1997; 18: 307-16.
14. Molloy MP, Herbert BR, Walsh BJ, Tyler MI, Traini M, Sanchez JC, Hochstrasser DF, Williams KL, Gooley AA. Extraction of mem- brane proteins by differential solubilization for separation using two- dimensional gel electrophoresis. Electrophoresis 1998; 19: 837-44.
15. Shevchenko A, Jensen ON, Podtelejnikov AV, Sagliocco F, Wilm M, Vorm O, Mortensen P, Shevchenko A, Boucherie H, Mann M. Link- ing genome and proteome by mass spectrometry: Large-scale iden- tification of yeast proteins from two-dimensional gels. Proc Natl Acad Sci USA 1996; 93: 14440-5.
16. Dainese P, Staudenmann W, Quadroni M, Korostensky C, Gonnet G, Kertesz M, James P. Probing protein function using a combina- tion of gene knockout and proteome analysis by mass spectrometry.
Electrophoresis 1997; 18: 432-42.
17. Roepstorff P. Mass spectrometry in protein studies: From genome to function. Curr Opin Biotechnol 1997; 8: 6-13.
18. Yates JR III. Mass spectrometry and the age of the proteome. J Mass Spectrom 1998; 33: 1-19.
19. Hamelmann E, Schwarze J, Takeda K, Oshiba A, Larsen GL, Irvin CG, Gelfand EW. Noninvasive measurement of airway responsive- ness in allergic mice using barometric plethysmography. Am J Respir
Crit Care Med 1997; 156: 766-75.
20. Erdjument-Bromage H, Lui M, Lacomis L, Grewal A, Annan RS, McNulty DE, Carr SA, Tempst P. Examination of micro-tip reversed- phase liquid chromatographic extraction of peptide pools for mass spectrometric analysis. J Chromatogr A 1998; 826: 167-81.
21. Shevchenko A, Wilm M, Vorm O, Mann M. Mass spectrometric sequencing of proteins silver-stained polyacrylamide gels. Anal Chem 1996; 68: 850-8.
22. Beavis RC, Chait BT. a-Cyano-4-hydroxycinnamic Acid as a Matrix for Matrix assisted Laser Desorption mass Spectrometry. Org Mass Spectrom 1992; 27: 156-8.
23. Vorm O, Roepstorff P, Mann M. Improved resolution and very high sensitivity in MALDI TOF of matrix surfaces made by fast evapora- tion. Anal Chem 1994; 66: 3281-7.
24. Hofmann B, Hecht HJ, Flohe L. Peroxiredoxins. Biol Chem 2002;
383: 347-64.
25. Hegesh E, Hegesh J, Kaftory A. Congenital methemoglobinemia with a deficiency of cytochrome b5. N Engl J Med 1986; 314: 757-61.
26. Hultquist DE, Passon PG. Catalysis of methaemoglobin reduction by erythrocyte cytochrome b5 and cytochrome b5 reductase. Nature New Biol 1971; 229: 252-4.
27. Fish JE, Peters SP. Airway remodeling and persistent airway obstruc- tion in asthma J. Allergy Clin Immunol 1999; 104 (3 Pt 1): 509-16.
28. Adra CN, Ko J, Leonard D, Wirth LJ, Cerione RA, Lim B. Identifi- cation of a novel protein with GDP dissociation inhibitor activity for the ras-like proteins CDC42Hs and rac I. Genes Chromosomes Cancer 1993; 8: 253-61.
29. Welch JS, Escoubet-Lozach L, Sykes DB, Liddiard K, Greaves DR, Glass CK. TH2 cytokines and allergic challenge induce Ym1 expres- sion in macrophages by a STAT6-dependent mechanism. J Biol Chem 2002; 277: 42821-9.
30. Webb DC, McKenzie AN, Foster PS. Expression of the Ym2 Lectin- binding Protein Is Dependent on Interleukin (IL)-4 and IL-13 Signal Transduction J Biol Chem 2001; 276: 41969-76.
31. Zhu Z, Zheng T, Homer RJ, Kim Y, Chen NY, Cohn L, Hamid Q, Elias JA. Acidic mammalian chitinase in asthmatic Th2 inflamma- tion and IL-13 pathway activation. Science 2004; 304: 1678-82.