<ABSTRACT>
This study describes the use of Generalizability Theory (GT) and Many-Facet Rasch Measurement (MFRM) to evaluate and improve the rating procedure in a mathematics creative problem solving test. Results indicate that these two methods agree about the relative degrees of variation among the facets but slightly differ on how to account for the sources of variation.
For both the GT and MFRM results, the variance component for the Person by Item interaction is relatively large, indicating significant variability. Results from both methods also indicated that variance due to rater and interactions related with rater were relatively low. The reliability of the mean rating for each examinee based on five items, four raters and four rating criteria using a fully crossed design was 0.58(G-coefficient) and 0.49(phi coefficient). We found the guidelines from the Decision study (D-study) to obtain a more optimal reliability coefficients, it needed at least ten items. Depending on the purpose of a particular study, GT or MFRM may be the appropriate measurement technique to use.
Key Words : Generalizability theory, Many-Facet Rasch Measurement, reliability, interaction effects, mathematics creative problem solving test
* 제 1저자 및 교신저자, [email protected] 2016, Vol. 19, No. 2, pp. 251~279
A Comparison of Generalizability Theory and Many Facet Rasch Measurement in an Analysis of Mathematics Creative Problem Solving Test
Moonsoo Lee (Associate Research Fellow, KICE) *
Dongchun Cha (Jinsung High School)
Ⅰ. Introduction
In the field of education and psychology, the concern about judgments of raters has been growing. Rater effects such as severity/leniency, central tendency are commonly viewed as a source of method variance, that is, as a source of systematic variance in observed ratings that is related with the raters and not with the examinees (Cronbach, 1995; Eckes, 2005; Engelhard, & Wind, 2013; Toffoli et al., 2016). Since examinees naturally vary in terms of their abilities, we do not expect all of them to receive the same rating. Rather, we expect variance in the ratings of examinees’ abilities from one to another. Any variability in the ratings of examinees that is due to dependable differences in their abilities is desirable. However, ratings will be influenced by several extraneous factors such as items, raters, occasions and sub-categories. There are two general approaches to identify the effects of raters and other things. One is Generalizability Theory (GT) and the other is Many-Facet Rasch Measurement (MFRM) (Linacre, 1989).
Estimation of reliability in GT concerns itself with discovering how similar the observed raw scores might be to any other raw scores the examinees might obtain under very similar circumstances. Its aim is to estimate the error variance associated with examinee raw scores, but not to adjust any examinee’s raw score for the particular raters and items that the examinee encountered (Cronbach et al., 1972). In general the variance of observed scores are decomposed into a universe score variance and variances associated with the multiple sources of error and their interactions.
Estimation of reliability in GT proceeds in two stages. First, a Generalizability study (G-study), which contains the universe of admissible observations, is performed to obtain estimates of variance components for the universe of admissible observations.
From these estimates, the second stage involves one or more Decision studies (D-study), which use the estimated variance components from the G-study to estimate variance components for alternative research designs (Smith & Kulikowich, 2004).
Proper use of Rasch models allows for separability of parameter estimates (van der
Linden & Hambleton, 1997). This means the ability estimates of examinees are not
influenced from the distributional properties of particular items attempted and the
particular raters who rate the performance. MFRM concerns itself with obtaining for
each examinee a measure from which the details of the examinee’s particular raters, items and tasks have been removed. In the MFRM perspective, the analytic purpose is to change raw scores from non-linear form into a linear measure, adjusting it for the specific items, raters, or tasks (Linacre, 1993). Smith and Kulikowich (2004) discussed several advantages of MFRM over GT specifically. Here, these two alternative approaches address two different, but related problems.
In the educational measurement field, there is a sizeable literature on rater effects using both of GT and MFRM (Kim, 2005; Kim & Wilson, 2009; Linacre, 1995;
Lunz & Schumacker, 1997; MacMillan, 2000; Marcoulides, 1999). These studies mainly described comparisons of GT and MFRM and also explained how these two measurement techniques can be used to give information considering future assessment construction or data collection. Also they tried to detect and correct for rater variability using both methods. However, very few studies have been conducted comparing the GT and MFRM approaches focusing on interaction factors. The interaction effect is also used in both GT and MFRM, but in slightly different ways.
In GT, the interaction is defined as factorial analysis of variance. The analysis reports one variance component for each interaction of two or more main effects. For example, the variance component for the interaction of persons and raters describes the extent to which persons were rank-ordered differently by different raters (Shavelson & Webb, 1991). In MFRM frame, interaction between the facets represent differential facet functioning, as in Differential Item Functioning (DIF) (Sudweeks et al., 2005). An interaction study helps to identify uncommon interaction patterns among facets in general, those patterns that point to consistent deviations from that is anticipated on the basis of the specific model (Eckes, 2005).
This paper reports the results of a pilot study of a mathematics creative problem
solving test in Korea, 2010. In the context of rater-mediated, performance based
assessment (mathematics creative problem solving test), raters and tasks are two
major sources of score variability and measurement error. When new types of task
such as creative problem solving assessments are used in the test, it is important to
check the rating processes and the impact of new types of task through statistical or
measurement methods. To date, very few papers have compared GT and MFRM
approaches directly in mathematics creative problem solving test, however. The
purpose of this study is
1. To determine the variability in the ratings that is due to inconsistencies between raters with items, criteria, and the interactions among the variables (G-study).
2. To estimate how many conditions of each facet are required to reach a suggested goal level of generalizability (D-study).
3. To investigate how raters differ in the severity or leniency in mathematic creative problem solving test.
4. To compare and contrast the use of GT vs. MFRM with focusing on interaction effects.
Ⅱ. Review of the Methods
1. Generalizability Theory (GT)
Overviews of essential features about GT were provided by Feldt & Brennan (1989) and Shavelson and Webb (1991). Also in-depth descriptions of the concepts and methods of GT have been introduced by Cronbach et al., (1972) and Brennan (2001).
GT examines an analysis of variance approach based on the raw scores to provide acceptable estimates of scoring variation because of raters, items, tasks, or others. By calculating the degree of the variance components, the sources of the largest measurement error can be found (Kim & Wilson, 2009). In the GT framework, the error term can be partitioned into systematic error and random error. Here, the systematic error represents facet variability that can be further partitioned depending on the number of facets involved in the research design and can be applied in determining the dependability of a measurement (Cronbach et al., 1972). Similar to variables having values, facets are comprised of levels that can be defined as random or fixed (Shavelson
& Webb, 1991). Random facets include levels that can be exchanged from the universe of generalization. Conceptually, a facet that is random indicates that the levels included in the analysis are an unbiased sample of levels that could be drawn from the universe of generalization (Cronbach et al., 1972).
In general, the point of a G-study is to get estimates of variance components related
with a universe of admissible observations. These estimates can be used to construct
measurement structure for operational use and to provide information for making substantive decisions efficiently (Brennan, 2001). Next, the D-study focus on the specification of a universe of generalization, which is the universe to which the stakeholder needs to generalize based on the results of a measurement procedure (Brennan, 2001).
For example, Equations (1) and (2) respectively represent the relative and absolute variances of a fully-crossed design with a rater and element facets. Here, the relative error variance means the sum of all variance components that indicate an interaction between the object of measurement and one of the facets and the absolute error variance means the sum of all variance components except the variance component for students.
′
′
′ ′
(1)
′
′
′
′
′ ′
′ ′
(2)
where
: the rater facet variance component
: the item facet variance component
: the person by rater interaction variance component
: the person by item interaction variance component
: the rater by item interaction variance component
: the person by rater by item interaction confounded with random error variance
′ : the number of raters to be used in this study
′ : the number of items to be used in this study
In GT, two types of reliability or dependability are considered: relative and absolute
reliability. Relative dependability (G-coefficient ( )) refers to the consistency with
which examinees can be ranked based on performance skill. Absolute dependability () is consistency with which scores occur around a particular scale point. Therefore, it is possible to determine consistency with which ratings from different raters occur around a specific quality point of performance (Shavelson & Webb, 1991). Using Equation (3) and (4), relative and absolute dependability coefficients for specific measurement designs can be estimated.
(3)
(4)
where
: relative error variance
: absolute error variance
2. Many-Facet Rasch Model (MFRM)
Since the 1990s performance-based language assessment has been essential for
testing student’s linguistic knowledge or thinking skill. Thus, the MFRM has been used
to analyze individual rater’s characteristics and their detailed influence on the scoring
process (McNamara & Knoch, 2012). Examples are rater’s leniency/severity, scoring
consistency, and rater’s training effect. Nystrand et al., (1993) and Weigle (1999)
investigated the effects caused by tasks and variety of tests, as well as their interaction
and relationship with the rater’s characteristics. Gyagenda and Engelhard (2009)
reported reliability of the raters’ assessment on students’ writing ability. Sudweeks,
Reeve and Bradshaw (2005) studied biases and interactions amongst elements that
were systematic error sources on university students’ essays. Johnson and Lim (2009)
investigated rater’s first language influence on their assessments of English as a
second language proficiency. Recently, the MFRM’s applications have appeared on not
only traditional education, but also other research fields. For example, on studies of
creative writing (Bardot et al., 2012), creativity (Hung et al., 2012), scale job analysis (Wang & Stahl, 2012), food behavioral analysis (Vianello & Robusto, 2010), and medical performance assessment (McManus et al., 2013).
The MFRM is derived from the Rasch model’s family for polytomous items. The partial credit model by Masters (1982) is generalized rating scale model that each item has its own scaling rate. This model allows for greater flexibility in how items are modeled. Equation (5) presents the partial credit MFRM which four facets (examinees, items, raters, and categories), introduced by Linacre and Wright (2002) and allows each item to have its own scale of classification:
ln
(5)
where
the probability of category being observed
the probability of category being observed
the ability of person
the difficulty of item
the severity of judge
the difficulty of being rated in category rather than category
The MFRM fulfills the equivalent requirement of objectivity of the other Rasch’s models. The testing scores are sufficient statistics for estimating each parameter and each facet parameters is independently estimated from the other facets. Thus, the examinee’s ability measures are independent on items and raters (Linacre & Wright, 2002).
Brennan (2001), Linacre (1993, 1995, 2001), and Kim and Wilson (2009) discussed the
comparison issues for GT and MFRM in terms of major research questions, statistical
model, design issues, methods of data collection, standard results, and limitations of
these two approaches. They recommended it useful to conduct the GT analysis first
to get an overview of how the assessment/test was performing and then use the
MFRM in order to understand more of the details.
Ⅲ. Methods
1. Sample and Procedure
Data for this study were the score results of 172 10th grade students on a mathematics creative problem solving test. It was administered for 50 minutes during July 2010 in a high school located in an urban area of Korea. The test was composed of five open-ended questions(See Appendix 1) which was developed based on Nam(2007) and Shin et al.,(1999). Four raters(two mathematics teachers, two mathematics education experts) scored all of the students’ responses with a scoring rubric (Sheffield, 2006). Sheffield’s scoring rubric includes seven criteria: depth of understanding, fluency, flexibility, originality, elaboration, generalizations, and extensions for assessing mathematical creativity. The modified scoring rubric for this study is composed of four criteria fluency, flexibility, originality, and elaboration (See Appendix 2).
2. Design
A sample of answer sheets written by 172 students was selected for analysis in this study. There were no missing values in this data. Four raters, all full or part–time instructors in the mathematics department, rated each of the 172 answer sheets. Each rater rated all answer sheets; therefore, the design for the study is a fully crossed, four-factor design: person by item by rater by criteria.
3. Analysis
A. GT analysis
For the G-study, a fully crossed (172 participants, 5 items, 4 raters, and 4 criteria)
random effects model was specified (See Figure 1). The G-study was conducted using
the GENOVA program (Crick & Brennan, 1983). Variance components were estimated
for each of the 15 sources of variability possible in the three-facet (items, raters, and
criteria), fully crossed design (p×i×r×c). D-studies were also conducted for three
different design structures. Here, error variances and reliability coefficients for relative and absolute decisions were calculated for each design, as well as for varying numbers of items, raters. The three designs (D-study) analyzed included the following:
1. Fully crossed design p × I × R : each rater rates all examinees on all items 2. Persons crossed with (items nested within raters) p × (I : R) : each rater rates all
examinees on selected items
3. (Raters nested within persons) crossed with items (R : p) × I : each rater rates selected examinees on all items
: Persons,
: Items,
: Raters,
: Criteria
[Figure 1] Venn diagram for G-study ( × × × design)
× × design
× design × design [Figure 2] Venn diagrams for D-study designs
B. MFRM analysis
The MFRM analysis was conducted using the FACETS program (Linacre, 2010).
Four facets were analyzed including (a) 172 examinees, (b) 5 items, (c) 4 raters, and
(d) 4 criteria. Once the parameters of each facet are calibrated from the four-faceted
maineffects model, ten interaction analyses (or bias analyses) including all two-way
and three-way interactions between rater and other facets were performed to identify
the unusual patterns of rating performance across person, item, or criteria facets that
are deviated from the expectation on the underlying model. The standardized residual,
which is the standardized difference between the expected and observed ratings, is
represented as logit score, and the interaction pattern with an absolute z-score greater
than 2.00 was considered to be significantly biased. Here, fixed chi-square tests for
each bias term were used to investigate whether the set of interactions can be
acceptable after allowing for the measurement error (Linacre, 2010).
Ⅳ. Results
1. GT analysis
A. G-study
The estimated variance component for each the 15 sources of variation in the ratings are reported in Table 1. The variance component attributed to subjects represents variation due to individual differences. Ideally, the variance component for persons should be larger than any of the others. The estimated variance component (0.152) indicates that examinees differ in test. All remaining variance components explain sources of measurement error. The variance attributed to items (0.061) may be interpreted as implying that some items reflect more problem solving skills than others.
The relatively small variance component for raters (0.010) means that raters do not differ in their ratings when averaged over other facets. Residual variance indicates that even after accounting for main effects, two- and three-way interactions among the source of error, 15.82% of the variance was still unaccounted. In this analysis, the three largest variance components include the main effect for items (8.62%); the two-way, person by item interaction (19.92%); and the three-way, person by item by criteria interaction (7.34%). This means that the rank order of the examinees was different on the five items. This may be due to scarceness in the number of items, we used only five items for the mathematics creative problem solving test. Therefore, this could provide evidence for the need for more items in this test.
B. D-study
From the variance components, we can get the reliability of relative decisions about
students’ performances (0.580) and for absolute decisions (0.488). Table 2 indicates how
the reliability of the rating for each student will likely vary with different numbers
of items and raters (We do not consider criteria in this D-study).
<Table 1> Variability to each error sources
Source of Variation df Mean Square Variance
Component
Standard Error
% of Variability
Persons (p) 171 22.321 0.152 0.010 21.47
Item (i) 4 202.238 0.061 0.043 8.62
Rater (r) 3 57.554 0.010 0.011 1.41
Criteria (c) 3 201.284 0.048 0.045 6.78
Person by Item (pi) 684 3.008 0.141 0.010 19.92
Person by Rater (pr) 513 0.571 0.008 0.001 1.13
Person by Criteria (pc) 513 0.686 0.011 0.002 1.55
Item by Rater (ir) 12 12.615 0.016 0.007 2.26
Item by Criteria (ic) 12 20.776 0.028 0.011 3.95
Rater by Criteria (rc) 9 13.604 0.014 0.007 1.98
Person by Item by Rater (pir) 2,052 0.286 0.043 0.002 6.07
Rater by Item by Criteria (pic) 2,052 0.320 0.052 0.003 7.34
Rater by Rater by Criteria (prc) 1,539 0.134 0.004 0.001 0.56
Item by Rater by Criteria (irc) 36 1.518 0.008 0.002 1.13
(pirc)+Residual 6,156 0.112 0.112 0.002 15.82
Total 13,759 10,821.660
*0.708 100.00
*
indicates the total value for sum of squares for score effects
<Ta b le 2> Sum mary of D-st udy re su lts Design × × × × IR M E A N G- C O EFF(
PHI( ) ME AN ) G-COEFF(
PHI( ) MEA N ) G-COEFF(
PHI( ) ) 172 5 4 0. 29 4 0. 580 0. 48 8 0.2 52 0. 59 0 0.5 07 0. 228 0.5 56 0. 488 172 10 4 0.17 5 0. 724 0. 63 6 0.1 29 0. 74 2 0.6 73 0. 117 0.6 91 0. 636 172 15 4 0.13 6 0. 790 0. 70 8 0.0 87 0. 81 2 0.7 55 0. 080 0.7 52 0. 708 172 20 4 0.11 6 0. 828 0. 75 0 0.0 67 0. 85 2 0.8 05 0. 061 0.7 86 0. 750 172 5 5 0. 28 0 0. 587 0. 49 7 0.2 47 0. 59 5 0.5 13 0. 228 0.5 67 0. 497 172 10 5 0.16 4 0. 732 0. 64 8 0.1 26 0. 74 6 0.6 78 0. 117 0.7 04 0. 648 172 15 5 0.12 5 0. 797 0. 72 0 0.0 86 0. 81 5 0.7 59 0. 080 0.7 66 0. 720 172 20 5 0.10 5 0. 835 0. 76 3 0.0 66 0. 85 5 0.8 08 0. 061 0.8 01 0. 763 172 5 6 0. 27 1 0. 592 0. 50 3 0.2 44 0. 59 9 0.5 16 0. 228 0.5 75 0. 503 172 10 6 0.15 6 0. 737 0. 65 5 0.1 24 0. 74 9 0.6 81 0. 116 0.7 13 0. 655 172 15 6 0.11 7 0. 802 0. 72 9 0.0 85 0. 81 7 0.7 62 0. 079 0.7 76 0. 729 172 20 6 0.09 8 0. 840 0. 77 2 0.0 65 0. 85 6 0.8 10 0. 061 0.8 11 0. 772 172 5 7 0. 26 5 0. 595 0. 50 7 0.2 41 0. 60 1 0.5 19 0. 227 0.5 80 0. 507 172 10 7 0.15 0 0. 741 0. 66 1 0.1 23 0. 75 1 0.6 83 0. 116 0.7 20 0. 661 172 15 7 0.11 2 0. 806 0. 73 5 0.0 84 0. 81 9 0.7 64 0. 079 0.7 83 0. 735 172 20 7 0.09 2 0. 843 0. 77 9 0.0 64 0. 85 8 0.8 12 0. 061 0.8 19 0. 779
The pattern of Table 2 shows that varying the number of items will have a greater effect on the reliability than the number of raters. In order to obtain a Generalizability coefficient( ) of at least .70 it would be necessary to use at least ten items if the number of raters are larger than four. A × × design assumes that all examinees are rated by every raters on every items. Since this design is not feasible for a very large number of examinees or items, another D-study was performed to project the effect of using other feasible designs ( × and × ). In these two designs, the pattern of coefficient line is very similar to × × design.
2. MFRM analysis
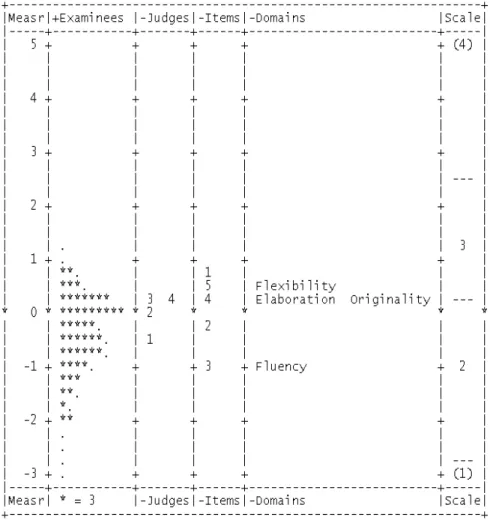
FACETS program measures the students, raters, items, criteria and rating scales onto the interval scale and creates a single frame of reference for interpreting the results of the analysis (Eckes, 2009) (See Figure 3). Overall model fit can be assessed by examining the responses that are unexpected given the assumptions of the model.
According to Linacre (2010), satisfactory model fit is represented when about 5% or less of absolute standardized residuals are equal or greater than 2, and about 1% or less of absolute standardized residuals are equal or greater than 3. There were 13,760 valid responses included in this analysis. Of these, 100 responses (0.72%) were related with absolute standardized residuals equal or greater than 2, and 55 responses (0.40%) were associated with absolute standardized residuals equal or greater than 3. These finding indicated satisfactory model fit for this analysis.
A. Persons (examinees)
The estimated ability for the 172 examinees ranged from -3.30 to 1.23 logits. Fit
statistics for each element within each facet report the extent to which the observed
and expected ratings by the model differ, given the estimated parameters. These fit
statistics are reported as mean squares, which is simply a chi-square divided by the
appropriate degrees of freedom (Smith and Kulikowich, 2004). Plausible ranges for
these fit statistics depend on the testing situation, but one suggested range of
acceptable values is from 0.5 to 1.5 (Engelhard, 1992). In this analysis, twenty-two of
the 172 examinees rated had infit and outfit mean squares of 1.50 or above; however,
they were below 2.0, in a range where such values would not seem to distort the overall results.
[Figure 3] Variable map for the relationship among facets.
Note. Each * represents three persons, Judges=Raters, Domains=Criteria.
B. Items, Raters, and Criteria
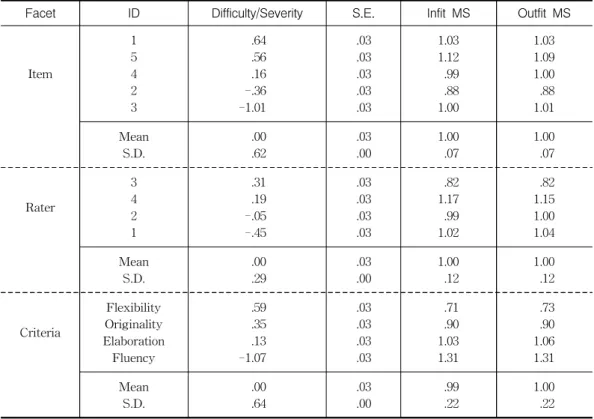
Table 3 shows the relative difficulty of five items in this test. Positive values are
indicative of items that were difficult relative to the other items while negative values
are indicative of items that were easier. Item 1 is the most difficult with a measure
of .64 and item 3 is the easiest with -1.01. The range of fit statistics of items is .88
to 1.12.
<Table 3> MFRM analysis of Items, Raters, and Criteria
Facet ID Difficulty/Severity S.E. Infit MS Outfit MS
Item
1 5 4 2 3
.64 .56 .16 -.36 -1.01
.03 .03 .03 .03 .03
1.03 1.12 .99 .88 1.00
1.03 1.09 1.00 .88 1.01 Mean
S.D.
.00 .62
.03 .00
1.00 .07
1.00 .07
Rater
3 4 2 1
.31 .19 -.05 -.45
.03 .03 .03 .03
.82 1.17 .99 1.02
.82 1.15 1.00 1.04 Mean
S.D.
.00 .29
.03 .00
1.00 .12
1.00 .12
Criteria
Flexibility Originality Elaboration Fluency
.59 .35 .13 -1.07
.03 .03 .03 .03
.71 .90 1.03 1.31
.73 .90 1.06 1.31 Mean
S.D.
.00 .64
.03 .00
.99 .22
1.00 .22
The rater severity and leniency measures for each of the four raters are also reported in Table 3. Positive values are indicative of raters who were severe relative to the other raters while negative values are indicative of raters who had a tendency to assign ratings that were lenient relative to the other raters (Sudweeks et al., 2005). Rater 3 is most severe with a measure of .31 and rater 1 is most lenient with -.45 in this study.
The infit and outfit statistics for the four raters are within the acceptable range of 0.5 to 1.5 (0.82∼1.17).
Table 3 has the information about relative difficulty of four criteria: Flexibility,
Originality, Elaboration, and Fluency. Flexibility is the most difficult criteria with a
measure of .59 and Fluency is the easiest with –1.07 in this assessment. The range
of the fit statistics of items is .71 to 1.31.
<T ab le 4> Statistics for th e interaction analy sis (M FR M) Typ e of In tera cti o n Statistics P×I P×R P×C I×R I×C R ×C P×I × R P ×I ×C P× R × C I× R ×C P×I × R × C N com b inatio ns 860 68 8 688 20 20 16 34 40 27 52 27 52 80 137 60 % large Z sco res
137 .79 3.4 9 4. 80 40. 00 45 .00 25 .00 14. 22 2. 33 2. 29 37 .5 1. 16 Minimu m Z - 6. 28 -2.6 2 - 4. 71 -9. 15 - 9. 58 -6 .42 - 3. 81 -2. 95 - 2. 95 -8. 88 - 2. 76 Maximum Z 7.86 3.2 7 3. 07 13. 73 8. 29 4. 05 4. 91 3. 83 3. 83 11. 52 3. 34 Mean 0. 13 0.0 0 0. 00 -0. 02 0.06 - 0. 13 0. 06 0. 00 0. 00 -0. 01 0. 05 SD 2. 25 0.9 2 0. 96 4. 67 4. 68 2. 61 1. 35 0. 86 0. 86 4. 18 0. 78
1Pe rc en ta g e of absolu te Z sc o re s (s tan d ar di z e d bia s sc o re s) eq ua l to or gr eat er tha n 2.
C. Interaction (Bias) analysis
Six sets of two-way bias and four sets of three-way bias, and residual analyses were performed. Once the MFRM main analysis is finished by using the base model, the interaction analysis also be examined on the residuals of the main analysis, with the facet parameters from the main analyses fixed (Linacre, 2010). Here, the residuals between raw and expected scores are calculated for each combination of elements, and the residual scores for each facet are converted into logit measures and standardized z-scores (Lee & Kantor, 2015). Table 4 lists the total number of combinations of facet elements considered in each interaction analysis: the percentage of absolute Z score equal or greater than 2, the minimum and maximum Z scores, as well as their means and standard deviations. Z scores over an absolute value of 2.0 are held to indicate significant interaction (Linacre, 2010). In this study the percentage values for the Person × Rater, Person × Criteria, Person × Item × Criteria, and Person × Rater × Criteria interactions were generally low. More than 40% of the combinations of Item × Rater and Item × Criteria interactions were related with significant differences between observed and expected ratings. This means that in the interactions, the item involved is responding consistently to the rater or criteria in a way which is both different from other items.
<Table 5> Variability to each interaction elements (MFRM) Source of
Variation
Variance
Component % of Variability
Variance explained by Rasch measures .23 37.70
Variance of residuals .38 62.30
Variance explained by bias / interactions pi .16 26.23
pr .02 3.28
pc .02 3.28
ir .01 1.64
ic .02 3.28
rc .01 1.64
pir .04 6.56
pic .04 6.56
prc .01 1.64
irc .01 1.64
Variance remaining in residuals .04 6.56
Raw-score variance of observations .61 100.00
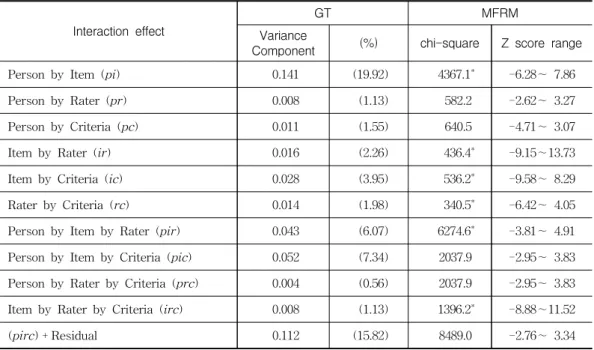
Table 5 shows the estimated variance component for each source of variation in the rating. The largest percentage of significant interactions was found in the analysis of interactions between Persons and Items (26.23%). Four, three-way bias analyses were also performed, with the two highest percentages of significant three-way interactions in the analysis being Persons, Items, and Raters (6.56%) and Persons, Items, and Criteria (6.56%). In this interaction analysis the pattern of interaction is similar to the result of the G-study. Also, a comparison table of the results of interaction effects of GT and MFRM are displayed in Table 6. The GT results show that relative large variance component for the interaction between person and items (19.92%). This means that items are examined differently across students in this assessment. The variance components related rater interactions are small: raters have same standards across all students. The MFRM results indicate that each of the interaction effects (person by item, item by rater, item by criteria, rater by criteria, person by item by rater, item by rater by criteria) is statistically significant.
<Table 6> Comparison of Interaction Effect Differences
Interaction effect
GT MFRM
Variance
Component (%) chi-square Z score range
Person by Item (pi) 0.141 (19.92) 4367.1
*-6.28∼ 7.86
Person by Rater (pr) 0.008 (1.13) 582.2 -2.62∼ 3.27
Person by Criteria (pc) 0.011 (1.55) 640.5 -4.71∼ 3.07
Item by Rater (ir) 0.016 (2.26) 436.4
*-9.15∼13.73
Item by Criteria (ic) 0.028 (3.95) 536.2
*-9.58∼ 8.29
Rater by Criteria (rc) 0.014 (1.98) 340.5
*-6.42∼ 4.05
Person by Item by Rater (pir) 0.043 (6.07) 6274.6
*-3.81∼ 4.91
Person by Item by Criteria (pic) 0.052 (7.34) 2037.9 -2.95∼ 3.83
Person by Rater by Criteria (prc) 0.004 (0.56) 2037.9 -2.95∼ 3.83
Item by Rater by Criteria (irc) 0.008 (1.13) 1396.2
*-8.88∼11.52
(pirc) + Residual 0.112 (15.82) 8489.0 -2.76∼ 3.34
*
indicates significant difference at .001 level
Ⅴ. Discussion
The purpose of this paper was to investigate rater effects in a mathematics creative problem solving test. Both GT and MFRM analyses seem to consent which facets of the model generate the greatest proportion of variability in this study. For both the GT and MFRM results, the variance component for the Person by Item interaction is relatively large, indicating significant variability. Especially, MFRM interaction analyses revealed that about 26% of the Person × Item combinations, and about 6.5%
of the Person × Item × Rater and Person × Item × Criteria combinations, produced unexpectedly high deviations from model expectations. Results from both methods also indicated that variance due to rater and interactions related with rater were relatively low. However, a few discrepancies were found in interaction analyses between GT and MFRM. In contrast to GT, which found relatively large variance estimates in person by item by criteria, MFRM indicated that there were significantly biased ratings in item by rater and item by rater by criteria interactions.
The reliability of the mean rating for each examinee based on five items, four raters and four rating criteria using a fully crossed design was 0.58 (G-coefficient) and 0.49 (phi coefficient). These values were lower than might be expected for measure of reliability. However, we found the guidelines from the D-study to obtain a more optimal reliability coefficients, it needed at least ten items. The use of a nested design in the D-study yielded reliability coefficients that differed by less than 3% from the fully crossed design. This finding means that considerable resources could be saved with minimal loss in generalizability by employing such a design.
To sum up, the findings of this study support the complementary roles the GT and MRFM play in performance assessment analysis. Therefore, depending on the purpose of a particular study, GT or MFRM may be the appropriate measurement technique to use. As it is introduced in previous research (Linacre, 1993, 1995, 2001; Kim &
Wilson, 2009), GT is useful in providing group-level information (the internal
consistency of the test and the inter-rater agreement on task level), and particularly
in making overall decisions about test design. In other words, we can draw the relative
influence of each factor on a measure of the target. Also researcher can estimate how
many conditions of each elements are needed to reach a suggested goal level of
generalizability. MFRM provides more specific information, which can be fed into the test development and improvement process at many points. Therefore, MFRM analysis enable us to investigate individual scores after controlling the facets.
In this paper, there are limitations that should be considered for conducting next
study. Although the results of this paper showed the empirical evidence for the
possibility of existence of rater effects on the mathematics creative problem solving
test to examinee, we did not take any other factors except statistic or measurement
properties. This limited us to suggest more practical implications, such as what
characteristics of the participants, raters, or items may lead the rater effects.
References
Bardot, B., TAN, M., Randi, J., Santa-Donato, G., & Grigorenko, E. L. (2012).
Essential skills for creative writing: Integrating multiple domain-specific perspectives. Thinking Skills and Creativity, 7(3), 1-15.
Brennan, R. (2001). Generalizability theory. New York: Springer-Verlag.
Crick, J. E. & Brennan, R. L. (1983). Manual for GENOVA: a generalized analysis of variance system, American College Testing Technical Bulletin, 43. Iowa City, IA: ACT, Inc.
Cronbach, L. J. (1995). Giving method variance its due. In P. E. Shrout & S. T.
Fiske (Eds.), Personality research, methods, and theory: A Festschrift in honor of Donald Fiske (pp. 145-157). Hillsdale, NJ: Lawrence Erlbaum associates, Inc.
Cronbach, L. J., Gleser, G. C., Nanda, G., & Rajaratnam, N. (1972). The dependability of behavioral measurements: theory of generalizability for scores and profiles. New York: Wiley.
Eckes, T. (2005). Examining rater effects in TestDaF writing and speaking performance assessments: a many-facet Rasch analysis. Language Assessment Quarterly, 2(3), 197-221.
Eckes, T. (2009). Many-facet Rasch measurement. In S. Takala (Ed.), Reference supplement to the manual for relating language examinations to the Common European Framework of Reference for Languages: Learning, teaching, assessment (Section H). Strasbourg, France: Council of Europe/Language Policy Division.
Engelhard, G., Jr. (1992). The measurement of writing ability with a many-faceted Rasch model. Applied Measurement in Education, 5, 171-191.
Engelhard, G, & Wind, S. A. (2013). Rating quality studies using Rasch measurement theory, Educational Testing Service (ETS), Research Reports, Princeton, NJ, 2013.
Feldt, L. S., & Brennan, R. (1989). Reliability. In R. L. Linn (Ed.), Educational measurement (3rd ed., pp. 105–146). New York: Macmillan.
Gyagenda, I. S., & Engelhard, G. (2009). Using classical and modern measurement
theories to explore rater, domain, and gender influences on student writing
ability. Journal of Applied Measurement, 10, 225-246.
Hung, S. P., Chen, P. H., & Chen, H. C. (2012). Improving creativity performance assessment: A rater effect examination with many facet Rasch model.
Creativity Research Journal, 24(4), 345-357.
Johnson, J. S., & Lim, G. S. (2009). The influence of rater language background on writing performance assessment. Language Testing, 26(4), 485-505.
Kim, S. (2005). A comparative investigation of analyzing sources of variation in the observational rating system. Korean Journal of Education Evaluation, 18(1), 227-248.
Kim, S. C, & Wilson, M., (2009). A comparative analysis of the ratings in performance assessment using generalizability theory and the many-facet Rasch model. Journal of Applied Measurement, 10(4), 408-423.
Lee, Y-W., & Kantor, R. (2015). Investigating Complex Interaction Effects Among Facet Elements in an ESL Writing Test Consisting of Integrated and Independent Tasks. Language Research, 51(3), 653-678.
Linacre, J. M. (1989). Many-facet Rasch measurement. Chicago: MESA Press.
Linacre, J. M. (1993). Generalizability theory and Many-facet Rasch measurement. In G. Engelhard Jr. & M. Wilson (Eds.). Objective measurement: Theory into practice, 3, 85-98. Norwood, NJ: Ablex.
Linacre, J. M. (1995). Generalizability theory and many facet Rasch measurement, In Wilson, M. Draney, K & Engelhard, Jr. (Eds.). Objective Measurement: Theory into practice, Norwood, NJ: Abex.
Linacre, J. M. (2001). Generalizability Theory and Rasch Measurement. Rasch Measurement Transactions, 15(1). 806-807.
Linacre, J. M. (2010). A user’s guide to FACETS [computer program manual].
Chicago: MESA Press.
Linacre J. M., & Wright, B. D. (2002). Construction of measures from many-facet Data. Journal of Applied Measurement, 3(4), 484-509.
Lunz, M. E. & Schumacker, R. E. (1997). Scoring and analysis of performance examinations: a comparison of methods and interpretations. Journal of Outcome Measurement, 1(3), 219-238.
Masters, G. N. (1982). A Rasch model for partial credit scoring. Psychometrica, 47, 149-174.
Marcoulides, G. A. (1999). Generalizability Theory: Picking up where the Rasch
IRT model leaves off? In Embretson & Hershberger (ed.), the New Rules of
Measurement: what every psychologist and educator should know, Lawrence
Erlbaum Associates
MacMillan, P. D. (2000). Classical, generalizability, and multifaceted Rasch detection of interrater variability in large, sparse data sets. The Journal of Experimental Education, 68(2), 167-190.
McNamara, T., & Knoch, U. (2012). The Rasch wars: The emergence of Rasch measurement in language testing. Language Testing, 29(4), 555-576.
McManus, I. C., Elder, A.T., & Dacre, J. (2013). Investigating possible ethnicity and sex bias in clinical examiners: An analysis of data from the MRCP(UK) PACES and nPACES examinations. BMC Medical Education. 13, 103. Available at http://www.biomedcentral.com/1472-6920/13/103.
Nam, S. (2007). A study on the development evaluation item to extend mathematical creativity, Communications of Mathematical Education, 21(2), 271-282.
Nystrand, M., Cohen, A. S., & Dowling, N.M. (1993). Addressing reliability problems in the portfolio assessment of college writing. Educational Assessment, 1, 53-70.
Shavelson, R. J., & Webb, N. M. (1991). Generalizability theory: A primer. Newbury Park, CA: Sage.
Sheffield, L. J. (2006). Developing Mathematical Promise and Creativity. Research in Mathematics Education, 10(1), 1-11
Shin, I. S., Ahn, D. Y. & Lee, B. J. (1999). Developing problems for creativity improvement of mathematically gifted children. Communications of Mathematical Education, 9, 257-266.
Smith, E. V. Jr. & Kulikowich, J. M. (2004). An application of generalizablitiy theory and Many-facet Rasch measurement using a complex problem-solving skills assessment. Educational and Psychological Measurement, 64(4), 617-639.
Sudweeks, R., Reeve, S., & Bradshaw, W. (2005) A comparison of generalizability theory and many-facet Rasch measurement in an analysis of college sophomore writing. Assessing Writing, 9, 239-261.
Toffoli, S. L, de Andrade, D. F, & Bornia, A. C. (2016). Evaluation of open items using the many-facet Rasch model. Journal of Applied Statistics, 43(2), 299-316.
van der Linden, W. J., & Hambleton, R. K. (Eds.). (1997). Handbook of modern item response theory. New York: Springer-Verlag.
Vianello, M., & Robusto, E. (2010). The many-facet Rasch model in the analysis of the go/no-go association task. Behavior Research Methods, 42(4), 944-956.
Wang, N, & Stahl, J. (2012). Obtaining content weights for test specifications from
job analysis task surveys: An application of the many-facets Rasch model.
International Journal of Testing. 12(4), 299-320.
Weigle, S.C. (1999). Investigating rater/prompt interactions in writing assessment:
Quantitative and qualitative approaches. Assessing Writing, 6(2), 145-178.
· 논문접수 : 2016.04.05. / 수정본접수 : 2016.05.02. / 게재승인 : 2016.05.16.
# Appendix 1. Instrument (which was developed based on the research of Nam(2007) and Shin et al.,(1999))
(1) How many lines do you need to divide the given square into 2 or 3 pieces? The divided pieces must be equal in shape and size. For example, to make 2 pieces you need 2 lines, to make 3 pieces, you need 2 lines. Then, how many lines do you need to make 5, 7, and 9 pieces?
(2) Create a problem according to the data below(as many as possible).
Language Achievement
5 O X O X
O O
4 X X X X O X
O O O O
3 O X X X X X X X X X
O O O O
2 O O O X
1 X
O: female 1 2 3 4 5
X: male Mathematics Achievement
(3) There are many ways to find the area of a trapezoid. Find the area using different methods and express it with drawings.
(4) Find the pattern with the numbers given
1
1 1
1 2 1
1 3 3 1
1 4 6 4 1
1 5 10 10 5 1
1 6 15 20 15 6 1
1 7 21 35 35 21 7 1
1 8 28 56 70 56 28 8 1
1 9 36 84 126 126 84 36 9 1
(5) Create a problem with the picture given(as many as possible)
# Appendix 2. Scoring rubric (Sheffield, 2006)
Assessment Criteria
1 (Novice)
2 (Apprentice)
3 (Proficient)
4 (Distinguished)
Fluency
One incomplete
or unworkable strategy or technique
At least one appropriate solution with
strategy or technique shown
At least two appropriate solutions, may use
the same strategy or technique
Several appropriate solutions, may use the same strategy or
technique
Flexibility No method apparent
At least one method (e.g., all
graphs, all algebraic equations
and so on)
At least two methods of solution (e.g.,
geometric, graphical, algebraic, physical modeling)
Three or more methods of solution
(e.g., geometric, graphical, algebraic, physical modeling)
Originality
Method may be different but does not
lead to a solution
Method will lead to a solution but is fairly common
Unusual, workable method used by
only a few students, or uncommon
solution
Unique, insightful method or solution used only by one or
two students
Elaboration
Little or no appropriate explanation
given
Explanation is understandable but is unclear in
some places
Clear explanation using correct mathematical
terms
Clear, concise, precise explanations making good use of graphs, charts, models, or
equations
국문요약