<연구논문> Fashion & Text. Res. J.
Vol. 19, No. 6, pp.749-758(2017) https://doi.org/10.5805/SFTI.2017.19.6.749
749
Developing of Grading Method using 3D Body Measurement Data of Women in Their Thirties
-Focusing on Their Proper Body Types-
Ju-young Annie Shin
1)†and Yun-ja Nam
1)
Dept. of Fashion Design, Soongeui Womens University; Seoul, Korea
Dept. of Clothing & Textiles/ Research Institute of Human Ecology, Seoul National University; Seoul, Korea
Abstract : The purpose of the present study is to develop a grading deviation, which is appropriate for the body type of women in thirties, by analyzing the three-dimensional body type. The materials for the study were adopted from the body measurement data of women in the age group of 30 to 39 years old, provided from Size Korea. By reflecting the factor analysis results using the three-dimensional shape measurement, deviations were derived. First, six factors influencing the changes in human body shape were derived as waist-hip length factor, bust-waist shape factor, back protrusion back shoulder factor, bust length factor, shoulder length factor, and frontal waist dart factor. The bust size and height, which can be easily utilized for the top original grading, were used for deriving a regression formula, and the deviation was set in accordance with the result. Second, by applying the deviation which reflects the changes in the body shape, the crimps which were generated due to the application of existing deviation were remarkably reduced, indicating that the grading of the present study is more fitting than the existing one. The deviation derived by the analysis of actual increase and decrease of body size was more fitting than the existing one. This was proved by actual wearing experiment, which rep- resents the significance of this study.
Key words : master pattern, 3D scan data, grading, grade rule development, female body shape, grading deviation
1. Introduction
Grading, which refers to the increase or decrease in the size level of a certain pattern, can be utilized as an efficient system suitable for many persons depending on the appropriateness of the standard pat- tern. One of the most typical issues shown in the grading of existing ready-made clothing is poorly fitting clothes as the wearer’s size deviates from the standard size, due to uniform deviation that does not reflect the characteristics of body types (Bye et al ., 2007;
Petrova & Ashdown, 2008; Taylor & Martin, 1984). The reason for this is the lack of standardized data, and the fact that the setting of the size mainly depends on the experience of pattern makers. Even though pattern grading is an essential process for ready-made clothes manufactured for the many and unspecified, domestic cloth- ing companies still apply standard sizes, units, and ranges of mea- surement, and deviations, which are not alike. In addition, the
criteria for the lack of scientific or systematic basis have been reported (Sohn & Hong, 2005). Setting standardized sizes, charac- teristics, and the change mode of women’s body types should be considered while setting the grading deviation. Especially, busts of women in their thirties are lower than in their twenties due to preg- nancy and childbirth, and they have thicker waists and sagged hips, along with a dimmed curve when looked at from the side. Women have a thicker waist and trunk with increasing age. This should be reflected in the manufacturing process of clothes, but the trunk grad- ing of common clothing companies is not applied according to body analysis. Patterns should reflect the length and circumference and also the difference in the length between the bust and shoulder and the dart for each size of body type (Choi, 2001; Jang, 1997). The largest size is the most problematic for customers’ fitness with regard to grading (Bye et al., 2007).
Data acquired by a three-dimensional scanner not only enables the collection of simple figures, but also the establishment of com- plex DB including various characteristics such as the human body cross-section, datum points, angles, area of body surface, or length of body surface. The degree of fitness of clothes with sizes far from the standard can be increased by basing the grading deviation on human body measurements (Schofield & Labat, 2006) and the three-dimensional body shape data should be utilized to determine
†Corresponding author; Ju-young Annie Shin Tel. +82-2-880-8768, Fax. +82-2-879-1976 E-mail: [email protected]
© 2017 (by) the authors. This article is an open access article distributed under the terms and conditions of the Creative Commons Attribution license (http://creativecommons.org/licenses/by/3.0/), which permits unre- stricted use, distribution, and reproduction in any medium, provided the original work is properly cited.
2. Method
2.1. Materials
The somatotype classification of the upper body of lateral view was based on previous studies. In this study, 3D body scan images and lateral shoulder to the lateral waist line were used to classify the side somatotype. The study included 138 women who were found to have the proper body type in the lateral body type classification,
sectional factors, length of body surface, and shoulder. SPSS 16.0 for Windows was used for the statistical analysis. The three-dimen- sional human body measurements were performed using Rapid- form 2006 (INUS Technology, Inc. Korea), and AutoCAD2005 (Autodesk, Inc.). The Super-Alpha plus program (Youthhitech, 1997) was used for incision-type grading.
2.2.1. Analysis of the length of body surface
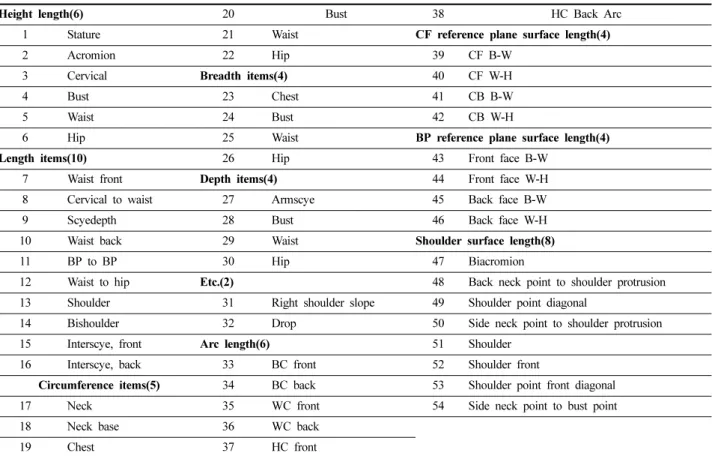
Items 33 through 54 in Table 1 relate to the length of the body
Table 1. Body measurement items
Height length(6) 20 Bust 38 HC Back Arc
1 Stature 21 Waist CF reference plane surface length(4)
2 Acromion 22 Hip 39 CF B-W
3 Cervical Breadth items(4) 40 CF W-H
4 Bust 23 Chest 41 CB B-W
5 Waist 24 Bust 42 CB W-H
6 Hip 25 Waist BP reference plane surface length(4)
Length items(10) 26 Hip 43 Front face B-W
7 Waist front Depth items(4) 44 Front face W-H
8 Cervical to waist 27 Armscye 45 Back face B-W
9 Scyedepth 28 Bust 46 Back face W-H
10 Waist back 29 Waist Shoulder surface length(8)
11 BP to BP 30 Hip 47 Biacromion
12 Waist to hip Etc.(2) 48 Back neck point to shoulder protrusion
13 Shoulder 31 Right shoulder slope 49 Shoulder point diagonal
14 Bishoulder 32 Drop 50 Side neck point to shoulder protrusion
15 Interscye, front Arc length(6) 51 Shoulder
16 Interscye, back 33 BC front 52 Shoulder front
Circumference items(5) 34 BC back 53 Shoulder point front diagonal
17 Neck 35 WC front 54 Side neck point to bust point
18 Neck base 36 WC back
19 Chest 37 HC front
*Note: BC(Bust Circumference), WC(Waist Circumference), HC(Hip Circumference), CF(Center Front), CB(Center Back), B-W(Bust-Waist), W- H(Waist-Hip), B-W(Bust-Waist)
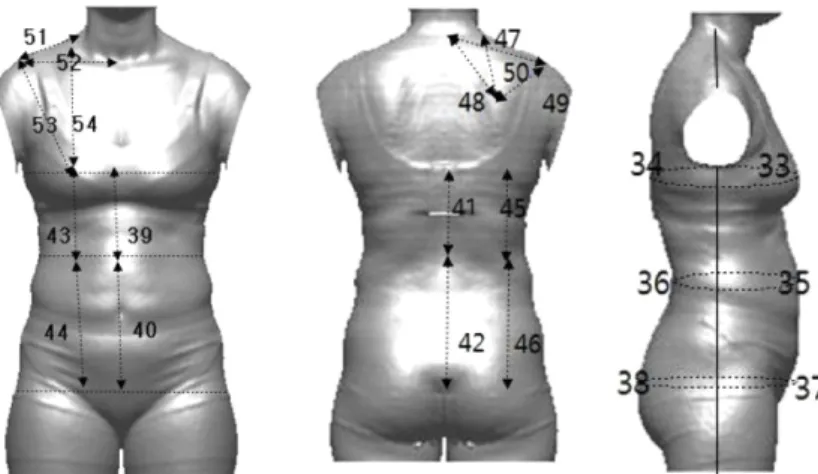
surface, while the parts measured with the length of the body sur- face are shown in Fig. 1.
2.2.2. Analysis of cross-sectional factor
In this study, 3D body scan images were used to classify the side somatotype. The plumb line passed through tragion, the bust depth and abdomen depth region laterally. Since the human body has dif- ferent thickness ratios on both the front and back, depending on the baseline, the thickness ratios of the respective front and backsides for each measurement interval should be analyzed and reflected in the grading.
2.2.3. Analysis of shoulder shape
To measure the length of body surface, the point which is most protruded when looked at from above, while setting the frontal side as the bottom, based on the middlemost side of the human body, was set as the shoulder bone upper protrusion point, and the
remaining standard points were marked to measure the length of the body surface. The line, which connects the back neck point and lateral shoulder point usually does not follow the normal index of the human body. Therefore, a plane connecting the back neck point and lateral shoulder is set for the measurement of length of body surface, as shown in Fig. 2.
2.3. Verification of grading deviation
The development of master patterns used in this study was sug- gested by Shin and Nam (2015). The master patterns and grading deviation that was developed used the grading deviation of Y, a CAD system company, as the existing deviation (Table 2). The expert group comprises five persons who are either doctoral stu- dents of apparel study, or have more than 5 years of work expe- rience in the field of apparel studies. The evaluation of the clothed status was carried out using the five-point Likert technique. The internal consistency of the expert group was reviewed using Cron-
Fig. 1. Parts measured to determine the length of the body surface of the three-dimensional human body shape.Fig. 2. Shoulder body surface length measurement method.
Table 2. Comparison (Domestic Y company) grading part and deviation value Deviation
part
Bust circumference
Waist circumference
Hip circumference
Shoulder circumference
Clothes length
Vibration circumference
Deviation value 3cm 3cm 3cm 0.5cm 1cm 0.5cm
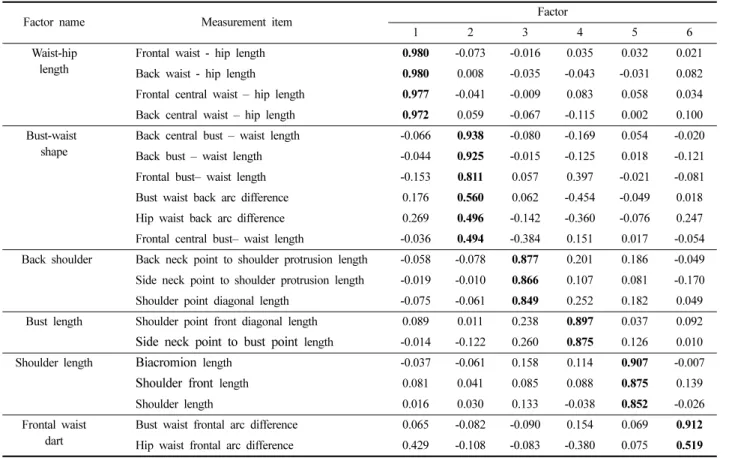
with more than one specific value as six. The total explanatory value was 85.9%. The number of factors was set as six, and was conducted with factor rotation (Varimax orthogonal rotation). The constituents of the variables for each factor were reviewed to decide the name of the factor (Table 3).
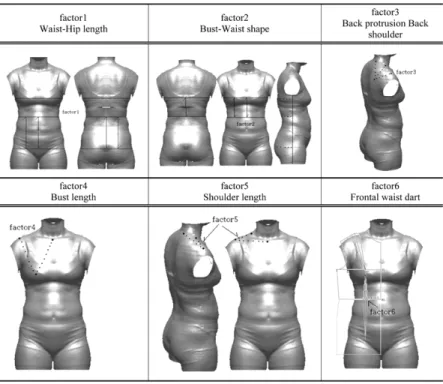
3.2. Selection of deviation part and derivation of deviation The six factors and their referring body parts are suggested in Fig. 3. Factor 1 is the length of the body surface items of the front and backsides measured by the standard bust plane and frontal cen- tral standard plane. The high proportion range of this study is a total
back arc derived from Factor 2, and the deduction of waist cir- cumference back arc from the hip circumference back arc influence the back waist dart (Table 4).
The length factor between the bust and waist circumference lev- els is 0.4cm, while the deviation of the back waist dart factor is 0.1 when smaller than the standard size of 91cm, and 0.2cm when larger, depending on the size interval of the bust circumference, as applied on the patterns.
Factor 3 comprises items such as the neck back shoulder bone upper protrusion length, end shoulder diagonal line length, and neck lateral shoulder bone upper protrusion length. The items were
Table 3. Factors and factor loads by orthogonal rotation
Factor name Measurement item Factor
1 2 3 4 5 6
Waist-hip length
Frontal waist - hip length 0.980 -0.073 -0.016 0.035 0.032 0.021
Back waist - hip length 0.980 0.008 -0.035 -0.043 -0.031 0.082
Frontal central waist – hip length 0.977 -0.041 -0.009 0.083 0.058 0.034 Back central waist – hip length 0.972 0.059 -0.067 -0.115 0.002 0.100 Bust-waist
shape
Back central bust – waist length -0.066 0.938 -0.080 -0.169 0.054 -0.020
Back bust – waist length -0.044 0.925 -0.015 -0.125 0.018 -0.121
Frontal bust– waist length -0.153 0.811 0.057 0.397 -0.021 -0.081
Bust waist back arc difference 0.176 0.560 0.062 -0.454 -0.049 0.018 Hip waist back arc difference 0.269 0.496 -0.142 -0.360 -0.076 0.247 Frontal central bust– waist length -0.036 0.494 -0.384 0.151 0.017 -0.054 Back shoulder Back neck point to shoulder protrusion length -0.058 -0.078 0.877 0.201 0.186 -0.049
Side neck point to shoulder protrusion length -0.019 -0.010 0.866 0.107 0.081 -0.170 Shoulder point diagonal length -0.075 -0.061 0.849 0.252 0.182 0.049 Bust length Shoulder point front diagonal length 0.089 0.011 0.238 0.897 0.037 0.092
Side neck point to bust point
length -0.014 -0.122 0.260 0.875 0.126 0.010Shoulder length
Biacromion
length -0.037 -0.061 0.158 0.114 0.907 -0.007Shoulder front
length 0.081 0.041 0.085 0.088 0.875 0.139Shoulder length 0.016 0.030 0.133 -0.038 0.852 -0.026
Frontal waist dart
Bust waist frontal arc difference 0.065 -0.082 -0.090 0.154 0.069 0.912 Hip waist frontal arc difference 0.429 -0.108 -0.083 -0.380 0.075 0.519
measured to reflect the shape of the shoulder, and all three items reflect the back protrusion point. All three items were shown to be correlated to the bust circumference, thus the following regression formula was used. Factor 4 refers to the ‘bust length’ factor, com- prising the end shoulder frontal diagonal line length, and bust
length. Both items include the bust point in common. When exam- ining the changes in body shape caused by the increase of bust cir- cumference, since the location of the bust point changes as the bust circumference increases, the reflection of length changes of the top wear is of paramount importance. The result obtained with the
Fig. 3. Part for each factor.Table 4. Regression formula using the measured items of Factor 1, and Factor 2
Factor Measured length of body surface item Regression formula β R² P-value Deviation value(cm)
1 Waist-hip length
Frontal central waist hip L =-5.662+0.169*H 0.510 0.260 0.000 0.84
Back central waist hip L =-2.580+0.151*H 0.477 0.228 0.000 0.75
Front side waist hip L =-3.917+0.158*H 0.490 0.240 0.000 0.79
Back side waist hip L =-3.984+0.160*H 0.502 0.252 0.000 0.80
2 Bust-waist shape
Front side bust waist L y=6.561+0.064*H 0.217 0.042 0.016 0.3
Frontal central bust waist L y=-12.055+0.177*H 0.310 0.039 0.021 0.8
Back side bust waist L y=2.007+0.087*H 0.781 0.093 0.000 0.4
*Abbreviation: L(Length), H(Height)
Table 5. Regression formula using the Factor 3and Factor 4
Factor Measured length of body surface Regression formula β R² P-value Deviation (cm)
3
Neck back shoulder bone upper protrusion length =8.063+0.093*BC 0.377 0.142 0.000 0.27 End shoulder diagonal line length =6.339+0.123*BC 0.465 0.216 0.001 0.36 Neck lateral shoulder bone upper protrusion length =5.521+0.140*BC 0.382 0.146 0.042 0.42 4 End shoulder frontal diagonal line length =9.977+0.155*BC 0.629 0.396 0.000 0.56
Bust point length =8.362+0.193*BC 0.689 0.475 0.000 0.67
*Abbreviation: BC(Bust Circumference)
regression formula derived by substituting the bust circumference is provided in Table 5.
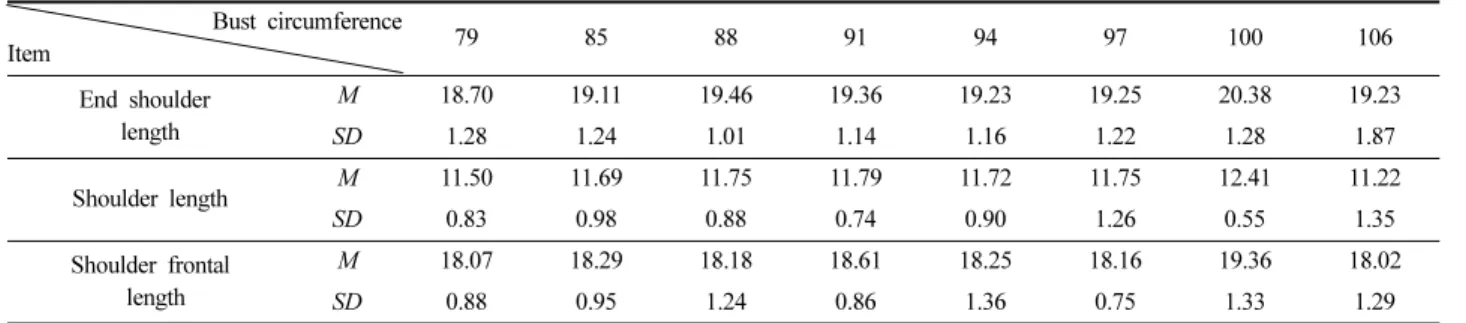
Factor 5 is a shoulder length-related factor, and comprises the end shoulder length, shoulder length, and shoulder frontal length.
Only the end shoulder length, among the 3 items, showed low cor- relation with the bust circumference (Table 6). However, in the
explained, it was not satisfactory for constituting the regression for- mula. Therefore, the technical statistical values of the 3 items were used to derive the deviation of the bust circumference as 0.1cm (Table 7).
Factor 6 can reflect the items to the waist dart. Especially, in terms of a dart of a general form, since the upper and lower parts of the dart have the same shape, the difference between the bust and waist circumferences are set as the dart. Therefore, the regression formula was derived from the bust circumference. The frontal waist dart of the existing master patterns was set as 1.5cm, and the evaluation result was determined as appropriate. Therefore, based
Table 7. Deviation chart of frontal dart factor (unit: cm)Bust circumference item 82 85 88 91 94 97 100 Frontal waist dart 0.1 0.1 0.1 0 -0.2 -0.2 -0.2
*Shadow means median.
Table 8. Verification model applied with existing deviation, and deviation of the present study
Front Lateral Back
Existing deviation Deviation of the
present study Existing deviation Deviation of the
present study Existing deviation Deviation of the present study 85-155
88-160
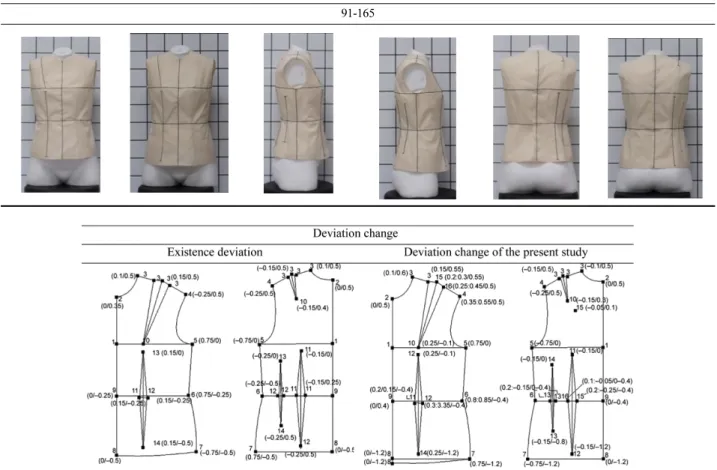
on the frontal waist dart of 1.5cm at the bust circumference, the dart reflects shrinkage when the size exceeds the standard and enlarge- ment when the size is smaller than the standard (Table 7). The girth and length grading deviations were reflected to produce blocks for 3 combination ranges of 85-155, 88-160 and 91-165 (Table 8).
The deviation change was applied with the existing deviation and is shown in Fig. 4. As a result, the torso block standard lines did not fall out when applied in the study and existing grading deviations, the lines stayed horizontal, the part of the hem that came up in the front was improved. Also the wrinkles from the existing grading deviations were significantly reduced thanks to the appropriate deviation amounts. With the support of the results above, the grading deviations of this study when applied to the pattern got the higher scores from exports.
3.3. Verification of grading deviation of the present study 3.3.1. Application of grading deviation and clothed-status eval- uation
By reflecting the developed deviation for each interval and each length on the master patterns, a torso of three intervals was man-
ufactured for the final verification.
The expert group suggested baseline-related items by dividing the items according to the front, lateral, and backsides. The surplus, dart, crimps, overall exterior, and other items were suggested in the same way, by dividing the items into more specific sub-items. The result shows that, compared to the existing deviation, the waist and hip circumference lines were improved with their horizontality, the best at the interval of 85-155cm. The waist circumference line showed improvements in all three sizes on the front side, by reflect- ing the deviation derived from the length analysis, compared with the existing deviation (Table 10).
Many of the items requiring the exterior of the dart showed a higher average value when the new deviation was applied. How- ever, the frontal waist darts in the interval of 85-155cm showed a higher result when applying the existing deviation. However, the exterior evaluation did not show a significant difference for most items. Since the range of dart deviation is only 0.1 to 0.2cm, which is not much, the difference could not have been easy to recognize by merely looking at the exterior shown in the photograph. The sil- houette evaluation on the frontal and backsides on the lateral side
Table 8. Verification model applied with existing deviation, and deviation of the present study(continued)91-165
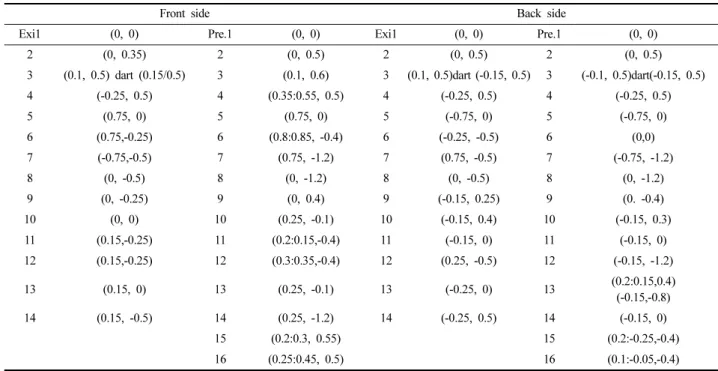
Fig. 4. Deviation from existing deviation, and the deviation of the present study.
showed improved results with the new deviation.
4. Conclusion
The present study used three-dimensional human body shape
data as ingredients for a factor analysis for the development of grading deviation to reflect changes in the body shape. The analysis resulted in identifying six factors: waist-hip length; bust-waist shape; back protrusion back shoulder; bust point length; shoulder length; and frontal dart. A 0.8-cm deviation was set as the deviation
11 (0.15,-0.25) 11 (0.2:0.15,-0.4) 11 (-0.15, 0) 11 (-0.15, 0)
12 (0.15,-0.25) 12 (0.3:0.35,-0.4) 12 (0.25, -0.5) 12 (-0.15, -1.2)
13 (0.15, 0) 13 (0.25, -0.1) 13 (-0.25, 0) 13 (0.2:0.15,0.4)
(-0.15,-0.8)
14 (0.15, -0.5) 14 (0.25, -1.2) 14 (-0.25, 0.5) 14 (-0.15, 0)
15 (0.2:0.3, 0.55) 15 (0.2:-0.25,-0.4)
16 (0.25:0.45, 0.5) 16 (0.1:-0.05,-0.4)
*Exi-existing deviation, Pre-deviation of the present study
Table 10. Experts’ appearance evaluation of line
Item Evaluation questions 85-155 88-160 91-165
Ex Pe Ex Pe Ex Pe
1 Proper position of center front line 4.2 4.6 3.4 4.8 3.6 4.2
2 Proper position of bust line 3.0 4.4** 3.2 4.6** 3.8 4.6
3 Horizontal of bust line 3.2 4.6* 3.0 4.6* 4.0 4.6
4 Proper position of waist line 3.0 4.6** 3.4 4.6* 2.4 4.6*
5 Horizontal of waist line 3.2 4.6** 3.2 4.6* 4.0 4.6
6 Proper position of hip line 3.2 4.4** 3.6 4.4 2.4 4.4**
7 Horizontal of hip line 3.4 4.4* 3.4 4.2 3.8 4.4
8 Proper position of armscye circumference 3.8 4.4 3.8 4.4 4.0 4.2
25 Is the Side seam divided body in equilibrium? 2.8 4.8** 3.0 4.6** 3.6 4.6*
26 Proper position of bust line 2.8 4.8** 3.0 4.4** 4.0 4.4
27 Horizontal of bust line 2.6 4.8*** 2.6 4.6** 3.4 4.6*
28 Proper position of waist line 2.8 4.8* 3.2 4.4** 2.8 4.6**
29 Horizontal of waist line 2.8 4.8*** 2.6 4.4** 3.4 4.4*
30 Proper position of hip line 3.8 4.4 3.8 4.4 2.6 4.6**
31 Horizontal of hip line 3.0 4.4** 3.6 4.2 3.4 4.0
32 Proper position of armscye circumference 3.2 4.4 3.0 3.8 3.8 4.0
for each interval of the waist-hip length factor, whereas the bust- waist shape factor was derived with the circumference-related component along with the length-related component. Therefore, - 0.2cm was applied to bust intervals over 91 cm, while +0.1cm was applied to intervals below 91cm. The back protrusion back shoul- der and bust point length factors were applied with deviations of 0.4cm and 0.7cm, respectively, whereas the deviation of the shoul- der length factor was 0.1cm. Finally, the deviation of the dart factor was reduced by -0.2cm and enlarged by +0.1cm for a bust cir- cumference over and under 91cm, respectively. The neck circum- ference, vibration circumference, and frontal bust dart were concluded by exterior evaluation, and were reflected in the devi- ations to derive the final grading deviation.
The final verification was as follows: bust circumference (85cm) and height 155cm (85-155), bust circumference (88cm) and height 160cm (88-160), and bust circumference (91cm) and height 165cm (91-165). The excellence of the developed grading deviation was verified by selecting existing deviations used by the general apparel CAD company. The exterior evaluation showed that the baseline, dart, shoulder line, exterior, crimps, etc. showed an excellent result compared to the existing deviation. The evaluation by a group of experts found that the crimp and overall fitness were improved by reflecting the changes in the body shape, compared with the result shown by the existing deviation. As this study focused on women in their thirties, the plan is to study other age groups in future.
Acknowledgments
This study was supported by the ‘Research Institute of Human Ecology’ Seoul National University, Seoul, Korea.
References
Bye, E., Labat, K., Mckinney, E., & Kim, D. E. (2007). Optimized pattern grading. International Journal of Clothing Science and Technology, 20(2), 79-92. doi:10.1108/09556220810850469
Cho, J. S., & Choi, J. W. (2002). Development of a grading increments chart for women's wear focusing on dimensional variations among groups of different ages, heights, and drop values. Textile Science and Engineering, 39(2), 240-250.
Cho, Y. K. (1994). A study on the application of the split grading to the apparel CAD system. Unpublished master's thesis, Ewha Womans University, Seoul.
Choi, Y. S. (2001). A study on the comparison of women's wear grading by different age groups. Unpublished master's thesis, Dongduk Women's University, Seoul.
Jang, S. O. (1997). A study of developing grading technique for adjustable Korean women’s body type. Journal of Industrial Technology, 12(2), 93-104.
Jeon, E. J. (2004). A study on values of grading rules to improve the fitted jacket for middle-aged women. Unpublished master's thesis, Sungkyunkwan University, Seoul.
Jung, M. S. (2009). Study on the basic bodice pattern grading according to the measurement variations of the body. The Korean Society of Community Living Science, 20(4), 571-578.
Kwon, S. H. (1997). Classification and analysis of the somatotype through side view silhouette of the whole body by multivariate method. Journal of the Korean Society of Clothing and Textiles, 21(7), 1227-1235.
Korean Agency for Technology and Standards. (2004). The 5th Size Korea 3D scan & measurement technology report. Seoul:
Government Printing Office.
Korean Industrial Standard. (2009). KS K 0051- Female Adult's Garments. Seoul: Korean Standard Association.
Lim, J. Y. (2010). A study on the obese junior-high school girls’ slacks sizing system and slacks pattern grading. Fashion and Textile Research Journal, 12(2), 194-202.
Ng, R. (2011). Three-dimensional grading of virtual garment with design signature curves”, in Duffy, V.G. (Ed.). Proceedings of the Digital Human Modeling: Third International Conference, ICDHM 2011, Held as Part of HCI International 2011, Orlando, FL, USA July 9-14, 2011. Springer, Berlin Heidelberg, pp. 328- 336.
Petrova, A., & Ashdown, S. P. (2008). Three-dimensional body scan data analysis: Body size shape dependence of ease values for pants's fit. Clothing and Textile Research Journal, 26(3), 227-252.
doi:10.1177/0887302X07309479
Schofield, N. A., & Labat, K. L. (2006). Exploring the relation of grading, sizing, and anthropometric data. International Textile & Apparel Table 10. Experts’ appearance evaluation of line (continued)
43 Proper position of center back line 4.2 4.4 3.8 4.6 3.8 4.6
44 Proper position of bust line 3.2 4.6 3.4 4.2* 3.4 4.2
45 Horizontal of bust line 3.2 4.4* 3.2 4.2* 3.4 4.4
46 Proper position of waist line 3.2 4.6** 3.4 4.6* 2.4 4.6**
47 Horizontal of waist line 2.8 4.8** 3.0 4.4** 3.6 4.6*
48 Proper position of hip line 3.6 4.4 3.2 4.4** 2.2 4.6**
49 Horizontal of hip line 3.6 4.2 3.4 4.4* 3.8 4.6
50 Proper position of armscye circumference 3.2 4.2* 3.4 4.0 3.6 3.8
*Ex-existing deviation, Pr-deviation of the present study