Copyright © 2018. Anatomy & Cell Biology
of adults in impoverished societies, as a reduction in bone turnover is prevalent among malnourished children. Howev- er, it is difficult to isolate this parameter, as bone and growth development can also be influenced by genetics [4], ethnicity [5-7], environmental factors [8], and socioeconomic status [9].
The important relationship between diet and bone health is well-established, and nutritional habits can be influenced both culturally and geographically. Bonjour et al. [10] reviewed over 180 studies to investigate the effect of minerals and vita- mins on bone health, and detailed the beneficial effects that calcium, vitamin D, phosphorus, vitamin K, and magnesium all have on bone health. Many nutrients, such as calcium, also need to be monitored in adolescents, and an example of this was demonstrated through a survey in France where young
Introduction
Approximately 20 million children suffer from severe malnutrition worldwide [1]. However, the wide variety of in- fluences that nutrition has on bone development and growth remains largely unknown. According to Ndiaye et al. [2] and Branca et al. [3], malnutrition contributes to decreased stature
Corresponding author:
Christian Moro
Faculty of Health Sciences and Medicine, Bond University, Gold Coast, 4229, Australia
Tel: +61-755954775, Fax: +61-755951652, E-mail: cmoro@bond.edu.au
Nutrition and growth: assessing the impact of regional nutritional intake on childhood development and metacarpal parameters
Christian Moro, Jessica Covino
Faculty of Health Sciences and Medicine, Bond University, Gold Coast, Australia
Abstract: Measuring skeletal development throughout juvenile growth can provide a greater understanding into the health, hormonal function and genetics of children. The metacarpals have been of interest for their potential to provide insights into healthy juvenile skeletal development. This study investigated the growth patterns of developing females from isolated communities who had varied diets. Anthropometrical measurements and hand-wrist X-rays were taken of 353 juvenile females from three populations: Pari Coastal Village and Bundi Highlands Village, Papua New Guinea (PNG); and Brisbane, Australia between 1968 to 1983. Radiographs were digitized, and the length and width of the second and third metacarpals compared to each subject’s height and weight. As subject heights increased, metacarpal length and width increased. However, stature and second metacarpal length indicated the strongest correlation (P<0.01), compared to third metacarpal length (P<0.01) or width.
From 11 to 13 years of age, Brisbane subjects were significantly heavier and taller in comparison to subjects from PNG, and coastal females were heavier and taller than the highland females. A prominent difference between the two PNG populations was the regional intake of protein in their diets. The second metacarpal presents particularly accurate measurements when determining the height or development of a child. Nutritional intake appears to have a major influence normal childhood growth, with a potential for protein deficiency to strongly inhibit growth. Any delayed growth is particularly evident in the child’s stature, as well as in the development of the metacarpal long bones of the hand.
Key words: Metacarpal dimensions, Skeletal growth, Juvenile development, Radiographs, Reference values, Radiogrammetry Received October 3, 2017; 1st Revised November 20, 2017; 2nd Revised December 7, 2017; Accepted December 14, 2017
girls between 8 and 18 years old had mean calcium intakes of 820 mg/day [10] which was far below the recommended 1,200 mg/day.
Besides minerals and vitamins, protein also appears to be particularly important in development, where it is required in the building and maintenance of all cells in the body [11]. For example, osteocalcin is a vitamin K–dependent protein that has been recognised in bone health and development [12].
Synthesized by osteoblasts, osteocalcin is the most profuse non-collagenous protein of the bone extracellular matrix and is proposed to be an important factor of bone accrual and bone loss [13]. It is unclear exactly what forms of develop- ment are influenced by a lack of protein, although Hediger et al. [14] investigated the effects on bone development in boys with autism spectrum disorder whose parents had restricted casein (protein found in milk) in their diets, and found a sig- nificantly lower cortical thickness in their metacarpal bones.
To determine if a child is developing at a normal rate, sev- eral methods can be utilized, including assessing X-rays of the long bones, or creating growth-charts of a child’s stature as they age. Investigations into stature estimation from the length of limbs or limb segments began at the end of the 19th century [15]. Not only is human stature crucial for providing information regarding nutrition, health and genetics of a cer- tain population, but it is also a valuable set of the parameters for personal identification. Gryfe et al. [16] put forward the possibility that other anatomical measurements could be used to estimate stature in children, with particular interest in the metacarpal bones. The first study to investigate the use of the left hand metacarpals was conducted by Himes et al. [17], who aimed to examine the reliability of second metacarpal (2-MTC) length as an estimation of stature in children aged 1‒7 years, for the purpose of forensic and archeological re- construction. This longitudinal study consisted of 372 boys and 338 girls from rural Guatemala. 2-MTC length was mea- sured from left hand-wrist X-rays and anthropometric ex- aminations were conducted. The findings concluded that the 2-MTC length may be a realistic estimator of stature in young children [17].
Researchers have become increasingly reliant upon the metacarpal bones as a measure of skeletal health and develop- ment. This is now in widespread use as it has been recognized to provide reliable results of height that are comparable to those established from long bones [18]. Accurate skeletal measurements, and a clearer understanding skeletal growth is also important in areas such as forensic analyses, where
calculations for extrapolating morphometric features are con- ducted from skeletal remains, and modern education systems utilizing 3D modelling visualizations to represent skeletal ages [19]. This study aims to investigate the influence on growth of females from two populations in Papua New Guinea: Pari Coastal Village, where fish and seafood provided a wealth of additional protein; and Bundi Highlands Village, where mini- mal protein was available. At the time of the study, both diets were highly restrictive, and have been well-classified [20, 21].
Growth patterns from children in these restrictive diets will be compared to females who maintained a highly varied diet, from Brisbane, Australia. Furthermore, this study will inves- tigate whether the metacarpal bones of the left hand can be used as a practical estimator of stature in juvenile females.
Materials and Methods
The hand and wrists of 353 juvenile females were radio- graphed between 1968 and 1983 as part of the International Biological Program (IBP). Established in 1964, the IBP was a worldwide multinational study to determine human adapt- ability with a main objective of examining and comparing dif- ferent ethnic and economic groups. To be consistent between studies, all IBP data was collected to anatomical standards at the time. These included methods used to measure stature, arm length, head breadth, and other anthropometrical fea- tures. All subjects in this study were assessed using the pa- rameters outlined from the IBP. Three regions were assessed as part of the IBP, although the data collected over the >10 years was never assessed or processed. These regions included a coastal village, Pari, which was relatively isolated and located South East from the capital, Port Moresby. The second loca- tion, Bundi, was a small village in the highlands of Papua New Guinea. This village was not on any major roads, and heavily isolated from outside interference or contact. The third loca- tion was from high schools in a capital city, Brisbane, Austra- lia, and acted as a control group for all measurements.
Subjects examined in this study included 229 females from Pari, 20 females from Bundi, and 142 females from the city of Brisbane in Australia. The 20 Bundi, and 229 Pari females constituted all females living in the village between 7 and 17 years old. The Brisbane female control subjects were selected randomly from volunteers attending three all-girls high schools across the city. The 2-MTC and third metacarpal (3- MTC) bones were examined in this study as they are the most commonly recommended long-bones to assess for childhood
development in previous research. Additionally, the 2-MTC is one of the largest and most durable bones of the hand [22].
Over recent years, metacarpal morphometry has reclaimed its recognition as the measurements obtained from these bones have been suggested to be valid indicators of appositional bone growth in juveniles [14]. The radiographs remained in storage under laboratory conditions and data from these has never been published prior to this study. X-rays were digitised using a ScanMaker 9800XL+ (Microtek, Hsinchu, Taiwan) and the second and third metacarpals measured using ImageJ v1.48 software (NIH, Bethesda, MD, USA). Further analy- sis of the results was undertaken using GraphPad Prism v6 (GraphPad, San Diego, CA, USA). Anthropometrical mea- surements and metacarpal parameters were graphed using calculations of the mean (±SD). Correlations of metacarpal parameters between Bundi, Brisbane, and Pari were analysed and a Pearson’s correlation coefficient was applied to test for significance. A table of critical values for Pearson’s ‘r’ was tested with P<0.05 being significant.
To assess significance between group data relating to Brisbane, Pari, and Bundi, an ordinary one-way analysis of variance (ANOVA) with a Tukey’s post-test was applied. An ordinary one-way ANOVA was also used to compare morpho- metric parameters when the individual groups were matched by age. Where appropriate, an unpaired two-tailed, Student’s t test was used to assess height, weight and metacarpal param- eters for significance with P<0.05 being significant. Ethics was approved by the Bond University Ethics Committee.
Locations
Juveniles from two locations in Papua New Guinea were analysed in this study, Pari and Bundi (Fig. 1). Pari Coastal
Village is located approximately 10 km southeast of Port Moresby [21]. The X-rays used in this project were extracted from a sample taken of 2,056 children aged 0 to 17 years old.
Participants were from three different schools: 1,110 in Pari primary school, 601 in Hagara primary school and 345 in Ba- dihagwa secondary school. All Pari children used in this study were known to be of Motuan ancestry [21]. Data assessed also included anthropometrical measurements of the Pari children, including their standing height and weight. Bundi Highland Village is located in the Madang District of PNG [20]. At the time of data collection, the Bundi villagers were living at altitudes of 600‒2,000 m. A total of 1,741 children, aged from birth to 24 years, were examined and anthropo- metrical measurements were conducted. Hand-wrist X-rays of the Bundi school children were also taken by Dr. Wood as part of the study (Fig. 1). Brisbane, the capital of Queensland, Australia, is situated in the southeast corner of the state. X- rays and anthropometrical data was collected from 663 girls aged 8 to 17 years.
Results
Suitability of the 2-MTC or 3-MTC bones for determination of height
To ascertain whether the 2-MTC or 3-MTC would be an appropriate measure for stature determination, X-rays of females between 7 to 17 years old (n=353) were analyzed.
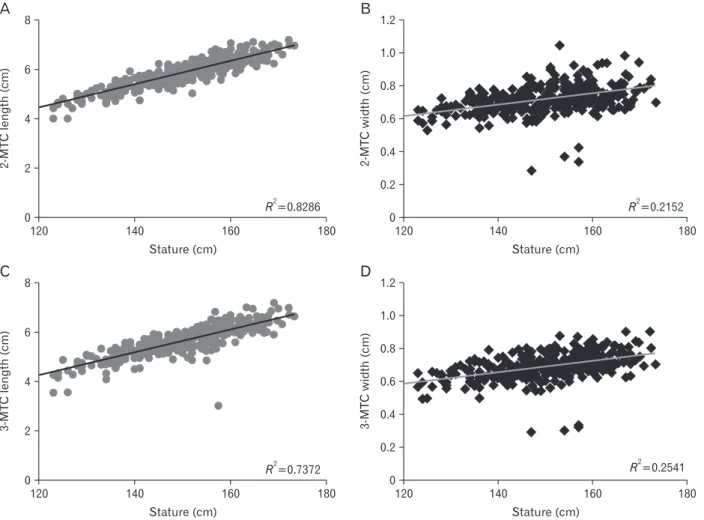
The height of the subjects ranged from 107 to 173 cm, whilst 2-MTC and 3-MTC lengths ranged from 2.9 to 7.4 cm, and widths ranged from 0.3 to 1.0 cm. It was observed that as subjects’ stature increased, 2-MTC length increased (r=0.91, R2=0.829, P<0.01), and 3-MTC length also increased (r=0.86,
A B
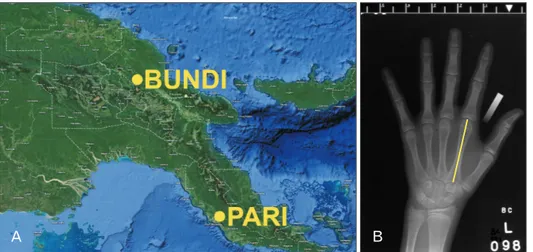
Fig. 1. (A) Map of Papua New Guinea, depict ing the regions where Bundi High land Village and Pari Coastal Village are located (Map data ©2018 Google). (B) Example of an X-ray of a Brisbane female, analysed in ImageJ. The line on the second meta carpal depicts the location used to mea sure length.
R2=0.737, P<0.01) (Fig. 2). Similarly, 2-MTC width (r=0.46, R2=0.215, P<0.01) and 3-MTC width (r=0.50, R2=0.254, P<0.01) also increased as stature increased (Eqs. 1, 2, scatter- plot depicted in Fig. 2).
Equation for height determination from the 2-MTC
(7‒17 year olds) (1)
Estimated height=0.04768×(length of 2-MTC)‒1.274 Estimated height=0.003506×(width of 3-MTC)+0.1659 Equation for height determination from the 3-MTC
(7‒17 year olds) (2)
Estimated height=0.04621×(length of 3-MTC)‒1.283 Estimated height=0.003445×(width of 2-MTC)+0.2016 Formula for estimation of height in juveniles between 7- and 17-years-old derived from subject heights and radio-
graphs analysed in this study (n=353).
Variations in weight between Pari, Bundi, and Brisbane females
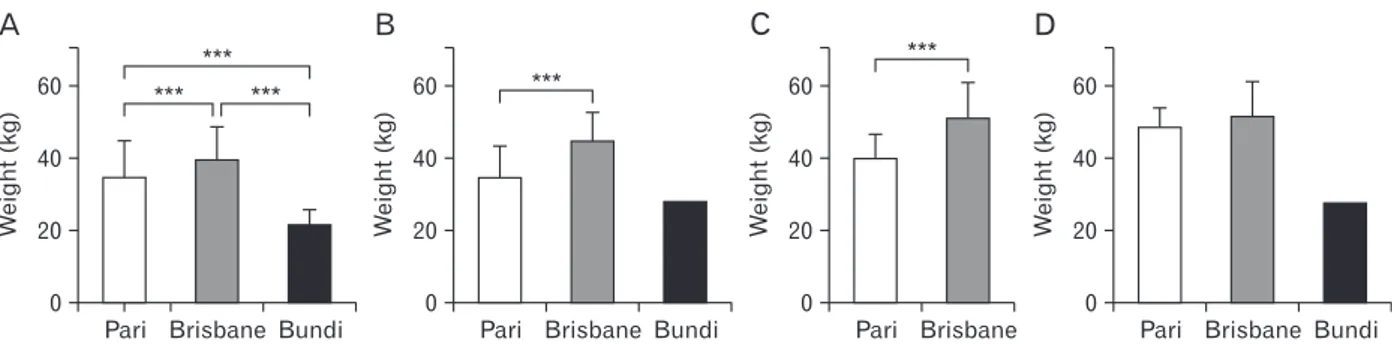
Brisbane female subjects had increased weights when com- pared to both Pari and Bundi subjects (P<0.001). When com- pared between age group, the lowest weight recording was seen within the Bundi population (Fig. 3). In the 13-year-old age group, the same trend persisted, as Brisbane females con- tinued to be heavier than Pari females (P<0.001). There was no statistical difference in weight between 14-year old Pari and Brisbane subjects (P>0.05). Bundi females had only one subject with weight recorded in each of the 12-year-old and 14-year-old age groups and therefore statistical analysis could not be conducted for these two age groups (Fig. 3). From 11 to 14 years of age, the weight of the subjects followed a similar trend, as Brisbane females were consistently heavier in com-
8
6
4
2
0
2-MTClength(cm)
120 140 160 180
A
Stature (cm)
R2=0.8286
1.2 1.0 0.8 0.6 0.4 0.2 0
2-MTCwidth(cm)
120 140 160 180
B
Stature (cm)
R2=0.2152
8
6
4
2
0
3-MTClength(cm)
120 140 160 180
C
Stature (cm)
R2=0.7372
1.2 1.0 0.8 0.6 0.4 0.2 0
3-MTCwidth(cm)
120 140 160 180
D
Stature (cm)
R2=0.2541
Fig. 2. Scatterplots depicting the associations between stature and metacarpal (MTC) parameters of 7- to 17-year-old females (n=353). (A) Stature (cm) and 2-MTC length (cm). (B) Stature (cm) and 2-MTC width (cm). (C) Stature (cm) and 3-MTC length (cm). (D) Stature (cm) and 3-MTC width (cm).
parison to females from PNG. Furthermore, coastal females from Pari were heavier than highland females from Bundi.
Variations in height between Pari, Bundi, and Brisbane females
Brisbane females were tallest among all age groups, fol- lowed by Pari females, then Bundi females as the shortest (Fig.
4). The minimum height in all age groups was 107 cm (Bundi), whilst the maximum height was 173 cm (Brisbane). Signifi- cant differences were found in height when comparing 11- year old females from all three regions (P<0.001 for all) (Fig.
4). Significant differences were observed in the 12-, 13- and 14-year-old age groups for Pari and Brisbane females (P<0.001 for all) (Fig. 4). Similar to the weight data, Bundi could not be analysed for significance in these age groups due to the lack of height recordings within this population.
Metacarpal growth patterns by age 11 years old
For 11-year-old female subjects, significant differences were seen in 2-MTC and 3-MTC mean lengths between Pari and Bundi (P<0.001), and between Brisbane and Bundi (P<0.001).
However, there were no significant differences between Pari and Brisbane (P>0.05). The only significant difference within MTC width was between Pari and Bundi in the 2-MTC.
12 years old
For the 12-year-old female subjects, significant differences were seen between all three populations in both the 2-MTC and 3-MTC lengths. The strongest differences were between the Pari and Bundi subjects (2-MTC length: P<0.001) and Brisbane and Bundi subjects (2-MTC and 3-MTC length:
P<0.001). For MTC widths however, the only significant dif- ference was seen in 3-MTC width between Pari and Brisbane.
13 years old
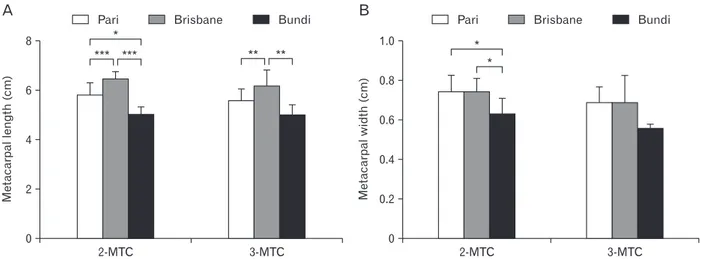
Results indicated a significant difference in 2-MTC length for all three populations (Fig. 5). The significant differences in 3-MTC length were seen between Pari and Brisbane (P<0.01), and Bundi and Brisbane (P<0.01). However, no significant difference was seen between Pari and Bundi (P>0.05) (Fig. 5) Both Pari and Bundi, and Brisbane and Bundi, showed sig- nificant differences in 2-MTC width (P<0.05 for both) (Fig. 4).
D
60 40 20 0
Weight(kg)
Pari Brisbane Bundi
C
60 40 20 0
Weight(kg)
Pari Brisbane
B ***
60 40 20 0
Weight(kg)
Pari Brisbane Bundi
***
A
60 40 20 0
Weight(kg)
Pari Brisbane Bundi
*** ***
***
Fig. 3. Differences in mean weight (kg) between subjects from Pari, Brisbane, and Bundi. (A) The 11-year-old females. (B) The 12-year-old females. (C) The 13-year-old females. (D) The 14-year-old females. ***P<0.001.
A 200
150 100 50 0
Height(cm)
Pari Brisbane Bundi
** *** *** B
0
Pari Brisbane Bundi
***
Height(cm)
200 150 100 50
D
0
Pari Brisbane Bundi
Height(cm)
200 150 100 50
C
0
Pari Brisbane
***
Height(cm)
200 150 100 50
***
Fig. 4. Differences in mean height (cm) between subjects from Pari, Brisbane, and Bundi. (A) The 11-year-old females. (B) The 12-year-old females. (C) The 13-year-old females. (D) The 14-year-old females. **P<0.01, ***P<0.001.
14 years old
All three populations were significantly different for both 2-MTC length and 3-MTC length. In both 2-MTC width and 3-MTC width significant differences were seen between, Pari and Bundi, and Brisbane and Bundi (Fig. 6).
Discussion
The suitability of using 2-MTC length as a measure of stature
According to Haiter-Neto et al. [23] the area of the hand and wrist is thought to be the most indicative region to as- sess skeletal maturation, particularly due to the numerous ossification centres in this area. However, there is a paucity of
research into using the MTC bones as a predictor of stature.
Himes et al. [17] investigated whether the 2-MTC length would be an appropriate estimator of stature in young chil- dren, with results suggesting the 2-MTC as a potential esti- mator of stature. However, this study was only completed on one population, rural Guatemalan children, and Himes et al.
[17] concluded that the estimation equation generated from 2-MTC length is unlikely to be comparable to those from oth- er populations. Furthermore, the measurements made from the hand-wrist X-rays were performed using a dial-read cali- per. In contrast, this thesis used modern computer software ImageJ, developed by the Unites States National Institute of Health, which has far greater accuracy than calipers or other manual methods used in the past [24].
A
8
6
4
2
0
Metacarpallength(cm)
2-MTC 3-MTC
*** ***
*
B
1.0 0.8 0.6 0.4 0.2 0
Metacarpalwidth(cm)
2-MTC 3-MTC
*
** ** *
Pari Brisbane Bundi
Pari Brisbane Bundi
Fig. 5. Differences in metacarpal (MTC) length and width between 13-year-old Pari, Brisbane, and Bundi females (n=61). (A) 2-MTC mean length and 3-MTC mean length. (B) 2-MTC mean width and 3-MTC mean width. *P<0.05, **P<0.01, ***P<0.001.
A
8
6
4
2
0
Metacarpallength(cm)
2-MTC 3-MTC
** ***
**
B
1.0 0.8 0.6 0.4 0.2 0
Metacarpalwidth(cm)
2-MTC 3-MTC
*****
Pari Brisbane Bundi
Pari Brisbane Bundi
** ***
**
***
**
Fig. 6. Differences in metacarpal (MTC) length and width between 14-year-old Pari, Brisbane, and Bundi females (n=150). (A) 2-MTC mean length and 3-MTC mean length. (B) 2-MTC mean width and 3-MTC mean width. **P<0.01, ***P<0.001.
2-MTC and 3-MTC lengths were significantly correlated with stature for the Pari and Brisbane populations in the 12- and 13-year-old age groups, and the 14-year-old Pari females, indicating MTC length to be a reliable measure of stature. However, the results showed no association between MTC width and stature for these populations and age groups (P>0.05). The 14-year-old Brisbane female population showed MTC width as an additional measure of stature, however due to an increased number of outliers, this correlation was not as strong as the relationship between MTC length and stature.
Additionally, Bundi’s significantly smaller MTC bone param- eters, suggests that using 2-MTC length as an estimator for stature would be highly inaccurate.
Early literature has determined that stature estimation equations derived from one population are not universally applicable to other populations with the same degree of cer- tainty [4, 6, 25-27]. However, the 2-MTC length between Pari and Brisbane in the 11-year-old age group, presented no sig- nificant differences (P>0.05).
The following sections provide hypotheses to explain the reasons for the stunted growth exhibited in the Bundi popula- tion.
Genetics
The variations observed in height between two different populations has raised an ongoing challenge for investigators when determining precisely which factors are involved. Al- though genetics and environmental influences normally pres- ent the strongest impact, it is unclear as to the extent that each of these imparts on a developing child. It was interesting to observe that there were similarities between the growth and development of the Brisbane and Pari subjects, whilst great differences occurred between the Bundi and Pari populations.
Pari and Bundi were geographically separated by less than 500 km, which suggests that their genetics and family histo- ries would be more closely related, when comparing either of these populations to the Brisbane children. Therefore, this observed difference in height is not likely to be due to major genetic variations. This finding is in slight contrast to several past studies, which estimate that most the variation in height among individuals may come down to genetic factors [28-30].
However, these key papers focused solely on research on twins to identify heritability of body height, with the exact influence of genetics between populations remaining uncertain. It is interesting to note that height variability has also been found to be a result of environmental factors, such as nutritional
differences and disease exposure [31]. This finding supports other research, which backs up these claims and besides nu- trition and disease, socioeconomic status, locality and climate also have vast influences on height [32]. The lack of variation between Brisbane and Pari, the genetically dissimilar groups assessed in our study, and the significant variation in height between Bundi and Pari, strongly suggests one or more of the other variables caused stunted growth in the Bundi popula- tion. Silventoinen et al. [8] stated that environmental factors were more significant with regards to height among females than among males, and further demonstrated that altering environmental factors affects heritability of height. Being situ- ated in the PNG highlands, the people of Bundi were living at high altitudes, and according to Wilcox [33] it is common for infants born at higher altitudes to be smaller due to decreased oxygen saturation in the air [32]. However, even the highest points of Bundi are under 2,000 m and therefore it is unlikely to have caused substantial growth inhibition. There was a sig- nificant variation between mean heights of 11-year-old Pari and Brisbane subjects (P<0.001), taking into consideration the dissimilarity of the two populations in terms of their genetics and environments, these results were expected. The possible effects of inbreeding should also be considered, as it is known that inbred communities can be shorter in stature, however, in these communities in Papua New Guinea, inbreeding is culturally forbidden, and no marriages are allowed between sub-clans. Even with the remoteness of the Bundi location in the highlands, there maintains sufficient movement of mem- bers (particularly females) between tribes.
Environmental factors
The current study presented surprising results, as children from Bundi were found to have stunted growth with signifi- cantly lower height, weight and MTC parameters. According to Tanner [34], height is a widely accepted marker of popula- tion health. Several studies have shown that adult height is negatively associated with morbidity and mortality from vari- ous diseases [35-38]. A study conducted by Davey Smith et al. [35] observed an inverse relationship between height and mortality from respiratory, cardiovascular disease and cancer.
Further studies have indicated that individuals with shorter stature, much like the people of Bundi, are at a higher risk of developing type 2 diabetes, heart disease and osteoarthritis [39, 40]. Tanner and Davies [41] stated that the first two years of life are exceptionally significant for a child’s height devel- opment. It is during these two years that children form the
fastest growth in the entire postnatal life [41]. This is a critical time for growth and development of children, and therefore, factors that have a negative influence on growth would have detrimental impacts during this period. A more recent review by Victora et al. [42] investigated the association between maternal and child undernutrition and the negative effects on adult health, and concluded that poor growth in the first two years of life continues into adulthood. Additionally, ear- lier studies have observed a strong relationship between early life undernutrition and shorter adult height [43]. Adequate nutrition is crucial for the proper development of infants and children [44]. Nutritional supplementation has shown clear benefits on the developments of a child, including practical reasoning, eye and hand coordination, hearing and speech, and general performance [45]. Throughout the time of this study, the diet of the Bundi people consisted mostly of low- protein foods such as corn, beans, tomatoes and bananas during the dry season, whilst the wet season diet was limited to green leafy vegetables and sweet potato. Unlike the people living in the coastal village of Pari who had access to fish- ing, sources of protein were scarce in the highland village of Bundi. Protein sources in Bundi were limited to a variety of insects, spiders, frogs and other small forms of animal life which Malcolm [20] has stated is insufficient to meet the needs of the children.
Protein intake
As a coastal village, fishing was the primary method of obtaining protein for the community of Pari [21]. In the highland village of Bundi, however, fishing, or substantial ani- mal farming of any sort was not possible. Brisbane subjects, situated in a capital city, had a varied diet that commonly included seafood and other sources of protein. In Bundi, therefore, the lack of easily obtainable sources of protein was likely the major differentiating factor to induce the limited growth and development compared to the other regions. Al- though protein is the main candidate for the observed stunted growth in Bundi, additional benefits of seafood consumption cannot be ruled out. For example, seafood would have been a source other trace elements such as of iodine, and is also rich in omega-3, an essential dietary nutrient. Lowered intake of seafood and protein could not only affect the direct skeletal growth of a child as they age, but may also induce stunted de- velopment from the womb. Studies have shown that maternal diet is a significant factor of foetal growth [46]. This includes a Norwegian study consisting of 62,033 women, conducted
to investigate the influence of maternal intakes of seafood and subtypes of seafood, in infant birth weight, length and head circumference [47]. The results from this study showed a positive association between seafood consumption, and birthweight and head circumference, with the relative risk of delivering a small baby lowered in women who commonly ate seafood [47]. As such, it should be noted that there could be other benefits from having a seafood-rich diet, compared to simply considering it as solely a source of protein.
This current study indicated that although the children of Pari and Bundi share the same nationality, it is assumed that the significant difference in height and weight is due to the two populations dietary intakes. The diverse nutritional intake and diet has been strongly represented, not only in the height and weight measurements, but also in the MTC parameters. Protein deficiency in the Bundi population was likely to be caused by limited access to food sources contain- ing protein, particularly fish. In further support of this find- ing Leonard [48] has noted that even seasonal food scarcities can induce stunted growth rates. Therefore, it is possible that the inhibited growth and development of the Bundi children, when compared to the Pari and Brisbane children, was caused in a large part, by a protein deficiency due to the unavailabil- ity of fish.
This present study supports past research identifying the MTC bones as appropriate measures of stature, and has found that the 2-MTC in particular is the most accurate of these bones. An additional outcome has been the finding that the length of the 2-MTC is a more effective estimator of stature when compared to MTC width. In addition, the importance of nutrition in normal skeletal development was highlighted, and one cause for stunted growth of the Bundi Highlands Vil- lage population appears to have been the lack of available nu- trition. This is possibly due to the absence of high amounts of protein from the diet, in contrast to the other regions. These results may assist with the considerations that paediatric, radiographic or forensic or academic assessors utilise when determining the healthy rate of a child’s growth and develop- ment in the future.
Acknowledgements
The authors would like to thank Dr Wally Wood for his meticulous data collection in both Australia and Papua New Guinea. His attention to detail and wealth of knowledge and experience in this area has been the cornerstone of this proj-
ect. The authors also thank Dr Athanasios Raikos, Dr Allan Stirling, Alexandra Mortimore, Kate Cleary, Emily Horan and Ellis Pointer for their preliminary work decoding and organ- ising the radiographs in preparation for this research project.
References
1. Ahmad A, Komai S. Malnutrition and neurologic problems among children in the developing world. Semin Pediatr Neurol 2015;22:73-4.
2. Ndiaye B, Lemonnier D, Sall MG, Prudhon C, Diaham B, Zeg- houd F, Guillozo H, Leite N, Wade S. Serum osteocalcin regula- tion in protein-energy malnourished children. Pediatr Res 1995;
37:606-10.
3. Branca F, Robins SP, Ferro-Luzzi A, Golden MH. Bone turnover in malnourished children. Lancet 1992;340:1493-6.
4. Trotter M, Gleser GC. Estimation of stature from long bones of American Whites and Negroes. Am J Phys Anthropol 1952;10:
463-514.
5. Meadows L, Jantz RL. Allometric secular change in the long bones from the 1800s to the present. J Forensic Sci 1995;40:762- 7.
6. Telkka A. On the prediction of human stature from the long bones. Acta Anat (Basel) 1950;9:103-17.
7. Ruff C. Variation in human body size and shape. Annu Rev An- thropol 2002;31:211-32.
8. Silventoinen K, Kaprio J, Lahelma E, Koskenvuo M. Relative ef- fect of genetic and environmental factors on body height: differ- ences across birth cohorts among Finnish men and women. Am J Public Health 2000;90:627-30.
9. Silva LM, van Rossem L, Jansen PW, Hokken-Koelega AC, Moll HA, Hofman A, Mackenbach JP, Jaddoe VW, Raat H. Children of low socioeconomic status show accelerated linear growth in early childhood: results from the Generation R Study. PLoS One 2012;7:e37356.
10. Bonjour JP, Gueguen L, Palacios C, Shearer MJ, Weaver CM.
Minerals and vitamins in bone health: the potential value of di- etary enhancement. Br J Nutr 2009;101:1581-96.
11. Shamir R, Turck D, Phillip M. Nutrition and growth. Basel:
Karger; 2013.
12. Kim W, Bae S, Kim H, Kim Y, Choi J, Lim SY, Lee HJ, Lee J, Choi J, Jang M, Lee KE, Chung SG, Hwang YI, Kang JS, Lee WJ. Ascor- bic acid insufficiency induces the severe defect on bone forma- tion via the down-regulation of osteocalcin production. Anat Cell Biol 2013;46:254-61.
13. Willing MC, Torner JC, Burns TL, Janz KF, Marshall T, Gilmore J, Deschenes SP, Warren JJ, Levy SM. Gene polymorphisms, bone mineral density and bone mineral content in young children: the Iowa Bone Development Study. Osteoporos Int 2003;14:650-8.
14. Hediger ML, England LJ, Molloy CA, Yu KF, Manning-Courtney P, Mills JL. Reduced bone cortical thickness in boys with autism or autism spectrum disorder. J Autism Dev Disord 2008;38:848- 56.
15. Abrahamyan DO, Gazarian A, Braillon PM. Estimation of stat- ure and length of limb segments in children and adolescents from whole-body dual-energy X-ray absorptiometry scans. Pe- diatr Radiol 2008;38:311-5.
16. Gryfe CI, Exton-Smith AN, Payne PR, Wheeler EF. Pattern of development of bone in childhood and adolescence. Lancet 1971;1:523-6.
17. Himes JH, Yarbrough C, Martorell R. Estimation of stature in children from radiographically determined metacarpal length. J Forensic Sci 1977;22:452-5.
18. Karaman AG, Teke HY, Günay I, Doǧan B, Bilge Y. Height esti- mation using anthropometric measurements on X-rays of wrist and metacarpal bones. Internet J Biol Anthropol 2008;2:1.
19. Moro C, Štromberga Z, Raikos A, Stirling A. The effectiveness of virtual and augmented reality in health sciences and medical anatomy. Anat Sci Educ 2017;10:549-59.
20. Malcolm LA. Growth and development in New Guinea: a study of the Bundi people of the Madang district. Madang: Institute of Human Biology of Papua and New Guinea; 1970.
21. Maddocks I. Pari Hanua : an appreciation of the traditional, co- lonial and modern life of a Papuan village, inspired by 50 years of contact and 6 years of residence. Papua New Guinea: Univer- sity of Papua New Guinea Press and Bookshop; 2012.
22. White TD, Black MT, Folkens PA. Human osteology. 3rd ed.
Burlington, MA: Elsevier Science; 2011.
23. Haiter-Neto F, Kurita LM, Menezes AV, Casanova MS. Skeletal age assessment: a comparison of 3 methods. Am J Orthod Den- tofacial Orthop 2006;130:435.e15-20.
24. Schneider CA, Rasband WS, Eliceiri KW. NIH Image to ImageJ:
25 years of image analysis. Nat Methods 2012;9:671-5.
25. Abdel-Malek AK, Ahmed AM, el-Sharkawi SA, el-Hamid NA.
Prediction of stature from hand measurements. Forensic Sci Int 1990;46:181-7.
26. Allbrook D. The estimation of stature in British and East African males: based on tibial and ulnar bone lengths. J Forensic Med 1961;8:15-28.
27. Genoves S. Proportionality of the long bones and their relation to stature among Mesoamericans. Am J Phys Anthropol 1967;
26:67-77.
28. Macgregor S, Cornes BK, Martin NG, Visscher PM. Bias, preci- sion and heritability of self-reported and clinically measured height in Australian twins. Hum Genet 2006;120:571-80.
29. Perola M, Sammalisto S, Hiekkalinna T, Martin NG, Visscher PM, Montgomery GW, Benyamin B, Harris JR, Boomsma D, Willemsen G, Hottenga JJ, Christensen K, Kyvik KO, Sørensen TI, Pedersen NL, Magnusson PK, Spector TD, Widen E, Sil- ventoinen K, Kaprio J, Palotie A, Peltonen L; GenomEUtwin Project. Combined genome scans for body stature in 6,602 Eu- ropean twins: evidence for common Caucasian loci. PLoS Genet 2007;3:e97.
30. Silventoinen K, Sammalisto S, Perola M, Boomsma DI, Cornes BK, Davis C, Dunkel L, De Lange M, Harris JR, Hjelmborg JV, Luciano M, Martin NG, Mortensen J, Nisticò L, Pedersen NL, Skytthe A, Spector TD, Stazi MA, Willemsen G, Kaprio J. Heri-
tability of adult body height: a comparative study of twin cohorts in eight countries. Twin Res 2003;6:399-408.
31. McEvoy BP, Visscher PM. Genetics of human height. Econ Hum Biol 2009;7:294-306.
32. Delemarre-van de Waal HA. Environmental factors influenc- ing growth and pubertal development. Environ Health Perspect 1993;101 Suppl 2:39-44.
33. Wilcox AJ. On the importance‒and the unimportance‒of birth- weight. Int J Epidemiol 2001;30:1233-41.
34. Tanner JM. Growth as a measure of the nutritional and hygienic status of a population. Horm Res 1992;38 Suppl 1:106-15.
35. Davey Smith G, Hart C, Upton M, Hole D, Gillis C, Watt G, Hawthorne V. Height and risk of death among men and women:
aetiological implications of associations with cardiorespiratory disease and cancer mortality. J Epidemiol Community Health 2000;54:97-103.
36. Gunnell D, Okasha M, Smith GD, Oliver SE, Sandhu J, Holly JM.
Height, leg length, and cancer risk: a systematic review. Epide- miol Rev 2001;23:313-42.
37. Jousilahti P, Tuomilehto J, Vartiainen E, Eriksson J, Puska P. Re- lation of adult height to cause-specific and total mortality: a pro- spective follow-up study of 31,199 middle-aged men and women in Finland. Am J Epidemiol 2000;151:1112-20.
38. Langenberg C, Shipley MJ, Batty GD, Marmot MG. Adult socio- economic position and the association between height and coro- nary heart disease mortality: findings from 33 years of follow-up in the Whitehall Study. Am J Public Health 2005;95:628-32.
39. Lawlor DA, Ebrahim S, Davey Smith G. The association between components of adult height and Type II diabetes and insulin re- sistance: British Women's Heart and Health Study. Diabetologia 2002;45:1097-106.
40. Lawlor DA, Taylor M, Davey Smith G, Gunnell D, Ebrahim S.
Associations of components of adult height with coronary heart disease in postmenopausal women: the British women's heart and health study. Heart 2004;90:745-9.
41. Tanner JM, Davies PS. Clinical longitudinal standards for height and height velocity for North American children. J Pediatr 1985;
107:317-29.
42. Victora CG, Adair L, Fall C, Hallal PC, Martorell R, Richter L, Sachdev HS; Maternal and Child Undernutrition. Maternal and child undernutrition: consequences for adult health and human capital. Lancet 2008;371:340-57.
43. Black RE, Allen LH, Bhutta ZA, Caulfield LE, de Onis M, Ez- zati M, Mathers C, Rivera J; Maternal and Child Undernutrition Study Group. Maternal and child undernutrition: global and re- gional exposures and health consequences. Lancet 2008;371:243- 60.
44. Sinno D, Charafeddine L, Mikati M. Enhancing early child de- velopment: a handbook for clinicians. New York: Springer New York; 2012.
45. Grantham-McGregor SM, Powell CA, Walker SP, Himes JH. Nu- tritional supplementation, psychosocial stimulation, and mental development of stunted children: the Jamaican Study. Lancet 1991;338:1-5.
46. Godfrey K, Robinson S, Barker DJ, Osmond C, Cox V. Maternal nutrition in early and late pregnancy in relation to placental and fetal growth. BMJ 1996;312:410-4.
47. Brantsæter AL, Birgisdottir BE, Meltzer HM, Kvalem HE, Alex- ander J, Magnus P, Haugen M. Maternal seafood consumption and infant birth weight, length and head circumference in the Norwegian Mother and Child Cohort Study. Br J Nutr 2012;107:
436-44.
48. Leonard WR. Nutritional determinants of high-altitude growth in Nunoa, Peru. Am J Phys Anthropol 1989;80:341-52.