Vol. 19, No. 2 pp. 561-574, 2018
지리적 가중 회귀를 이용한
대사증후군 유병률의 지역별 변이에 관한 연구 및 적용 방안
선미옥1, 강성홍2, 전진호3*
1유한대학교 U-보건의료행정과, 2인제대학교 보건행정학과, 3인제대학교 의과대학 예방의학교실
A Study on Variation and Application of Metabolic Syndrome Prevalence using Geographically Weighted Regression
Mi Ohk Suhn
1, Sung Hong Kang
2, Jin-Ho Chun
3*1
Department of U-Health Services Administration, Yuhan University
2
Department of Health Policy and management, Inje University
3
Department of Preventive Medicine, College of Medicine, Inje University
요 약 본 논문에서는 건강 불평등의 해소를 위하여 지리적 가중 회귀를 이용한 대사증후군 유병률의 지역별 변이 요인 및 관련 요인을 파악하고, 이를 통하여 지역의 효율적인 대사증후군 관리 사업 개발을 위한 적용방안을 마련하였다. 국민건강 보험공단 2015년 건강보험 통계연보 및 지역사회건강조사 등 기타 국가 기관 자료를 통하여 대사증후군 유병률과 사회경제 적 수준의 사회구조적 요인, 그리고 물리적 환경, 건강행태, 이환. 정신건강, 예방관리. 의료이용의 중재 요인 지표를 수집하 였다. 먼저 수집된 데이터를 바탕으로 대사증후군 유병률의 변이수준을 측정하는 지표인 EQ (Extremal Quotient)와 CV (Coefficient of Variations)를 이용하여 지역 간 변이가 존재함을 확인한 후, 공간적 이질성 및 의존성 등의 공간적 변이 고려 가 가능한 지리적 가중 회귀(Geographically Weighted Regression)를 이용하여 대사증후군 유병률의 지역 간 변이 관련 요인을 분석하였다. 지리적 가중 회귀 분석 결과 대사증후군 유병률의 수준에 따라 주요 요인의 크기와 관리의 우선순위가 다름을 알 수 있었으며, 향후 지역별 대사증후군 관리의 목표와 우선순위 설정을 통한 관리 사업의 효과를 증대시킬 수 있는 방안 마련이 가능함을 확인하였다.
Abstract In this study, regional variations and factors associated with prevalence of metabolic syndrome were grasped using GWR (geographically weighted regression) and methodologies for the efficient management of metabolic syndrome were then set up to resolve health inequalities. Based on the National Health Screening Statistical Yearbook published by the National Health Insurance Service (NHIS), community health survey (KCDC) and other governmental institutions, indicators of social structural and mediation factors related to the regional prevalence of metabolic syndrome were collected. First, the existence of indicators to measure variations in metabolic syndrome were confirmed with the collected data by calculating the EQ (extremal quotient) and CV (coefficient of variations).
The GWR, which is able to take spatial variations into consideration, was then adopted to analyze the factors of regional variations in metabolic syndrome. The GWR analysis revealed that severity and management of the main causes need to be prioritized in accordance with the prevalence of metabolic syndrome. Consequently, the order of priority in management of regional prevalence of metabolic syndrome was established, and plans that can increase the effectiveness of management of metabolic syndrome were confirmed to be feasible.
Keywords : Geographically weighted regression, Healthcare management, Metabolic syndrome, Regional variation, Simulation
*Corresponding Author : Jin-Ho Chun (Inje Univ.) Tel: +82-51-890-6735 email: [email protected]
Received January 26, 2018 Revised February 1, 2018 Accepted February 2, 2018 Published February 28, 2018
1. 서론
대사증후군은 생활습관병으로 심근경색이나 뇌졸중 의 위험인자인 비만, 고혈압, 당뇨, 고지혈증 등이 한사 람에게 동시다발적으로 발병하는 것을 의미하며[1], 대 사증후군의 유병은 일반적으로 복부비만, 높은 혈압, 높 은 혈당, 높은 중성 지방혈증, 낮은 HDL 콜레스테롤혈 증 등 대사증후군 위험요인 5가지 중 3가지 이상 해당하 는 경우로 정의한다[2].
우리나라의 대사증후군 이환률은 약 24.2~26.2%로 성인 인구 4명 중 1명이 대사증후군이다[3]. 건강보험심 사평가원의 대사증후군 관련 질환의 진료 추이 분석에 따르면 우리나라의 대사증후군 환자 수는 2010년 약 850만명에서 2014년 991만명으로 연평균 3.9% 증가하 고 있는 것으로 나타났으며, 대사증후군 진료비 또한 2010년 약 3조원에서 2014년 약 4조 7천억원으로 연평 균 6.2%로 증가하고 있는 것으로 조사되었다[4]. 따라서 우리나라의 대사증후군 관리를 위해서는 대사증후군 유 병에 영향을 미치는 관련 요인을 파악하고, 이를 기반으 로 생활행태 개선 등의 건강증진 사업을 수행할 필요가 있다.
대부분의 대사증후군 유병 요인에 관한 선행연구는 개인요인을 파악하는 연구였지만[5-7], 건강수준은 개인 의 건강행태 뿐 아니라 거주하는 지역의 건강행태, 물리 적 환경, 사회경제적 환경에 따라 변이가 존재한다. 국가 나 지역의 건강수준 향상을 위해서는 지역 간 건강차이 해소와 건강 불평등의 감소 또한 중요하다[8, 9]. 일찍부 터 건강불평등의 해소가 국가적 의제로 설정되었고, 이 의 해소를 위해 사회정의와 공평성의 실현이라는 관점에 서 포괄적인 사회정책적 접근을 하고 있는 서구선진국들 과 같이 국내에서도 건강불평등을 완화하기 위해서는 지 역사회의 특성을 반영할 수 있는 효과적인 정책의 개입 이 필요하다[10-13].
지역사회 중심의 효율적인 대사증후군 관리를 위해서 대사증후군 유병률의 지역 간 변이와 관련 요인을 파악 하고, 실질적으로 활용이 가능한 사업방안을 선정하는 것이 중요하다. 하지만 대사증후군은 그 위험성이 높고, 유병 환자가 계속 증가하는 질환임에도 불구하고, 유병 률에 대한 지역 간 변이요인에 대한 연구는 거의 없는 실정이다. 따라서 본 연구에서는 기존의 회귀분석이 고 려하지 못하는 지역의 공간적 변이의 측면을 고려하여
분석이 가능한 지리적 가중 회귀(Geographically Weighted Regression, GWR)를 이용하여 대사증후군 유 병률의 지역 간 변이와 관련 요인을 파악하고, 지역의 효 율적인 대사증후군 유병률 관리를 위한 사업방안 선정을 지원하고자 한다.
2. 연구 절차 및 분석 방법
2.1 연구 모형 수립
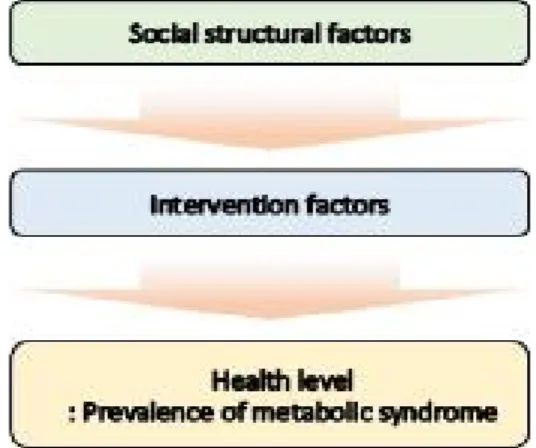
본 연구를 수행하는데 있어 먼저 대사증후군과 관련 질환 선행연구를 고찰하여 대사증후군 유병률의 지역간 변이 관련 요인을 사회구조적 요인과 중재요인으로 정의 하였으며[9, 14-21], 수집가능 여부를 고려하여 각 요인 의 세부지표를 선정하였다.
Fig. 1. Research model
2.2 자료수집
2.2.1 지역별 대사증후군 유병률
지역(시·군·구)별 대사증후군 유병률에 대한 문헌고찰 결과 현재 우리나라에서 지역(시·군·구) 별 대사증후군 유병률을 산출하고 공개하는 자료는 국민건강보험공단 의 건강검진 통계 연보 자료가 유일한 것으로 나타났으 며, 건강검진 수검자의 생활습관 개선 및 질병 예방 효과 를 위해 지역 (시·군·구) 별 건강검진 수검자의 대사증후 군 위험요인 보유개수별 현황이 수록되어있다. 이에 본 논문에서는 국민건강보험공단의 2015년 건강검진 통계 연보 및 의료급여 건강검진 통계연보에서 지역 (시·군·
Parameter Description of Parameter Source of data
Rate of Metabolic Syndrome
Prevalence
Numerator: The number of examinees who show at least 3 out of the 5 metabolic syndrome factors below out of those who have undergone a health check provided by National Health Insurance or medical care.
1) Abdominal obesity 2) High blood pressure 3) High blood sugar
4) Lipidemia with high neutral fats 5) Hypercholesteremia with low HDL
Denominator: The number of people who have undergone a health check provided by National Health Insurance or medical care
National Health Screening Statistical Yearbook Published by National Health Insurance Service (NHIS), and 2015 Medical Care
Health Screening Yearbook Table 1. Definition of Metabolic Syndrome Prevalence Index
Domain Variation Factor Description of Parameter Source of data
Socioecon-o mic Standard
Rate of senior population
Numerator: The number of seniors aged 65 or older
Denominator: Total population in the region
2015 Population Census, Statistics Korea
Rate of people with the level of education at high
school or lower
Numerator: The number of those with the level of education at high school or lower out of population between aged 30 and 64 Denominator: The number of people in the region between aged 30 and 64
Rate of Economic participation
Rate of wage workers
Numerator: The number of wage workers who are hired by other person or a company and collect salaries.
Denominator: The number of workers with jobs.
*It uses standardization rate, which applies the standard population by sex and age.
Previous studies by Korea Centers for Disease Control and Prevention
(KCDC, 2016))
Rate of white-color
workers
Numerator: The number of white-color workers.
Denominator: The number of survey respondents.
*It uses standardization rate, which applies the standard population by sex and age.
Previous studies by KCDC (2016)
Health insurance premium per person
Numerator: Total health insurance premium in the region.
Denominator: Medical care-covered population in the region.
2015 Health Insurance Statistics Yearbook, NHIS
Socioecon-o mic Standard (Regional factor)
Rate of basic livelihood security beneficiaries
Numerator: The number of current basic livelihood security beneficiaries (recipients of livelihood program or poor people).
Denominator: The number of survey respondents.
*It uses standardization rate, which applies standard population by sex and age.
Previous studies by KCDC (2016)
Financial self-sufficiency Numerator: (Local tax + non-tax revenue)*100 Denominator: Local government budget size
2015 Local Governments’ Integrated Finance Overview, Ministry of Government Administration and Home
Affairs (MOGAHA)
Portion of social security
Rate of welfare budget in
general accounts
Numerator: Regional spending in social security.
Denominator: Regional spending in social development.
2015 Local Finance Yearbook, MOGAHA Table 2. Definition of Socioeconomic Level Index of Social Structural Factors
구)의 대사증후군 유병률 자료를 수집하였다.
2.2.2 대사증후군 유병률의 지역 간 변이 관련 요인 대사증후군 유병률의 지역 간 변이 관련 요인을 수집
하기 위해 통계청의 2015년 인구총조사 자료, 국민건강 보험공단의 2015년 건강보험 통계 연보, 2015년 건강검 진 통계연보 및 의료급여 건강검진 통계연보, 질병관리
Domain Variation Factor Description of Parameter Source of data
Physical Environment
Park area per person Numerator: Park area
Denominator: Population on resident registration
Previous studies by KCDC (2016) Land area for sports per
person
Numerator: Land area for sports
Denominator: Population on resident registration Number of sports facilities
per 1,000 persons
Numerator: The number of sports facilities * 1,000 Denominator: Population on resident registration Number of franchise
convenient stores per 1,000 persons
Numerator: The number of franchise convenient stores * 1,000 Denominator: Population on resident registration
Health Condition
Current smoking rate
Numerator: The number of current smokers who have smoked minimum 5 packs of tobacco so far * 100
Denominator: The number of eligible respondents
* It uses standardization rate of local community health survey.
2015 Local Community Health
Survey, KCDC High-risk drinking rate
Numerator: The number of persons who responded they have drunk minimum 7 glasses at a sitting for men or minimum 5 glasses at a sitting for women at least twice a week over the past year * 100
Denominator: The number of persons who have drunk over the past year
* It uses standardization rate of local community health survey.
Rate of fulfilled walking practice
Numerator: The number of persons who have walked minimum 30 minutes a day for minimum 5 days of the past week * 100 Denominator: The number of eligible respondents
* It uses standardization rate of local community health survey.
Rate of attempting weight reduction
Numerator: The number of persons who have tried to reduce or maintain weight over the past year * 100
Denominator: The number of eligible respondents
* It uses standardization rate of local community health survey.
Rate of preventive population on skipping breakfast
Numerator: The number of persons who said they have breakfast 5 to 7 days per week * 100
Denominator: The number of eligible respondents
*It uses standardization rate, which applies standard population by sex and age.
Previous studies by KCDC (2016) Rate of preference on
low-sodium food
Numerator: The number of persons who said they “have a bland diet” or “have a very bland diet” or who said they “never add more” salt or soy sauce when eating cooked food or “do not dip in soy sauce” pancake, fries etc. * 100
Denominator: The number of eligible respondents
*It uses standardization rate, which applies standard population by sex and age.
Rate of established food security
Numerator: The number of persons who said their family had sufficient, wanted amounts of diverse foods, or their family did not have various foods while having sufficient amounts of food * 100
Denominator: Population on resident registration
*It uses standardization rate, which applies standard population by sex and age.
Rate of awareness on nutrition information
Numerator: The number of persons who are aware of nutrition information * 100
Denominator: The number of eligible respondents
*It uses standardization rate, which applies standard population by sex and age.
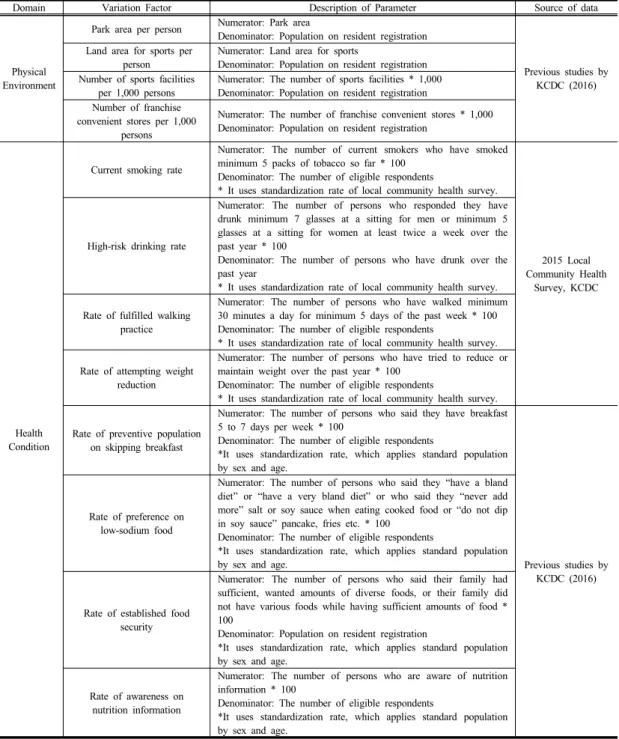
Table 3. Definition of Physical Environment Indicators of Intervention Factors - Physical Environment, Health
Behavior
본부의 2015년 지역사회건강조사 자료, 질병관리본부 (2016) 선행연구 자료, 2015년 행정자치부의 지방자치 단체 통합재정 개요, 2015년 행정자치부의 지방재정연 감, 한국토지주택공사의 도시계획현황, 통계청의 전국사
업체조사 등을 수집하였다.
2.3 변수 정의 2.3.1 연구대상 지역
Domain Variation factor Description of Parameter Source of data
Morbidity
Rate of persons diagnosed with arthritis by a
doctor
Numerator: The number of persons who are disgnosed with arthritis by a doctor * 100
Denominator: The number of eligible respondents aged 50 or older
* It uses standardization rate of local community health survey.
2015 Local Community Health Survey, KCDC
Mental Health
Rate of people's awareness of
stress
Numerator: The number of persons who said they “ feel extreme amount of stress” or “much stress” in daily life * 100
Denominator: The number of eligible respondents
* It uses standardization rate of local community health survey.
2015 Local Community Health Survey, KCDC Rate of people
who experience depression
Numerator: The number of persons who experienced sorrow or despair that disturbed their daily life for at least 2 straight weeks over the past year
Denominator: The number of eligible respondents
* It uses standardization rate of local community health survey.
Preventive Care (Personal
Factor)
Rate of persons who get nutrition
education
Numerator: The number of persons who received nutrition education or counseling at least once over the past year * 100 Denominator: The number of eligible respondents
*It uses standardization rate, which applies standard population by sex and age.
Previous studies by KCDC (2016) Rate of persons
who receive education in high
blood pressure care
Numerator: The number of persons diagnosed with high blood pressure by a doctor who received education in high blood pressure care * 100
Denominator: The number of persons aged 30 or older who are diagnosed with high blood pressure by a doctor
*It uses standardization rate, which applies standard population by sex and age.
Rate of persons who get education
in diabetes care
Numerator: The number of persons diagnosed with diabetes by a doctor who received education in diabetes care * 100
Denominator: The number of persons aged 30 or older who are diagnosed with diabetes by a doctor
*It uses standardization rate, which applies standard population by sex and age.
Rate of persons who get education
in arthritis care
Numerator: The number of persons diagnosed with arthritis by a doctor who received education in arthritis care * 100
Denominator: The number of persons aged 30 or older who are diagnosed with arthritis by a doctor
*It uses standardization rate, which applies standard population by sex and age.
Rate of persons who get health
screening
Numerator: The number of persons who received the 1st national health screening * 100
Denominator: The number of persons who are eligible for the 1st national health screening
Use of Medical Care (Personal
Factor)
Rate of persons who do not get necessary health
care
Numerator: The number of persons who did not get necessary medical services over the past year * 100
Denominator: The number of eligible respondents
* It uses standardization rate of local community health survey.
2015 Local Community Health Survey, KCDC Table 4. Definition of Physical Environment Indicators of Intervention Factors - Morbidity, Mental Health,
Preventive Care, Use of Medical Care
본 연구에서는 대사증후군 유병률의 지역 간 변이 및 관련 요인 분석을 수행하고자 2015년도 시․군․구 단 위의 자료수집 가능여부에 따라 연구대상지역을 시․
군․구 단위의 252개의 소규모 지역으로 설정하였다.
2.3.2 종속변수: 대사증후군 유병률
Table 1과 같이 국민건강보험공단의 2015년 건강검
진 통계 연보 및 의료급여 건강검진 통계연보 자료를 수 집하여 지역 (시·군·구)별 건강보험 및 의료급여 건강검 진 수검자 중 대사증후군 위험요인 5가지 중 해당 요인 이 3∼5개인 수검자 수 비율을 지역 (시·군·구)의 대사증 후군 유병률로 정의하였다. 대사증후군 유병률의 지표정 의의 자세한 사항은 다음 Table 2-4에 나타나 있다.
2.3.3 독립변수
본 연구에서 수집한 사회구조적 요인의 사회경제적 수준 지표에는 노인인구비율, 고졸미만 교육수준 비율, 경제활동 비율을 의미하는 임금근로자 비율, 사무종사자 비율, 지역 일인당 건강보험료, 기초생활수급자 비율, 재 정자립도, 사회보장 비중을 의미하는 일반회계 중 복지 예산 비율 등이 있으며, 수집된 지표의 지표정의는 Table 2와 같다.
중재 요인의 물리적 환경 지표에는 지역 인구 일인당 공원면적, 지역 인구 일인당 체육용지면적, 지역 인구 천 명당 체육시설 수, 지역 인구 천명당 체인화 편의점 수 등이 있으며, 건강행태 지표에는 현재흡연율, 고위험음 주율, 걷기실천율, 체중조절시도율, 아침결식예방인구 비율, 저염선호율, 식품안정성확보율, 영양표시 인지율 등이 있으며, 수집된 지표의 지표정의는 다음과 Table 3 과 같다.
중재 요인의 이환 지표에는 관절염 의사진단율 등이, 정신건강 지표에는 스트레스 인지율, 우울감 경험률 등 이, 그리고 예방관리 지표에는 영양교육상담율, 고혈압 관리교육 이수율, 당뇨병관리교육 이수율, 관절염관리교 육 이수율, 건강검진 수검률, 의료이용 지표에는 필요의 료서비스 미치료율 등이 있으며, 수집된 지표의 지표정 의는 다음 Table 4와 같다.
2.4 분석 방법
자료 분석은 IBM의 SPSS Statistics 23 프로그램과 Arc GIS의 Arc Map 10.5 프로그램을 이용하여 분석하 였다. 구체적인 분석 방법은 다음과 같다.
먼저 대사증후군 유병률의 지역 간 변이수준을 파악 하기 기초통계를 실시한 후 변이수준을 측정하는 대표적 인 지표인 EQ (Extremal Quotient)와 CV (Coefficient of Variation)를 산출하였다. 독립변수로 사용된 대사증 후군 유병률의 지역 간 변이 관련 요인 변수의 기초통계 작성을 위해 기술통계를 실시하였으며, 사회구조적 요 인, 중재 요인의 각 세부지표와 대사증후군 유병률 간에 상관관계가 있는지 여부를 검증하기 위해 상관분석을 실 시하였다.
지리적 가중 회귀분석방법을 이용하여 지역의 대사증 후군 유병률에 영향을 미치는 요인을 파악하였다. 산출 된 지리적 가중회귀모형에 대해 공간적 의존성이 제거되 었는지 판단하기 위해 공간적 자기상관의 정도를 나타내
는 Moran (I) index를 산출하여 검증하였다. 지리적 가 중회귀분석에서 지리적 가중을 위한 커널 (kernel) 함수 의 유형은 연구지역 내에서 관찰 사례의 위치가 불규칙 하게 분포함을 가정하여 ‘가변 (adaptive) 방식’을 선택 하였다.
마지막으로 지역의 대사증후군 유병률 관리를 위한 사업 방안 선정 지원을 위해 지리적 가중 회귀 결과를 이용하여 지역별 대사증후군 유병률 관리의 우선순위를 선정하였으며, 지역의 보건사업 담당자들이 손쉽게 활용 할 수 있도록 엑셀을 이용하여 지역별 대사증후군 유병 률 관리 시뮬레이션 도구를 개발하였으며, 개발된 시뮬 레이션 도구를 이용하여 대사증후군 유병률이 가장 높은 1개 시군구에 대해 시뮬레이션 결과를 제시하였다.
3. 연구 결과
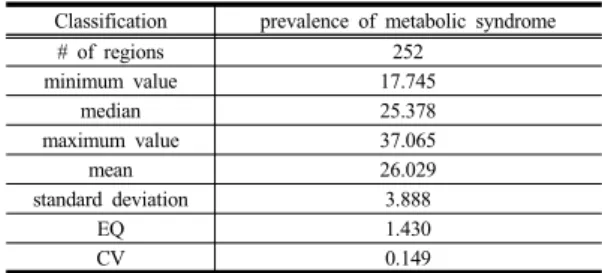
3.1 대사증후군 유병률의 지역 간 변이 3.1.1 대사증후군 유병률의 지역 간 변이수준 대사증후군 유병률의 지역 간 변이수준을 파악하기 위해 기술통계를 실시한 결과 아래 Table 5와 같이 대사 증후군 유병률은 전국적으로 17.745 %부터 최대 37.065
% 까지 분포되어 있으며, 평균은 26.029 %로 조사되었 다. 변이수준을 측정을 위하여 EQ (Extremal Quotient) 와 CV (Coefficient of Variations) 지표를 이용하였고, 최대값과 최소값의 비를 나타내는 EQ는 1.430, 표준편 차와 평균의 비를 나타내는 CV는 0.149로 조사되어 대 사증후군 유병율에 지역 간 변이가 존재하는 것을 확인 할 수 있었다.
Classification prevalence of metabolic syndrome
# of regions 252
minimum value 17.745
median 25.378
maximum value 37.065
mean 26.029
standard deviation 3.888
EQ 1.430
CV 0.149
Table 5.
Interregional variation of prevalence of metabolic syndrome
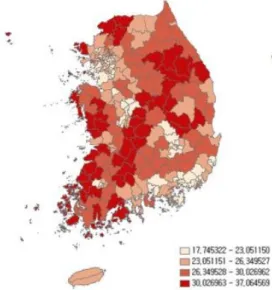
3.1.2 대사증후군 유병률의 시군구별 분포 사분위를 기준으로 4개 군으로 나누어 대사증후군 유
병률의 시군구별 분포를 파악한 결과 Fig. 2와 같이 구 분이 가능하였다. 대사증후군 유병률이 가장 낮은 (1분 위 : 17.745 ∼ 23.051) 시군구에는 경남 창원시 성산구, 서울 서초구, 경기 과천시, 경기 수원시영통구 등이 포함 되어 있었으며, 대사증후군 유병률이 가장 높은 (4분위 : 30.027 ∼ 37.065) 시군구에는 강원 영월군, 경북 청도 군, 전남 해남군, 경북 영주시, 충남 당진시, 경북 영덕군 등이 포함되어 있었다. 대사증후군 유병률이 낮은 지역 에는 대체로 대도시가 많이 속해 있었고, 높은 지역에는 소도시, 군 또는 농촌지역이 많이 속해있는 것을 알 수 있었다.
Fig. 2. Regional distribution of metabolic syndrome
prevalence
3.2 대사증후군 유병률의 지역 간 변이 관련 요인의 기초통계
3.2.1 사회구조적 요인에 대한 기초통계
본 연구에서 정의한 대사증후군 유병률의 지역 간 변 이의 관련 요인 변수인 사회구조적 요인에 대한 기초통계 를 파악하기 위해 기술통계를 실시하여 각 변수별 평균값 을 살펴본 결과 사회경제적 수준에서 노인인구 비율 18.1%, 고졸미만 교육수준 비율 19.4%, 임금근로자 비율 70.0%, 사무종사자 비율 11.6%, 인구 일인당 건강보험료 727.5천원, 기초생활수급자 비율 2.8%, 재정자립도 27.8%, 일반회계 중 복지예산 비율 32.2%로 조사되었다.
3.2.2 중재 요인에 대한 기초통계
본 연구에서 정의한 대사증후군 유병률의 지역 간 변 이의 관련 요인 변수인 중재 요인에서 물리적 환경, 건강 행태, 예방관리 및 의료이용에 대한 기초통계를 파악하 기 위해 기술통계를 실시하여 각 변수별 평균값을 살펴 보았다.
중재요인 중 물리적 환경 부분에서 인구 일인당 공원 면적 23.3㎡, 인구 일인당 체육면적 17.5㎡, 인구 천명당 체육시설 수 0.04개, 인구 천 명 당 체인화 편의점 수 0.42개로 조사되었다. 건강행태 부분에서 현재흡연율 22.1%, 고위험음주율 19.1%, 걷기 실천율 39.0%, 체중 조절시도율 55.8%였으며, 아침결식예방 인구비율 67.4%, 저염선호율 40.5%, 식품안정성확보율 94.9%, 영양표시 인지율 52.2%로 나타났다. 이환 부분에서는 관절염 의 사진단율 20.1%였으며, 정신건강 부분에서 스트레스 인 지율 27.8%, 우울감 경험률 6.1%로 조사되었다. 마지막 으로 예방관리 부분에서 영양교육 상담율 3.2%, 고혈압 관리교육 이수율 23.6%, 당뇨병관리교육 이수율 31.3%, 관절염관리교육 이수율 22.6%, 건강검진 수검율 75.5%
로 나타났으며, 의료이용 부분에서 필요의료서비스 미치 료율 12.3%로 조사되었다.
3.3 대사증후군 유병률의 지역 간 변이 관련 요인
3.3.1 사회구조적 요인과의 상관관계
대사증후군 유병률과 사회구조적 요인의 상관관계를 파악하기 위해 상관분석을 실시한 결과 대사증후군 유병 률과 통계적으로 유의한(p<0.05) 양의 상관관계에 있는 지표는 노인인구 비율(0.815), 고졸미만 교육수준 비율 (0.841), 기초생활수급자 비율(0.377)로 나타났다. 즉, 노 인인구비율, 고졸미만 교육수준 비율, 기초생활수급자 비율이 높은 지역일수록 대사증후군 유병률이 높았다.
반면 대사증후군 유병률과 통계적으로 유의한(p<0.05) 음의 상관관계에 있는 지표는 임근근로자 비율(-0.712), 사무종사자 비율(-0.425), 인구 일인당 건강보험료 (-0.760), 재정자립도(-0.608), 일반회계 중 복지예산 비 율(-0.612)로 나타났다. 즉, 임근근로자 비율, 사무종사 자 비율이 낮으며, 인구 일인당 건강보험료, 재정자립도, 일반회계 중 복지예산 비율이 낮은 지역일수록 대사증후 군 유병률이 높았다.
Independent variable Regression coefficient
mean minimum value median maximum value
Intercept 22.427 21.759 22.409 22.859
Rate of people with the level of education at high school or lower 0.344 0.318 0.342 0.371
Rate of welfare budget -0.027 -0.038 -0.028 -0.014
Number of sports facilities per 1,000 persons -2.365 -6.560 -2.418 1.287
High-risk drinking rate 0.041 0.013 0.044 0.065
Rate of preference on low-sodium food -0.071 -0.076 -0.072 -0.062
Region determination factor 0.733 0.694 0.732 0.767
R-square / Adj R-square 0.756 / 0.749
Moran's (I) Index / Moran's (I) Index p value 0.070 / 0.062
Table 8. Factors affecting the prevalence of metabolic syndrome – Geographically Weighted Regression Classification Correlation
coefficient p – value Rate of senior population 0.815 0.000 Rate of people with the level of education
at high school or lower 0.841 0.000 Rate of wage workers -0.712 0.000 Rate of white-color workers -0.425 0.000 Health insurance premium per person -0.760 0.000 Rate of basic livelihood security beneficiaries 0.377 0.000 Financial self-sufficiency -0.608 0.000 Rate of welfare budget in general accounts -0.612 0.000 Table 6. Correlation between prevalence of metabolic
syndrome and social structural factors
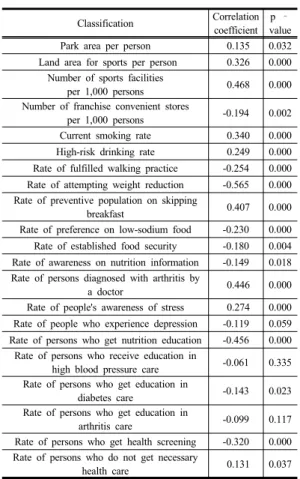
3.3.2 중재 요인과의 상관관계
대사증후군 유병률과 중재 요인의 상관관계를 파악하 기 위해 상관분석을 실시한 결과 대사증후군 유병률과 통계적으로 유의한(p<0.05) 양의 상관관계에 있는 지표 는 인구 일인당 공원면적(0.135), 인구 일인당 체육면적 (0.326), 인구 천명당 체육시설 수(0.468), 현재흡연율 (0.340), 고위험음주율(0.249), 아침결식예방 인구 비율 (0.407), 관절염 의사진단율(0.446), 스트레스 인지율 (0.274), 필요의료서비스 미치료율(0.131)로 나타났다.
즉, 인구 일인당 공원면적, 인구 일인당 체육면적, 인구 천명당 체육시설 수 높거나 현재흡연율, 고위험음주율, 아침결식예방 인구 비율, 관절염 의사진단율, 스트레스 인지율, 필요의료서비스 미치료율이 높은 지역일수록 대 사증후군 유병률이 높았다.
반면 대사증후군 유병률과 통계적으로 유의한(p<0.05) 음의 상관관계에 있는 지표는 인구 천명당 체인화 편의 점 수(-0.194), 걷기실천율(-0.254), 체중조절시도율(-0.565), 저염선호율(-0.230), 식품안정성확보율(-0.180), 영양표시 인지율(-0.149), 영양교육 상담율(-0.456), 당뇨병관리교 육 이수율(-0.143), 건강검진 수검율(-0.320)로 나타났다.
즉, 고, 인구 천명당 체인화 편의점 수가 적거나 걷기실 천율, 체중조절시도율이 낮고, 저염선호율, 식품안정성 확보율, 영양표시 인지율이 낮으며, 영양교육 상담율, 당 뇨병관리교육 이수율, 건강검진 수검율이 낮은 지역일수 록 대사증후군 유병률이 높았다.
Classification Correlation coefficient
p – value Park area per person 0.135 0.032 Land area for sports per person 0.326 0.000
Number of sports facilities
per 1,000 persons 0.468 0.000 Number of franchise convenient stores
per 1,000 persons -0.194 0.002
Current smoking rate 0.340 0.000 High-risk drinking rate 0.249 0.000 Rate of fulfilled walking practice -0.254 0.000 Rate of attempting weight reduction -0.565 0.000 Rate of preventive population on skipping
breakfast 0.407 0.000
Rate of preference on low-sodium food -0.230 0.000 Rate of established food security -0.180 0.004 Rate of awareness on nutrition information -0.149 0.018 Rate of persons diagnosed with arthritis by
a doctor 0.446 0.000
Rate of people's awareness of stress 0.274 0.000 Rate of people who experience depression -0.119 0.059 Rate of persons who get nutrition education -0.456 0.000
Rate of persons who receive education in
high blood pressure care -0.061 0.335 Rate of persons who get education in
diabetes care -0.143 0.023
Rate of persons who get education in
arthritis care -0.099 0.117
Rate of persons who get health screening -0.320 0.000 Rate of persons who do not get necessary
health care 0.131 0.037
Table 7. Correlation between prevalence of metabolic
syndrome and intervention factors
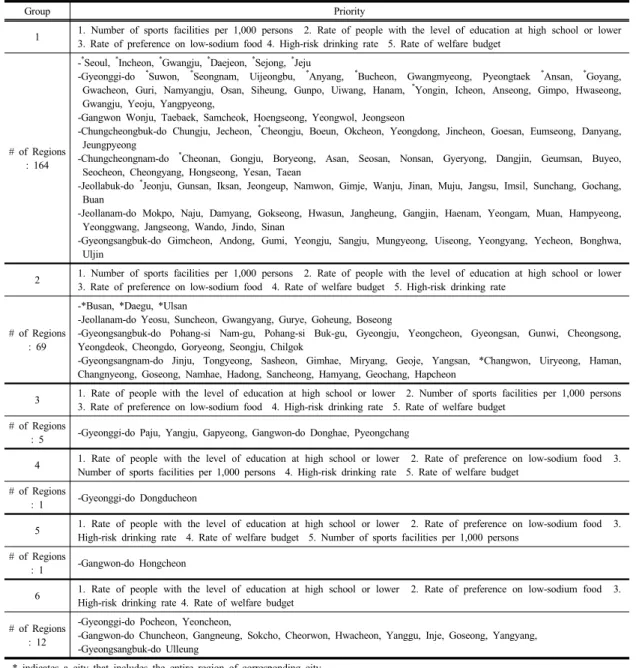
Group Priority
1 1. Number of sports facilities per 1,000 persons 2. Rate of people with the level of education at high school or lower 3. Rate of preference on low-sodium food 4. High-risk drinking rate 5. Rate of welfare budget
# of Regions : 164
-*Seoul, *Incheon, *Gwangju, *Daejeon, *Sejong, *Jeju
-Gyeonggi-do *Suwon, *Seongnam, Uijeongbu, *Anyang, *Bucheon, Gwangmyeong, Pyeongtaek *Ansan, *Goyang, Gwacheon, Guri, Namyangju, Osan, Siheung, Gunpo, Uiwang, Hanam, *Yongin, Icheon, Anseong, Gimpo, Hwaseong, Gwangju, Yeoju, Yangpyeong,
-Gangwon Wonju, Taebaek, Samcheok, Hoengseong, Yeongwol, Jeongseon
-Chungcheongbuk-do Chungju, Jecheon, *Cheongju, Boeun, Okcheon, Yeongdong, Jincheon, Goesan, Eumseong, Danyang, Jeungpyeong
-Chungcheongnam-do *Cheonan, Gongju, Boryeong, Asan, Seosan, Nonsan, Gyeryong, Dangjin, Geumsan, Buyeo, Seocheon, Cheongyang, Hongseong, Yesan, Taean
-Jeollabuk-do *Jeonju, Gunsan, Iksan, Jeongeup, Namwon, Gimje, Wanju, Jinan, Muju, Jangsu, Imsil, Sunchang, Gochang, Buan
-Jeollanam-do Mokpo, Naju, Damyang, Gokseong, Hwasun, Jangheung, Gangjin, Haenam, Yeongam, Muan, Hampyeong, Yeonggwang, Jangseong, Wando, Jindo, Sinan
-Gyeongsangbuk-do Gimcheon, Andong, Gumi, Yeongju, Sangju, Mungyeong, Uiseong, Yeongyang, Yecheon, Bonghwa, Uljin
2 1. Number of sports facilities per 1,000 persons 2. Rate of people with the level of education at high school or lower 3. Rate of preference on low-sodium food 4. Rate of welfare budget 5. High-risk drinking rate
# of Regions : 69
-*Busan, *Daegu, *Ulsan
-Jeollanam-do Yeosu, Suncheon, Gwangyang, Gurye, Goheung, Boseong
-Gyeongsangbuk-do Pohang-si Nam-gu, Pohang-si Buk-gu, Gyeongju, Yeongcheon, Gyeongsan, Gunwi, Cheongsong, Yeongdeok, Cheongdo, Goryeong, Seongju, Chilgok
-Gyeongsangnam-do Jinju, Tongyeong, Sasheon, Gimhae, Miryang, Geoje, Yangsan, *Changwon, Uiryeong, Haman, Changnyeong, Goseong, Namhae, Hadong, Sancheong, Hamyang, Geochang, Hapcheon
3 1. Rate of people with the level of education at high school or lower 2. Number of sports facilities per 1,000 persons 3. Rate of preference on low-sodium food 4. High-risk drinking rate 5. Rate of welfare budget
# of Regions
: 5 -Gyeonggi-do Paju, Yangju, Gapyeong, Gangwon-do Donghae, Pyeongchang
4 1. Rate of people with the level of education at high school or lower 2. Rate of preference on low-sodium food 3.
Number of sports facilities per 1,000 persons 4. High-risk drinking rate 5. Rate of welfare budget
# of Regions
: 1 -Gyeonggi-do Dongducheon
5 1. Rate of people with the level of education at high school or lower 2. Rate of preference on low-sodium food 3.
High-risk drinking rate 4. Rate of welfare budget 5. Number of sports facilities per 1,000 persons
# of Regions
: 1 -Gangwon-do Hongcheon
6 1. Rate of people with the level of education at high school or lower 2. Rate of preference on low-sodium food 3.
High-risk drinking rate 4. Rate of welfare budget
# of Regions : 12
-Gyeonggi-do Pocheon, Yeoncheon,
-Gangwon-do Chuncheon, Gangneung, Sokcho, Cheorwon, Hwacheon, Yanggu, Inje, Goseong, Yangyang, -Gyeongsangbuk-do Ulleung
* indicates a city that includes the entire region of corresponding city.
Table 9. Priority for regional management of metabolic syndrome prevalence
3.4 대사증후군 유병률의 지역 간 변이 관련 요인 분석
사회경제적 수준(8개), 물리적 환경(4개), 건강행태(8 개), 이환(1개), 정신건강(2개), 예방(5개), 의료이용(1개) 요인이 대사증후군 유병률에 미치는 영향을 파악하기 위 해 지리적 가중 회귀분석을 이용하여 분석한 결과 고졸 미만 교육수준 비율, 복지예산 비율, 인구 천명당 체육시 설 수, 고위험음주율, 저염선호율 변수로 구성된 총 252
개의 지역별 회귀모형이 산출되었다.
Table 8과 같이 산출된 지리적 가중회귀모형의 전반 적인 설명력인 결정계수 R-square는 75.6%였으며, 지역 별로 69.4%에서 76.7%까지 분포하는 것으로 나타났다.
공간적 자기상관의 정도를 보여주는 Moran's 지수의 p 값 역시 0.05보다 큼에 따라 공간적 의존성이 제거된 유 의한 모형임을 알 수 있었다.
지리적 가중회귀분석 결과를 통하여 고졸미만 교육수
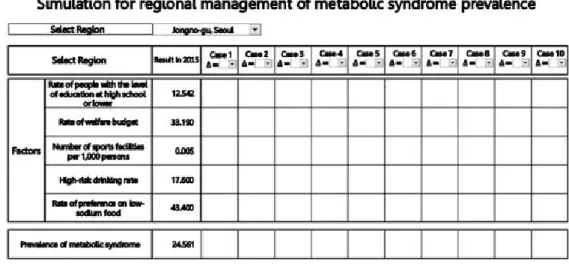
Fig. 3. Developed simulation tool for management of metabolic syndrome prevalence
Classification Results in 2015 Case 1
(∆= +1%)
Case 2 (∆= +5%)
Case 3 (∆= +10%)
Factors
Rate of people with the level of education at high
school or lower 30.872 30.563 29.328 27.476
Rate of welfare budget 18.110 18.291 19.016 20.102
Number of sports facilities per 1,000 persons 0.051 0.052 0.053 0.057
High-risk drinking rate 21.100 20.889 20.045 18.779
Rate of preference on low-sodium food 40.000 40.400 42.000 44.400 Dependent
variable Metabolic syndrome 37.065 36.918 36.332 35.453
Table 10. Simulation results of metabolic syndrome prevalence in Yeongwol of Gangwon-do 준 비율, 고위험음주율이 높을수록 대사증후군 유병률이
높았으며, 복지예산 비율, 인구 천명당 체육시설 수, 저 염선호율이 낮을수록 대사증후군 유병률이 높은 것으로 조사되었다.
4. 지역별 대사증후군 유병률 관리
4.1 대사증후군 유병률 관리 우선순위
지리적 가중 회귀분석 결과 252개 지역별 고졸미만 교육수준 비율, 복지예산 비율, 인구 천명당 체육시설 수, 고위험음주율, 저염선호율과 같이 5개 요인의 회귀 계수가 산출되었다. 지역별 각 요인의 회귀계수를 이용 하여 지역별 대사증후군 유병률 관리 우선순위를 선정하 였으며, 아래 Table 9와 같이 6개의 적용지역 그룹으로 나누었다.
4.2 대사증후군 유병률 관리 시뮬레이션 4.2.1 엑셀을 이용한 시뮬레이션 도구 개발 지리적 가중 회귀분석 결과 고졸미만 교육수준 비율, 복지예산 비율, 인구 천명당 체육시설 수, 고위험음주율, 저염선호율 요인으로 구성된 총 252개의 지역별 회귀모 형이 산출됨에 따라 252개 지역별 회귀모형 결과를 이 용하여 지역의 보건사업 담당자들이 손쉽게 활용할 수 있도록 엑셀을 이용한 지역별 대사증후군 유병률 관리 시뮬레이션 도구를 개발하였다.
Fig. 3은 개발된 시뮬레이션 도구의 화면을 나타낸다.
지역 선택에서 해당 시군구를 선택한 후 변화1, 변화2 등에 고졸미만 교육수준 비율, 복지예산 비율, 인구 천명 당 체육시설 수, 고위험음주율, 저염선호율의 변화된 값 을 입력하면 해당 시군구의 지리적 가중 회귀 모형에 따 라 변화되는 대사증후군 유병률 값이 출력된다.
4.2.2 강원 영월군의 시뮬레이션 결과
252개 시군구 중 대사증후군 유병률이 가장 높은 강 원 영월군을 대상으로 본 연구에서 개발한 지역별 대사 증후군 유병률 관리 시뮬레이션을 적용하였다. 그 결과 Table 10과 같이 강원 영월군의 고졸미만 교육수준 비 율, 복지예산 비율, 인구 천명당 체육시설 수, 고위험음 주율, 저염선호율을 2015년 결과 기준 1%, 5%, 10% 변 화했을 시 강원 영월군의 대사증후군 유병률은 37.1%에 서 각각 36.9%, 36.3%, 35.5%로 감소하는 것으로 나타 났다.
5. 고찰 및 결론
본 연구는 지리적 가중 회귀를 이용하여 대사증후군 유병률의 지역 간 변이와 관련 요인을 파악하고, 지역의 효율적인 대사증후군 유병률 관리를 위한 사업방안 선정 을 지원하기 위해 수행되었다. 이를 위해 2015년 국민건 강보험공단의 건강검진 통계 연보 자료, 질병관리본부의 지역사회건강자료 등을 수집하여 대사증후군 유병률의 지역 간 변이수준을 파악하고, WHO의 건강불평등 발생 기전에 따라 대사증후군의 지역 간 변이 관련 요인을 지 역의 사회구조적 요인(사회경제적 수준), 중재 요인(물리 적 환경, 건강행태, 이환, 정신건강, 예방, 의료이용)으로 정의하여[22], 지역의 사회구조적 요인, 중재 요인이 대 사증후군 유병률에 미치는 영향을 분석하였다.
변이수준을 측정하는 지표인 EQ (Extremal Quotient) 를 통해 대사증후군 유병률의 지역 간 변이수준을 파악 한 결과 대사증후군 유병률의 EQ는 2.089(최소값 : 17.745, 최대값 : 37.065)로 2015년도 비만율 EQ 1.889 (최소값 : 18.9, 최대값 : 35.7)[23], 고혈압 평생 의사진 단 경험률 EQ 1.938(최소값 : 14.5, 최대값 : 28.1)[23]보 다 높아 비만, 고혈압에 비해 대사증후군 유병률의 지역 간 변이수준이 크다는 것을 알 수 있었다. 이는 대사증후 군 유병률에 대한 지역 간 변이 관련 요인을 파악하는 연구가 필요함을 시사하였다. 현재 우리나라의 경우 비 만율, 고혈압 이환율에 대한 지역 간 변이 및 관련 요인 을 규명하는 연구[9, 14]는 수행되었으나 대사증후군 유 병률에 대한 지역 간 변이 및 관련 요인을 분석하는 연 구는 수행된 적이 없음에 따라 본 연구가 의미가 있다고 할 수 있다.
단변량 분석인 상관분석을 통해 대사증후군 유병률과 사회구조적 요인과의 상관관계를 파악한 결과 노인인구 비율, 고졸미만 교육수준 비율, 기초생활수급자 비율의 경우 대사증후군 유병률과 양의 상관관계에 있었으며, 임근근로자 비율, 사무종사자 비율, 인구 일인당 건강보 험료, 재정자립도, 일반회계 중 복지예산 비율의 경우 대 사증후군 유병률과 음의 상관관계에 있었다. 고졸미만 교육수준 비율 및 복지예산 비율의 경우 다변량 분석인 지리적 가중 회귀분석에서도 지역의 대사증후군 유병률 에 유의한 영향을 미치는 요인으로 파악되었으며, 252개 시군구 모두 고졸미만 교육수준 비율이 높을수록, 복지 예산 비율이 낮을수록 대사증후군 유병률이 높은 것으로 조사되었다.
또한 단변량 분석인 상관분석을 통해 대사증후군 유 병률과 중재 요인과의 상관관계를 파악한 결과 걷기실천 율, 체중조절시도율의 경우 대사증후군 유병률과 음의 상관관계가 있었다. 이는 중등도 신체활동과 걷기를 적 게 할수록 대사증후군에 이환된 사람이 많은 것으로 분 석되었다는 선행연구 결과 등[3, 16]과 일치하는 결과였다.
지역의 물리적 환경의 변이요인인 인구 일인당 공원 면적, 인구 일인당 체육용지면적, 인구 천명당 체육시설 수의 경우 대사증후군 유병률과 양의 상관관계가 있었 다. 그러나 인구 천명당 체인화편의점의수 경우 모든 요 인을 고려한 대부분의 지역에서 인구 천 명 당 체인화편 의점의 수가 낮을수록 대사증후군 유병률이 높은 것으로 나타났다.
현재흡연율, 고위험음주율의 경우 대사증후군 유병률 과 양의 상관관계가 있었다. 고위험음주율의 경우 다변 량 분석인 지리적 가중 회귀분석에서도 지역의 대사증후 군 유병률에 유의한 영향을 미치는 요인으로 파악되었으 며, 252개 시군구 모두 고위험음주율이 높을수록 대사증 후군 유병률이 높은 것으로 조사되었다. 이와 같은 연구 결과는 흡연은 한국 성인 남녀 모두에서 대사증후군과 독립적인 연관성이 있으며, 이런 결과는 흡연을 할수록 대사증후군 위험도가 증가한다는 선행연구 결과 및 흡연 이 대사증후군의 위험요인임을 시사한다는 선행연구 결 과와 일치하는 결과였으며[5, 17], 음주량이 많을수록 대 사증후군의 위험도가 증가했으며[17], 고위험음주를 하는 사람이 그렇지 않은 사람에 비해 대사증후군 유병 확률이 높았으며[16], 알코올 의존도가 높은 군의 경우 알코올에 의존하지 않는 군에 비해 대사증후군 유병위험이 1.86배
높았다.[6]는 선행연구 결과와 일치하는 결과였다.
아침결식예방 인구 비율의 경우 대사증후군 유병률과 양의 상관관계가 있었으며, 저염선호율, 식품안정성확보 율, 영양표시 인지율, 영양교육 상담율의 경우 대사증후 군 유병률과 음의 상관관계가 있었다. 저염선호율의 경 우 다변량 분석인 지리적 가중 회귀분석에서도 지역의 대사증후군 유병률에 유의한 영향을 미치는 요인으로 파 악되었으며, 252개 시군구 모두 저염선호율이 낮을수록 대사증후군 유병률이 높은 것으로 조사되었다.
관절염 의사진단율, 필수의료서비스 미치료율의 경우 대사증후군 유병률과 양의 상관관계에 있었으며, 스트레 스 인지율의 경우도 대사증후군 유병률과 양의 상관관계 에 있었다. 스트레스 인지율의 경우 대사증후군은 연령이 나 생활습관인자를 보정한 후에도 스트레스와 연관이 있 었으며, 저스트레스군에 비해 고스트레스군의 대사증후 군 유병 확률이 4.2배 높았다는 대사증후군 유병의 개인 요인에 대한 선행연구 결과[24]와 유사한 결과였으며, 어 떻게 스트레스를 관리하고, 건강한 생활 습관으로의 변화 는 대사증후군 예방에 있어 중요하고, 근본적인 첫걸음이 라는 선행연구 결과[25]를 지지한다고 할 수 있다.
당뇨병관리교육 이수율, 건강검진 수검율의 경우 대 사증후군 유병률과 음의 상관관계가 있었다. 선행연구에 따르면 전국 대학병원에 내원하는 당뇨병 환자의 77.9%
에서 대사증후군이 나타났으며, 연령이 증가할수록 발생 률이 증가한다고 보고하고 있다[26]. 또한 당뇨병 환자 의 경우 당뇨병 식사요법을 잘 준수하지 않는 군은 잘 준수하는 군에 비해 대사증후군 동반비율이 약 2배 높았 고, 대사증후군 발생률을 증가시키는 요인으로 알려진 지질 및 나트륨 섭취를 스스로 조절하는 경향을 보이는 것으로 나타났다[27]. 따라서 지역의 대사증후군 관리를 위해서는 식사요법의 교육 등 효과적이고 실질적인 당뇨 병관리교육이 수행되어야 할 것이다.
지역별 건강관리 사업의 우선순위 선정을 위하여 본 연구에서 지리적 가중 회귀분석 결과 252개 지역별 고 졸미만 교육수준 비율, 복지예산 비율, 인구 천명당 체육 시설 수, 고위험음주율, 저염선호율과 같이 5개 요인의 회귀계수가 산출됨에 따라 지역별 각 요인의 회귀계수를 이용하여 지역별 대사증후군 유병률 관리 우선순위를 선 정하였다. 그 결과 총 6개의 지역 그룹이 형성이 되었으 며, 지역별로 대사증후군 유병률 관리를 위한 5개 요인 의 우선순위가 지정되었다.
또한 지역의 보건사업 담당자들이 손쉽게 활용할 수 있도록 고졸미만 교육수준 비율, 복지예산 비율, 인구 천 명당 체육시설 수, 고위험음주율, 저염선호율 요인으로 구성된 총 252개의 지역별 회귀모형 결과에 따라 엑셀을 이용하여 지역별 대사증후군 유병률 관리 시뮬레이션 도 구를 개발하였다. 252개 시군구 중 대사증후군 유병률이 가장 높은 강원 영월군을 대상으로 시뮬레이션을 적용하 였다. 시뮬레이션 결과 강원 영월군의 고졸미만 교육수준 비율, 복지예산 비율, 인구 천명당 체육시설 수, 고위험음 주율, 저염선호율을 2015년 결과 기준 1%, 5%, 10% 변화 했을 시 대사증후군 유병률은 37.1%에서 각각 36.9%, 36.3%, 35.5%로 감소하는 것으로 조사되었다.
본 논문에서는 지역의 효율적인 대사증후군 유병률 관리를 위한 사업방안 선정을 지원하기 위해 지리적 가 중 회귀분석 결과를 이용하여 252개 지역별 대사증후군 유병률 관리 우선순위를 제시하였을 뿐 아니라 지리적 가중 회귀 결과가 실질적으로 활용할 수 있도록 엑셀을 이용한 지역별 대사증후군 유병률 관리 시뮬레이션 도구 를 개발하였으며, 이를 대사증후군이 가장 높은 강원 영 월군을 대상으로 시뮬레이션을 적용 후 그 결과를 제시 함에 따라 사업의 효과성을 파악할 수 있도록 한 것에 의미가 있다고 할 수 있다. 그럼에도 불구하고 본 연구는 지역수준의 지표를 활용한 생태학적 연구임에 따라 자료 수집 및 수집된 자료의 한계가 있었으며, 대사증후군 유 병 환자의 개인 요인 자료 수집의 한계로 대사증후군 유 병에 영향을 미치는 개인 요인, 지역 요인을 복합적으로 고려하지 못함에 따라 향후 이의 개선을 위한 지속적인 연구가 필요할 것으로 사료된다.
References
[1] M. Aguilar, T. Bhuket, S. Torres, B. Liu, R. J. Wong, Prevalence of the Metabolic Syndrome in the United States, 2003-2012, The Journal of the American Medical Association, vol. 313, no. 19, pp. 1973
–
1974, 2015.DOI: https://doi.org/10.1001/jama.2015.4260
[2] Jaspinder Kaur. A Comprehensive Review on Metabolic Syndrome. Cardiology Research and Practice, vol. 2014, 2014.
[3] S. Y. Bang, The Effects of Metabolic Syndrome on Quality of Life. Journal of the Korea Academia- Industrial cooperation Society, 201, vol. 16, no. 10, pp.
7034-7042, 2015.
DOI: http://doi.org/10.5762/KAIS.2015.16.10.7034
[4] Health Insurance Review & Assessment Service, Geriatric Health, depends on life habit, 2015, http://www.hira.or.kr/bbsDummy.do?pgmid=HIRAA0200 41000100&brdScnBltNo=4&brdBltNo=8957 July, 2017 [5] J. -H. Kang, Y. -M. Song, H. -E. Kim, Y. -S. Park, J.
-H. Lee, Relationship between Smoking and Metabolic Syndrome in Korean Adults: Korean National Health and Nutrition Examination Survey. Korean Journal of Family Practice, vol. 4, no. 4, pp. 284-292, July, 2014.
[6] E. Park, S. J. Choi, H. Y. Lee, The Prevalence of Metabolic Syndrome and Related Risk Factors Based on the KNHANES V 2010, Journal of Agricultural Medicine and Community Health, vol. 38, no. 1, pp.
1-13, 2013.
DOI: https://doi.org/10.5393/JAMCH.2013.38.1.001 [7] Y. L. Lym
,
S. W. Hwang,
H. J. Shim,
E. H. Oh,
Y. S. Chang
,
B. L. Cho, Prevalence and Risk Factors of the Metabolic Syndrome as Defined by NCEP-ATP 3.The Journal of the Korean Academy of Family Medicine, vol. 24, no. 2, pp. 135-143, 2003.
[8] S. Macintyre, A. Ellaway, Ecological approaches:
Rediscovering the Role of the Physical and Social Environment. p. 332-348, Oxford University Press, 2000.
[9] H. S. Seok, S. H. Kang. A Study on The Regional Variation Factor of Hypertension Prevalence. Health and Social Welfare Review, vol. 33, no. 3, pp. 210-236, 2013.
DOI: https://doi.org/10.15709/hswr.2013.33.3.210 [10] N. Freudenberg, E. Franzosa, J. Chisholm, New
approaches for moving upstream: how state and local health departments can transform practice to reduce health inequalities, Health Education & Behavior, vol.
42, no. 1, pp. 46-56, 2015.
DOI: https://doi.org/10.1177/1090198114568304 [11] N. E. Adler, M. M. Glymour, J. Fielding, Addressing
Social Determinants of Health and Health Inequalities, The Journal of the American Medical Association, vol.
316, no. 16, pp. 1641
–
1642, 2016.DOI: https://doi.org/10.1001/jama.2016.14058
[12] M. Asaria, S. Ali, T. Doran, B. Ferguson, R. Fleetcroft, M. Goddard, P. Goldblatt, M. Laudicella, R. Raine, R.
Cookson, How a universal health system reduces inequalities: lessons from England. Journal of Epidemiology & Community Health, vol. 70, no. 7, pp.
637-643, 2016.
DOI: https://doi.org/10.1136/jech-2015-206742
[13] T. -H. Yoon. Global trends in healthy equity policy:
lessons from experiences in the UK, the Netherlands, Sweden, and the World Health Organization. Journal of Korean Medical Association, vol. 56, no. 3, pp. 195-205, 2013.
DOI: https://doi.org/10.5124/jkma.2013.56.3.195 [14] Y. M. Kim, S. H. Kang. A Study on the Geographic
Variations in the Prevalence of Obesity using Geographically Weighted Regression. The Geographical Journal of Korea, vol. 48, no. 4, pp. 425-438, 2014.
[15] Y. M. Kim, D. G. Cho, S. H. Kang. An Empirical Analysis on Geographic Variations in the Prevalence of Diabetes. Health and Social Welfare Review, vol. 34, no.
3, pp. 82-105, 2014.
DOI: https://doi.org/10.15709/hswr.2014.34.3.82
[16] M. J. Kim, E. Park, The Prevalence and the Related Factors of Metabolic Syndrome in Urban and Rural Community. Korean Journal of Adult Nursing, vol. 26, no. 1, pp. 67-77, 2014.
DOI: https://doi.org/10.7475/kjan.2014.26.1.67
[17] M. Y. Im, Y. -R. Lee, S. J. Han, C. -M. Cho, The Effects of Lifestyle Factors on Metabolic Syndrome among Korean Adults, Journal of Korean Academy of Community Health Nursing, vol. 23, no. 1, pp. 13-21, 2012.
DOI: https://doi.org/10.12799/jkachn.2012.23.1.13 [18] B. A. Samir, B. -B. Hanen, A. S. Hajer, T. Pierre, M.
Bernard, D. Francis, A. Noureddine, B. R. Habia, Menopause and Metabolic Syndrome in Tunisian Women. BioMed Research International, vol. 2014, Article ID 457131, pp. 1-7, 2014.
[19] R. Kahn, J. Buse, E. Ferrannini, M. Stern, The metabolic syndrome: time for a critical appraisal: joint statement from the American Diabetes Association and the European Association for the Study of Diabetes.
Diabetes Care, vol. 28, no. 9, pp. 2289-2304, 2005.
DOI: https://doi.org/10.2337/diacare.28.9.2289
[20] R. S. Beaser, P. Levy, Metabolic syndrome: a work in progress, but a useful construct, Circulation, vol. 115, no. 113, pp. 1812-1818, 2007.
DOI: https://doi.org/10.1161/CIRCULATIONAHA.106.673616 [21] Y. M. Kim, S. H. Kang, Convergence analysis for
geographic variations and risk factors in the prevalence of hyperlipidemia using measures of Korean Community Health Survey. Journal of Digital Convergence, vol. 13, no. 8, pp. 419-429. 2015.
DOI: https://doi.org/10.14400/JDC.2015.13.8.419 [22] World Health Organization, A conceptual framework for
action on the social determinants of health. p. 1-76, World Health Organization, 2010.
[23] H. R. Wyatt, G. K. Grunwald, C. L. Mosca, M. L.
Klem,R. R. Wing, J. O. Hill. Long-term weight loss and breakfast in subjects in the national weight control registry. Obesity, vol. 10, no. 2, pp. 78-82, 2002.
DOI: https://doi.org/10.1038/oby.2002.13
[24] J. -W, Jung, H. -C. Shin, Y. -W. Park, C. -H. Kim, S.
-Y. Cheong, E. Sung, The Relationship Between Metabolic Syndrome, Stress and Depression
–
among the 35-64 years old clients of comprehensive medical examination center in one university hospital -, Korean Journal of Health Promotion and Disease Prevention, vol. 4, no. 1, pp. 10-17, 2004.[25] D. H. Yeo, J. -M. Woo. Stress and Metabolic Syndrome.
The Korean Journal of Stress Research, vol. 15, no. 2, pp. 93-98, 2007.
[26] J. E. Choi, J. S. Seo, Interrelationship between diabetic control and related factors of dietary in diabetic patients.
Journal of the Korean Dietetic Association, vol. 11, no.
2, pp. 137-146, 2005.
[27] D. E. Kim, S. H. Hong, J. -M. Kim. The Relation between Diabetic Dietary Compliance, Dietary Intake, and Physical Activity and the Prevalence of Metabolic Syndrome (MS) in Type 2 Diabetic Patients, Korean Journal of Community Nutrition, vol. 20, no. 5, pp.
351-361, 2015.
DOI: https://doi.org/10.5720/kjcn.2015.20.5.351
선 미 옥(Mi Ohk Suhn) [정회원]
•1987년 4월 ~ 2011년 2월: 한림대 학교 부속병원 의무기록팀장
•2000년 8월 : 연세대학교 보건대학 원 보건정보관리학 (보건학석사)
•2012년 1월 ~ 현재 : 의료기관평 가인증원 전문조사위원
•2014년 3월 ~ 2017년 2월 : 우송 대학교 보건의료경영학과 교수
•2017년 3월 ~ 현재 : 유한대학교 U-보건의료행정과 교수
•2017년 8월 : 인제대학교 보건행정학과 (보건학박사)
<관심분야>
보건정보관리, 데이터마이닝, 의무기록
강 성 홍(Sung Hong Kang) [정회원]
•1994년 11월 ~ 1998년 2월: 의료 보험관리공단 병원기획부 의무기록 기획책임자
•1995년 1월 ~ 2006년 12월: 인제 대학교 보건행정학과 조교수
•2007년 1월 ~ 2010년 12월 : 인제 대학교 보건행정학과 부교수
•2011년 1월 ~ 현재 : 인제대학교 보건행정학과 교수
•2017년 3월 ~ 현재 : 의무기록협회 제21대 회장
<관심분야>
의료정보, 데이터마이닝, 의무기록
전 진 호(Jin-Ho Chun) [정회원]
•1985년 4월 ~ 현재 : 인제대학교 의과대학 예방의학교실 교수
•2003년 4월 ~ 2010년 2월 : 인제 대학교 부산백병원 IRB 위원장
•2012년 7월 ~ 2014년 6월 : 한국 역학회 회장
•2014년 8월 ~ 2016년 7월 : 인제 대학교 보건대학원 원장
•2015년 12월 ~ 2017년 11월 : 대한예방의학회 이사장
<관심분야>
역학, 의학통계, 임상예방의학, 기능의학