1. Introduction
Aerosol refers to the fine solids and liquids floating in the air. PM (particulate matter) is a kind of aerosol
which is very fine and invisible. According to the size of the diameter, the PM is divided into two categories:
PM10 with a diameter below 10 μm and PM2.5 with a diameter below 2.5 μm (Seinfeld and Pandis, 2006).
Prediction of Daily PM10 Concentration for Air Korea Stations Using Artificial Intelligence
with LDAPS Weather Data, MODIS AOD, and Chinese Air Quality Data
Yemin Jeong1)·Youjeong Youn2)·Subin Cho2)·Seoyeon Kim2)· Morang Huh3)·Yangwon Lee 4)†
Abstract: PM (particulate matter) is of interest to everyone because it can have adverse effects on human health by the infiltration from respiratory to internal organs. To date, many studies have made efforts for the prediction of PM10 and PM2.5 concentrations. Unlike previous studies, we conducted the prediction of tomorrow’s PM10 concentration for the Air Korea stations using Chinese PM10 data in addition to the satellite AOD and weather variables. We constructed 230,639 matchups from the raw data over 3 million and built an RF (random forest) model from the matchups to cope with the complexity and nonlinearity. The validation statistics from the blind test showed excellent accuracy with the RMSE (root mean square error) of 9.905 μg/m3and the CC (correlation coefficient) of 0.918. Moreover, our prediction model showed a stable performance without the dependency on seasons or the degree of PM10 concentration. However, part of coastal areas had a relatively low accuracy, which implies that a dedicated model for coastal areas will be necessary. Additional input variables such as wind direction, precipitation, and air stability should also be incorporated into the prediction model as future work.
Key Words: Air pollution, PM10, Artificial intelligence Korean Journal of Remote Sensing, Vol.36, No.4, 2020, pp.573~586
https://doi.org/10.7780/kjrs.2020.36.4.7 ISSN 1225-6161 ( Print )
ISSN 2287-9307 (Online)
Article
Received August 13, 2020; Revised August 18, 2020; Accepted August 21, 2020; Published online August 26, 2020
1)Undergraduate Student, Department of Spatial Information Engineering, Pukyong National University
2)Master Student, Major of Spatial Information Engineering, Division of Earth Environmental System Science, Pukyong National University
3)Director, Nano Weather Incorporation
4)Professor, Major of Spatial Information Engineering, Division of Earth Environmental System Science, Pukyong National University
†Corresponding Author: Yangwon Lee ([email protected])
This is an Open-Access article distributed under the terms of the Creative Commons Attribution Non-Commercial License (http://creativecommons.org/licenses/by-nc/3.0) which permits unrestricted non-commercial use, distribution, and reproduction in any medium, provided the original work is properly cited.
PM2.5 is usually formed by the secondary reactions of the precursor such as NH3, SO2, NOx, and VOC (volatile organic compound) under a specific atmospheric condition (Kim, 2006). PM10 is formed by the chemical mechanism similar to that of PM2.5 and by the soil constituents such as Al, Si, Ca, Ti, and Fe (Kim et al., 2016).
PM10 and PM2.5 become a matter of interest for everyone because it can have adverse effects on human health by the infiltration from respiratory to internal organs. WHO (World Health Organization) mentioned that approx. 50% of acute lower respiratory infections, 43% of chronic obstructive pulmonary disease, 29% of lung cancer, 25% of ischemic heart disease, and 24%
of stroke can be caused by air pollution (WHO, 2018).
Because Korea is located on the leeward side of China that suffers from severe air pollutions (Kim et al., 2006), accurate information about PM10 and PM2.5 becomes more critical. However, the prediction of PM10 and PM2.5 in Korea is not yet a satisfactory level in terms of accuracy (Cho et al., 2020).
The previous studies in the prediction of PM10 and PM2.5 are primarily divided into process-based modeling and statistical modeling. Process-based approaches employed numerical models such as ADAM (Asian Dust Aerosol Model) (Cho et al., 2007; Kim et al., 2011), WRF-Chem (Weather Research and Forecasting Model with Chemistry) (Saide et al., 2011; Moon et al., 2014), and CMAQ (Community Multi-scale Air Quality) (Kim et al., 2016; Jo et al., 2017) for the simulation of PM10 and PM2.5 concentrations, but it requires post-processing to reduce its unique systematic errors (Sohn et al., 2016). Statistical approaches aimed to mitigate the systematic errors of process-based models and used the meteorological variables such as temperature, humidity, precipitation, solar radiation, and wind that influence the PM10 and PM2.5 concentrations (Cha and Kim, 2018).
The AI (artificial intelligence) approaches using meteorological data with in-situ observations became
an alternative to statistical models. Prediction models were constructed by employing RF (random forest) and GBM (gradient boosting algorithm), a decision tree-based ensemble machine learning technique (Kwon et al., 2015; Choubin et al., 2020; Lee and Lee, 2020), and MLP (multi-layer perceptron) and ANN (artificial neural network), a structured weighting network consisting of multiple neurons (Grivas and Chaloulakou, 2006; Gupta and Christopher, 2009;
Asadollahfardi et al., 2016; Cho et al., 2019a). Recently, more intensive optimization of the learning network can be performed in a thicker and deeper network system. The deep learning models such as DNN (deep neural network) and RNN (recurrent neural network) were also employed for the prediction of PM10 and PM2.5 concentrations (Athira et al., 2018; Cho et al., 2019b; Cho et al., 2020). However, these AI models have been applied to only a few cities.
Also, a long-term prediction of PM10 is a challenging task because many uncertainties are involved in the determination of long-term atmospheric physics and chemistry. Various efforts have been made to mitigate the uncertainties, such as seasonal models (Miri et al., 2019), low- and high-concentration models (Cho et al., 2020), and more advanced time-series models based on the LSTM (long short-term memory) and GRU (gated recurrent unit) (Athira et al., 2018; Wu et al., 2020).
Indeed, satellite-derived AOD (aerosol optical depth) is closely associated with the PM10 and PM2.5 concentrations (Lee et al., 2006), but few studies have combined the satellite and meteorological data for the prediction of PM10 and PM2.5 concentrations. Korea can be affected by the air quality of China, but the information about the PM10 and PM2.5 concentrations of Chinese cities is rarely utilized for ancillary data.
Although Air Korea has more than 300 stations, only a few stations were used in the previous studies.
Thus, we aim to conduct an AI modeling for prediction of PM10 concentration using the entire data sets from the Air Korea stations for the recent five years
(January 2015 to December 2019) and the air quality data of Chinese cities, in addition to satellite AOD and meteorological data. We gathered the 3 million records for the hourly PM10 concentration from the 331 Air Korea stations. Also, the daily PM10 concentration data for three Chinese cities, the MODIS (Moderate Resolution Imaging Spectroradiometer) AOD (aerosol optical depth) images, and the LDAPS (Local Data Assimilation and Prediction System) meteorological variables were obtained to construct a matchup database. We built an RF model for the prediction of the PM10 concentration of tomorrow for the 331 Air Korea stations. We conducted 10-fold cross-validation for the blind test to evaluate the accuracy of our prediction model.
2. Data and Methods 1) Data
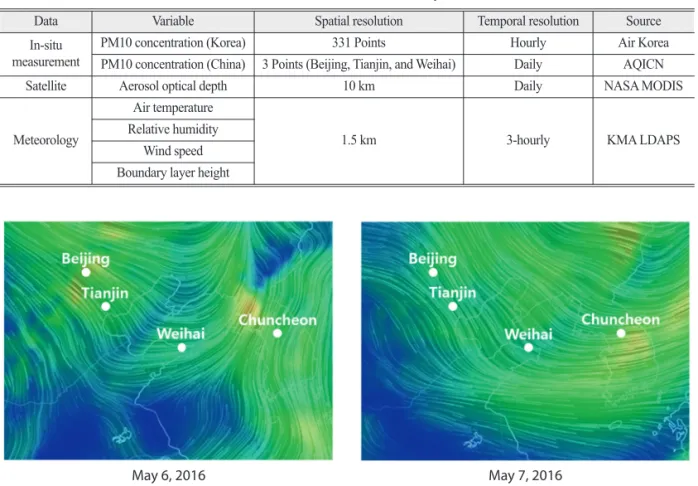
The in-situ measurements, satellite images, and meteorological variables for this study are summarized in Table 1.
The hourly PM10 measurements for the 331 Air Korea stations were obtained from the website (https://www.airkorea.or.kr/) managed by the Ministry of Environment, and the data was aggregated into the daily mean PM10 concentration for each station. Daily mean PM10 concentration of the three cities (Beijing, Tianjin, and Weihai) on the east coast of China has been gathered from the AQICN (Air Quality Index–
China) website (https://aqicn.org/). Korea is under the influence of the westerlies, so the atmosphere of the east coast of China often moves to the Korean peninsula
Table 1. Data used in this study
Data Variable Spatial resolution Temporal resolution Source
In-situ
measurement PM10 concentration (Korea) 331 Points Hourly Air Korea
PM10 concentration (China) 3 Points (Beijing, Tianjin, and Weihai) Daily AQICN
Satellite Aerosol optical depth 10 km Daily NASA MODIS
Meteorology
Air temperature
1.5 km 3-hourly KMA LDAPS
Relative humidity Wind speed Boundary layer height
Fig. 1. Wind maps for the east coast of China and the Korean peninsula, May 6 and 7, 2016.
May 6, 2016 May 7, 2016
Fig. 2. Hourly PM10 concentration in Beijing, Tianjin, and Weihai in China, and Chuncheon in Korea, May 6 and 7, 2016.
05-05 20:00 22:00 05-06 00:00 02:00 04:00 06:00 08:00 10:00 12:00 14:00 16:00 18:00 20:00 22:00 05-07 00:00 02:00 04:00 06:00 08:00 10:00 12:00 14:00 16:00 18:00 20:00 22:00 0-08 00:00
05-05 20:00 22:00 05-06 00:00 02:00 04:00 06:00 08:00 10:00 12:00 14:00 16:00 18:00 20:00 22:00 05-07 00:00 02:00 04:00 06:00 08:00 10:00 12:00 14:00 16:00 18:00 20:00 22:00 0-08 00:00
05-05 20:00 22:00 05-06 00:00 02:00 04:00 06:00 08:00 10:00 12:00 14:00 16:00 18:00 20:00 22:00 05-07 00:00 02:00 04:00 06:00 08:00 10:00 12:00 14:00 16:00 18:00 20:00 22:00 0-08 00:00
05-05 20:00 22:00 05-06 00:00 02:00 04:00 06:00 08:00 10:00 12:00 14:00 16:00 18:00 20:00 22:00 05-07 00:00 02:00 04:00 06:00 08:00 10:00 12:00 14:00 16:00 18:00 20:00 22:00 0-08 00:00
PM10 (μg/m3)
Beijing
Tianjin
Weihai
Chuncheon
1000 800 600 400 200 0
PM10 (μg/m3) 1000
800 600 400 200 0
PM10 (μg/m3) 1000
800 600 400 200 0
PM10 (μg/m3) 1000
800 600 400 200 0
(Fig. 1). Fig. 2 shows the changes in the hourly PM10 concentration for Beijing, Tianjin, and Weihai in China, and Chuncheon in Korea. On May 7, the PM10 concentration of Chuncheon surpassed 500 μg/m3, and a governmental alert was issued for the PM10. Twenty- four hours before that day, the PM10 concentration of Weihai was almost 500 μg/m3, and 12 hours before that time, the PM10 concentration of Beijing and Tianjin came close to 1000 μg/m3. It was presumably because of the influence of westerlies from China. The atmosphere has moved from Beijing and Tianjin through Weihai to the Korean peninsula, which could transport the PM10 to Korea. So, we calculated the daily average PM10 concentration for the three Chinese cities, which was used as one of the input variables for the prediction model.
MODIS is a sensor onboard Terra and Aqua satellites that were launched by NASA (National Aeronautics and Space Administration) in December 1999 and May 2002. The two satellites are scanning the entire Earth twice a day at an altitude of approx. 700 km and are gathering data for 36 spectral bands. We used the 550- nm AOD data from the MYD04_L2 product by Aqua MODIS. Part of solar radiation is absorbed and scattered by aerosols before reaching the ground. The aerosol extinction coefficient is calculated as the sum of the absorption and scattering coefficients. The 550- nm AOD is the vertical integral of the aerosol extinction coefficient at the wavelength of 550 nm. Because the MYD04_L2 product is a granule data along the orbit, 2 to 4 scenes per day are created for the region around Korea. We merged the multiple scenes into one image in the geographic coordinate system of latitude and longitude.
LDAPS is a numerical weather prediction model by KMA (Korea Meteorological Administration). It provides 3-hourly forecasts for the Korean peninsula with a spatial resolution of 1.5 km in the LCC (Lambert Conformal Conic) projection. We extracted the data for air temperature, relative humidity, wind speed, and
boundary layer height at 03 UTC (12 KST). The boundary layer is the lowest part of the atmosphere, i.e., 1 to 2 km above the ground directly influenced by the Earth’s surface. In this layer, the temperature, humidity, and wind can show a relatively rapid fluctuation with a strong vertical mixing because of the turbulent transfer of air mass (Pielke and Hayden, 2020). The high boundary layer means a broader space for the mixing and vertical diffusion of air pollution, so it is closely related to the PM10 concentration on the ground (Du et al., 2013; Geiß et al., 2017; Li et al., 2017;
Miao and Liu, 2019). Today’s weather variables were obtained from the LDAPS reanalysis, and tomorrow’s weather data were acquired from the LDAPS forecast.
The LDAPS reanalysis and forecast in the LCC projection were transformed into the geographic latitude and longitude for use in the collocation with the Air Korea stations.
2) Methods
RF is an ensemble method that utilizes a number of decision trees derived from random samples. If necessary, a bootstrap process is performed for resampling by accounting for the sample distribution.
A bagging (bootstrap aggregating) process creates a final solution by averaging the results from the bootstrapped trees (Ali et al., 2012). We used the h2o framework (https://www.h2o.ai/) to optimize the hyperparameters for the tree numbers and the variable numbers for splitting nodes in our experiment.
We built an RF model for the PM10 concentration of tomorrow for the 331 Air Korea stations (Fig. 3).
The RF model included 11 input variables: today’s PM10 concentration for each station, today’s PM10 concentration of Beijing, Tianjin, and Weihai, today’s MODIS AOD, and air temperature, relative humidity, wind speed, and boundary layer height for today and tomorrow. LDAPS reanalysis was used for today’s meteorological variables, and the forecast was used for tomorrow’s meteorological data. MODIS AOD can
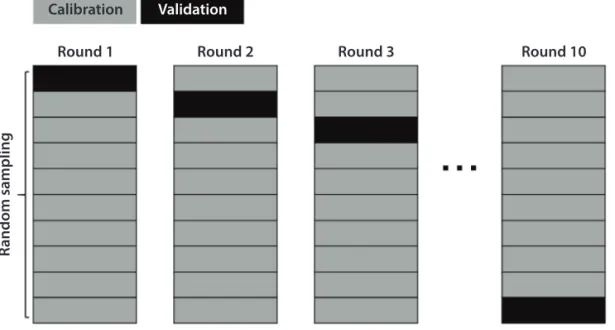
Fig. 4. Concept of 10-fold cross-validation with random sampling for the prediction of PM10 concentration of tomorrow (Kim et al., 2020).
Fig. 3. Random forest model for the prediction of PM10 concentration of tomorrow for Air Korea stations.
China Daily PM10
(Toady) MODIS (Today)AOD
TemperatureAir (Today) Relative Humidity
(Today)
WindSpeed (Today) Boundary Layer Height
(Today)
TemperatureAir (Tomorrow)
PredictionPM10 (Tomorrow)
Random Forest Model
Prediction of Daily PM10 Concentration of Tomorrow
For each Air Korea station Relative
Humidity
(Tomorrow) In-situ
Obs.
SpeedWind (Tomorrow)
Boundary Layer Height
(Tomorrow) Air Korea
Daily PM10 (Today)
Calibration
Round 1 Round 2 Round 3 Round 10
Random sampling
Validation
have missing pixels because of the cloud. Except for the missing values, we construct a matchup consisting of 230,639 valid records. This is a much larger database when compared with previous studies, which can help AI models achieve a good performance.
We carried out 10-fold cross-validation for the blind test to evaluate the accuracy of our RF model (Fig. 4).
First, the 230,639 matchups were divided into ten groups by random sampling. For round 1, group 1 was set to the validation target, and the other nine groups were used for model calibration. For round 2, group 2 becomes a validation target, with the other nine groups for model calibration. In this way, ten-round experiments were iterated, and the result was summarized for validation statistics. The 10-fold cross-validation enables a more stable model by using the training data with a less-biased sampling. The indices such as MBE (mean bias error), MAE (mean absolute error), RMSE (root mean square error), NRMSE (normalized mean square error), and CC (correlation coefficient) were used for the validation statistics.
3. Results and Discussions
Table 2 shows a summary of the result of the 10-fold cross-validation for our RF model using the 230,639 cases. The MAE of 6.846 μg/m³ indicates that the differences between the in-situ observations and our
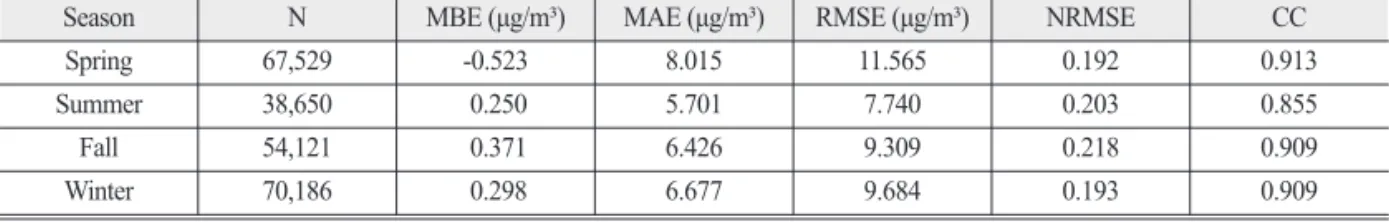
predictions were small. The CC of 0.918 shows very high predictability with the scatterplot concentrated around 1:1 line (Fig. 5). Because the PM10 of Korea is somewhat severe in winter and spring, we examined how the performance of our model changed according to seasons (Table 3). The number of matchups in summer was relatively small, which is because of the missing pixels of MODIS AOD due to the cloud. The accuracy did not show a significant difference by season. However, the summer PM10 has small values, so the RMSE was also small despite the lower CC than other seasons. For more objective validation statistics, we added NRMSE, a normalized index of the RMSE divided by the mean. The NRMSE of the summer PM10 was similar to that of other seasons, so we made
Table 2. Validation statistics of the random forest model for the prediction of PM10 concentration of tomorrow during 2015-2019
N MBE (μg/m³) MAE (μg/m³) RMSE (μg/m³) NRMSE CC
230,639 0.069 6.846 9.905 0.201 0.918
Table 3. Validation statistics of the random forest model for the prediction of PM10 concentration of tomorrow by season
Season N MBE (μg/m³) MAE (μg/m³) RMSE (μg/m³) NRMSE CC
Spring 67,529 -0.523 8.015 11.565 0.192 0.913
Summer 38,650 0.250 5.701 7.740 0.203 0.855
Fall 54,121 0.371 6.426 9.309 0.218 0.909
Winter 70,186 0.298 6.677 9.684 0.193 0.909
Fig. 5. Observed vs. predicted daily PM10 concentration for 331 Air Korea stations, 2015-2019.
0 100 200 300 400 Observed PM10 (μg/m3) 400
300
200
100
0 Predicted PM10 (μg/m3)
8000 6000 4000 2000
n = 230,639 MBE = 0.069 MAE = 6.846 RMSE = 9.905 NRMSE = 0.201 CC = 0.918
count
Fig. 6. Observed vs. predicted daily PM10 concentration for 331 Air Korea stations by season, 2015-2019.
Spring
Summer
Fall
Winter
Predicted PM10 (μg/m3)Predicted PM10 (μg/m3)Predicted PM10 (μg/m3)Predicted PM10 (μg/m3)
400
300
200
100
0
0 100 200 300 400 Observed PM10 (μg/m3)
0 100 200 300 400 Observed PM10 (μg/m3)
0 100 200 300 400 Observed PM10 (μg/m3)
0 100 200 300 400 Predicted PM10 (μg/m3) 0 100 200 300 400
Observed PM10 (μg/m3)
0 100 200 300 400 Predicted PM10 (μg/m3) 0 100 200 300 400
Observed PM10 (μg/m3)
0 100 200 300 400 Predicted PM10 (μg/m3) 0 100 200 300 400
Observed PM10 (μg/m3)
0 5000 10000 15000 20000 25000 30000Frequency 0 5000 10000 15000 20000 25000 30000Frequency
0 5000 10000 15000 20000 25000 30000Frequency 0 5000 10000 15000 20000 25000 30000Frequency
0 5000 10000 15000 20000 25000 30000Frequency 0 5000 10000 15000 20000 25000 30000Frequency
0 5000 10000 15000 20000 25000 30000Frequency 0 5000 10000 15000 20000 25000 30000Frequency
0 100 200 300 400 Predicted PM10 (μg/m3)
0 100 200 300 400 Observed PM10 (μg/m3)
0 100 200 300 400 Observed PM10 (μg/m3) 400
300
200
100
0
400
300
200
100
0
400
300
200
100
0
count 2000 1500 1000 500 n = 67,529
MBE = -0.523 MAE = 8.015 RMSE = 11.565 NRMSE = 0.192 CC = 0.913
n = 38,650 MBE = 0.250 MAE = 5.701 RMSE = 7.740 NRMSE = 0.203 CC = 0.855
n = 54,121 MBE = 0.371 MAE = 6.426 RMSE = 9.309 NRMSE = 0.218 CC = 0.909
n = 70,186 MBE = 0.298 MAE = 6.677 RMSE = 9.684 NRMSE = 0.193 CC = 0.909
count 2000 1500 1000 500
count 2000 1500 1000 500
count 2000 1500 1000 500
sure that the performance of our prediction model did not depend on seasons.
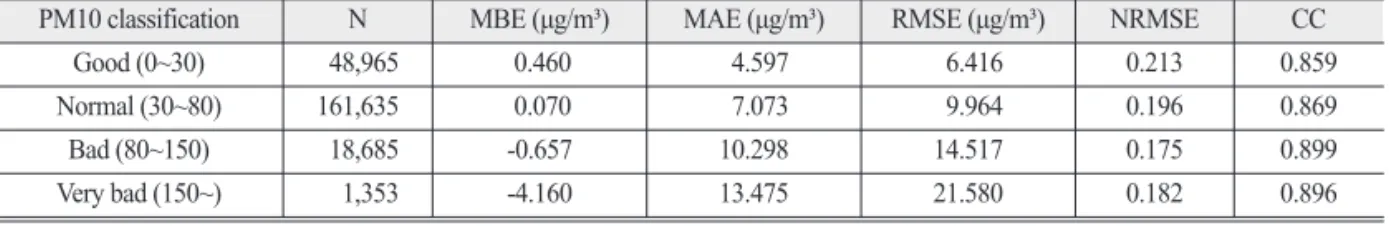
Korean government presents a classification of PM10 concentration: good (less than 30 μg/m³), normal (30 to 80 μg/m³), bad (80 to 150 μg/m³), and very bad (greater than 150 μg/m³). We examined if the accuracy
of our prediction model can vary according to the degree of PM10 concentration. We divided the result of the 10-fold cross-validation into four groups according to the classification of today’s PM10 concentration, because it is an already known value.
The number of cases for the group “Good” was
Fig. 7. Observed vs. predicted tomorrow’s PM10 concentration for 331 Air Korea stations grouped by today’s PM10 classification (good, normal, bad, and very bad).
0 100 200 300 400 Observed PM10 (μg/m3)
0 100 200 300 400 Observed PM10 (μg/m3)
400
300
200
100
0 Predicted PM10 (μg/m3)
400
300
200
100
0 Predicted PM10 (μg/m3)
400
300
200
100
0 Predicted PM10 (μg/m3)
400
300
200
100
0 Predicted PM10 (μg/m3)
0 100 200 300 400 Observed PM10 (μg/m3)
0 100 200 300 400 Observed PM10 (μg/m3)
n = 48,965 MBE = 0.460 MAE = 4.597 RMSE = 6.416 NRMSE = 0.213 CC = 0.859
n = 18,685 MBE = -0.657 MAE = 10.298 RMSE = 14.517 NRMSE = 0.175 CC = 0.899
Today’s PM10 category: Bad Today’s PM10 category: Very Bad Today’s PM10 category: Good Today’s PM10 category: Normal
n = 161,635 MBE = 0.070 MAE = 7.073 RMSE = 9.964 NRMSE = 0.196 CC = 0.869
n = 1,353 MBE = -4.160 MAE = 13.475 RMSE = 21.580 NRMSE = 0.182 CC = 0.896
count 300
200 100
count 6000
4000
2000
count 20 15 10 5 count
4000 3000 2000 1000
Table 4. Validation statistics of the random forest model for the prediction of PM10 concentration of tomorrow according to today’s PM10 classification (good, normal, bad, and very bad)
PM10 classification N MBE (μg/m³) MAE (μg/m³) RMSE (μg/m³) NRMSE CC
Good (0~30) 48,965 0.460 4.597 6.416 0.213 0.859
Normal (30~80) 161,635 0.070 7.073 9.964 0.196 0.869
Bad (80~150) 18,685 -0.657 10.298 14.517 0.175 0.899
Very bad (150~) 1,353 -4.160 13.475 21.580 0.182 0.896
48,965; the group “Normal” 161,635 cases; the group
“Bad” 18,685 cases; and the group “Very bad” 1,353 cases. Approx. 10% of the data belonged to the group
“Bad” or “Very bad.” Table 4 shows the validation statistics for each group. Small values usually result in minor errors, and large values often lead to significant errors. So, the RMSE of the group “Bad” and “Very bad” was higher, but the NRMSE was similar for all groups. The CC for all groups was also similar, so we supposed that our model produced a stable prediction for the PM10 concentration of tomorrow irrespective
of the degree of PM10.
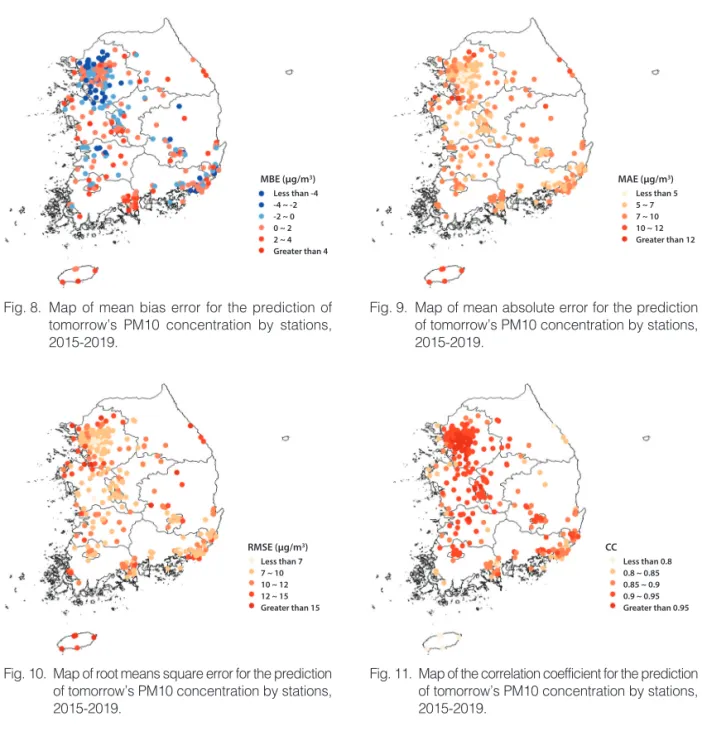
Each Air Korea station can have as many as 1,826 matchups for the five years. We examined how are the characteristics of accuracy according to the 331 stations. The stations were mainly located in the big cities, and the agricultural land and forest area have fewer stations. It is because the issue of PM10 is of interest to big cities. Fig. 8 shows that the MBE did not have a significant pattern, according to the region.
However, the MAE, RMSE, and CC in Fig. 9, Fig. 10, and Fig. 11 indicates that part of coastal areas had
Fig. 10. Map of root means square error for the prediction of tomorrow’s PM10 concentration by stations, 2015-2019.
Fig. 11. Map of the correlation coefficient for the prediction of tomorrow’s PM10 concentration by stations, 2015-2019.
Fig. 8. Map of mean bias error for the prediction of tomorrow’s PM10 concentration by stations, 2015-2019.
Fig. 9. Map of mean absolute error for the prediction of tomorrow’s PM10 concentration by stations, 2015-2019.
Less than -4 -4 ~ -2 -2 ~ 0 0 ~ 2 2 ~ 4 Greater than 4
Less than 5 5 ~ 7 7 ~ 10 10 ~ 12 Greater than 12
MBE (μg/m3) MAE (μg/m3)
Less than 7 7 ~ 10 10 ~ 12 12 ~ 15 Greater than 15
Less than 0.8 0.8 ~ 0.85 0.85 ~ 0.9 0.9 ~ 0.95 Greater than 0.95
RMSE (μg/m3) CC
relatively low accuracy, particularly for Jeju and Kangwon. It implies that an additional model for coastal areas will be required for future work.
Unlike previous studies, we used Chinese PM10 data in addition to the satellite AOD and weather variables.
The validation statistics from the blind test using 230,639 cases showed excellent accuracy with the RMSE of 9.905 μg/m3 and the CC of 0.918. It is because the complexity and nonlinearity were coped with by the AI models and because the quantity and quality of the training data were sufficient. Table 5 shows the variable importance; that is, the contribution of each variable to the model result. Today’s PM10 concentration of Air Korea station was 34.3%, and today’s PM10 concentration of the three Chinese cities was 26.0%. The other variables contributed to the RF model by approx. 40%; MODIS AOD and LDAPS meteorological variables have similar importance.
In particular, the two essential variables (i.e., today’s PM10 concentration of Korea and that of China) showed unique seasonal characteristics. The PM10 concentration of Korea is usually higher in winter and spring, presumably because of the westerlies from China. Also, the variable importance of today’s PM10 concentration of the three Chinese cities was higher in winter and spring but lower in summer and
fall (25.5% for winter and 22.7% for spring, but 12.2%
for summer and 18.3% for fall). The importance of AOD and meteorological variables did not significantly vary according to seasons. However, the AOD showed higher importance in summer than in other seasons;
the boundary layer height was more important in fall than in other seasons; the wind speed was relatively important in winter than in other seasons. It implies that individual seasonal models will be necessary for a more delicate prediction of the PM10 concentration in Korea.
4. Conclusions
We conducted the prediction of tomorrow’s PM10 concentration for the 331 Air Korea stations using Chinese PM10 data in addition to the satellite AOD and weather variables. We constructed 230,639 matchups from the raw data over three million and utilized them for the RF prediction model to cope with the complexity and nonlinearity. As a result, our model produced excellent accuracy from the blind test with the RMSE of 9.905 μg/m3and the CC of 0.918.
Moreover, our prediction model showed a stable performance without the dependency on seasons or the degree of PM10 concentration. However, part of Table 5. Variable importance of the random forest model for the prediction of tomorrow’s PM10 concentration
Variable All Spring Summer Fall Winter
Today’s PM10 concentration of Air Korea station 0.343 0.339 0.441 0.367 0.300 Today’s PM10 concentration of the three Chinese cities 0.260 0.227 0.122 0.183 0.255
Today’s MODIS AOD 0.056 0.055 0.087 0.066 0.048
Today’s air temperature of Air Korea station 0.068 0.060 0.052 0.074 0.049
Tomorrow’s air temperature of Air Korea station 0.054 0.056 0.050 0.058 0.054
Today’s relative humidity of Air Korea station 0.036 0.040 0.047 0.033 0.042
Tomorrow’s relative humidity of Air Korea station 0.051 0.077 0.036 0.050 0.059
Today’s wind speed of Air Korea station 0.034 0.033 0.043 0.027 0.070
Tomorrow’s wind speed of Air Korea station 0.033 0.037 0.042 0.029 0.052
Today’s boundary layer height of Air Korea station 0.033 0.038 0.038 0.066 0.031 Tomorrow’s boundary layer height of Air Korea station 0.032 0.038 0.042 0.047 0.040
Sum 1.000 1.000 1.000 1.000 1.000
coastal areas had a relatively low accuracy, which implies that a dedicated model for coastal areas will be necessary. Moreover, the variable importance by season indicates the possible needs for seasonal models.
Quality control for the LDAPS weather variables using the ground measurements of ASOS (Automated Surface Observing Systems) may be necessary.
Additional input variables such as wind direction, precipitation, and air stability should also be incorporated into the prediction model as future work.
Acknowledgements
This research was funded by the LINC+ Project (2020) supported by Pukyong National University and Ministry of Education. The authors acknowledge the assistance of Wonryul Jang, Sunghun Park, and Seonghwan Jung for helping data collection.
References
Ali, J., R. Khan, N. Ahmad, and I. Maqsood, 2012.
Random forests and decision trees, International Journal of Computer Science, 9(5): 272-278.
Asadollahfardi, G., H. Zangooei, and S.H. Aria, 2016.
Predicting PM2.5 concentrations using artificial neural networks and Markov chain, a case study Karaj city, Asian Journal of Atmospheric Environment, 10(2): 67-79.
Athira, V., P. Geetha, R. Vinayakumar, K.P. Soman, 2018. DeepAirNet: applying recurrent networks for air quality prediction, Procedia Computer Science, 132: 1394-1403.
Cha, J.W. and J.Y. Kim, 2018. Analysis of fine dust correlation between air quality and meteorological factors using SPSS, Journal of the Korea Institute of Information and Communication Engineering, 22(5): 722-727
(in Korean with English abstract).
Cho, C.B., Y.S. Chun, B.Y. Ku, S.U. Park, S.S. Lee, and Y.A. Chung, 2007. Comparison of ADAM’s (Asian Dust Aerosol Model) results with observed PM10 data, Journal of the Korean Meteorological Society, 17(1): 87-99 (in Korean with English abstract).
Cho, K.W., Y.J. Jung, C.G. Kang, and C.H. Oh, 2019.
Conformity assessment of machine learning algorithm for particulate matter prediction, Journal of the Korea Institute of Information and Communication Engineering, 23(1): 20-26 (in Korean with English abstract).
Cho, K.H., B.Y. Lee, M.H. Kwon, and S.C. Kim, 2019.
Air quality prediction using a deep neural network model, Journal of Korea Society for Atmospheric Environment, 35(2): 214-225 (in Korean with English abstract).
Cho, K.H., Y.J. Jung, J.S. Lee, and C.H. Oh, 2020.
Separation prediction model by concentration based on deep neural network for improving PM10 forecast accuracy, Journal of the Korea Institute of Information and Communication Engineering, 24(1): 8-14 (in Korean with English abstract).
Choubin, B., M. Abdolshahnejad, E. Moradi, X. Querol, A. Mosavi, S. Shamshirband, and P. Ghamisi, 2020. Spatial hazard assessment of the PM10 using machine learning models in Barcelona, Spain, Science of the Total Environment, 701:
134474.
Du, C., S. Liu, X. Yu, X. Li, C. Chen, Y. Peng, Y. Dong, Z. Dong, and F. Wang, 2013. Urban boundary layer height characteristics and relationship with particulate matter mass concentrations in Xi’an, central China, Aerosol and Air Quality Research, 13(5): 1598-1607.
Geiß, A., M. Wiegner, B. Bonn, K. Schäer, R. Forkel, E. von Schneidemesser, C. Münkel, K.L. Chan, and R. Nothard, 2017. Mixing layer height as
an indicator for urban air quality?, Atmospheric Measurement Techniques, 10(8): 2969-2988.
Grivas, G. and A. Chaloulakou, 2006. Artificial neural network models for prediction of PM10 hourly concentrations, in the Greater Area of Athens, Greece, Atmospheric Environment, 40(7): 1216-1229.
Gupta, P. and S.A. Christopher, 2009. Particulate matter air quality assessment using integrated surface, satellite, and meteorological products: 2. A neural network approach, Journal of Geophysical Research: Atmospheres, 114: D20205.
Jo, Y.J., H.J. Lee, L.S. Chang, and C.H. Kim, 2017.
Sensitivity study of the initial meteorological fields on the PM10 concentration predictions using CMAQ modeling, Journal of Korean Society for Atmospheric Environment, 33(6):
554-569 (in Korean with English abstract).
Kim, J.H., D.R. Choi, Y.S. Koo, J.B. Lee, and H.J. Park, 2016. Analysis of domestic and foreign contributions using DDM in CMAQ during particulate matter episode period of February 2014 in Seoul, Journal of Korean Society for Atmospheric Environment, 32(1): 82-99 (in Korean with English abstract).
Kim, N., S. Na, C. Park, M. Huh, J. Oh, K. Ha, J. Cho, and Y. Lee, 2020. An artificial intelligence approach to prediction of corn yields under extreme weather conditions using satellite and meteorological data, Applied Sciences, 10(11):
3785.
Kim, S.B., K. Yumimoto, I. Uno, and Y. Chun, 2011.
Dust model intercomparison between ADAM and CFORS/Dust for Asian dust case in 2007 (March 28 - April 3), Scientific Online Letters on the Atmosphere, 7A: 25-28.
Kim, Y.P., 2006. Air pollution in Seoul caused by aerosols, Journal of Korean Society for Atmospheric Environment, 22(5): 535-553 (in Korean with English abstract).
Kwon, J.H., Y.J. Lim, and H.S. Oh, 2015. Particulate matter prediction using quantile boosting, Korean Journal of Applied Statistics, 28(1):
83-92 (in Korean with English abstract).
Lee, D.W. and S.W. Lee, 2020. Hourly prediction of particulate matter (PM2.5) concentration using time series data and random forest, Korea Information Processing Society Transactions on Software and Data Engineering, 9(4): 129- 136 (in Korean with English abstract).
Lee, K.H., D.H. Lee, and Y.J. Kim, 2006. Application of MODIS satellite observation data for air quality forecast, Journal of Korea Society for Atmospheric Environment, 22(6): 851-862 (in Korean with English abstract).
Li, Z., J. Guo, A. Ding, H. Liao, J. Liu, Y. Sun, T. Wang, H. Xue, H. Zhang, and B. Zhu, 2017. Aerosol and boundary-layer interactions and impact on air quality, National Science Review, 4(6):
810-833.
Miao, Y. and S. Liu, 2019. Linkages between aerosol pollution and planetary boundary layer structure in China, Science of Total Environment, 650:
288-296.
Miri, M., Y. Ghassounb, A. Dovlatabadi, A. Ebrahimnejad, and M.O. Löwner, 2019. Estimate annual and seasonal PM1, PM2.5 and PM10 concentrations using land use regression model, Ecotoxicology and Environmental Safety, 174: 137-145.
Moon, Y.S., Y.S. Koo, and O.J. Jung, 2014. Analysis of sensitivity to prediction of particulate matters and related meteorological fields using the WRF-Chem model during Asian dust episode days, Korean Earth Science Society, 35(1): 1-18 (in Korean with English abstract).
Pielke, R.A. and B.P. Hayden, 2020. Planetary boundary layer, available at https://www.britannica.com/
science/planetary-boundary-layer, Accessed on Aug. 19, 2020.
Saide, P.E., G.R. Carmichael, S.N. Spak, L. Gallardo,
A.E. Osses, M.A. Mena-Carrasco, and M.
Pagowski, 2011. Forecasting urban PM10 and PM2.5 pollution episodes in very stable nocturnal conditions and complex terrain using WRF-Chem CO tracer model, Atmospheric Environment, 45(16): 2769-2780.
Seinfeld, J. H. and S. N. Pandis, 2006. Atmospheric Chemistry and Physics: From Air Pollution to Climate Change, John Wiley & Sons, Hoboken, NJ, USA.
Sohn, K.T., M. Ha, and S.H. Lee, 2016. Prediction model of PM10 concentration over Seoul using
CMAQ forecasts, Journal of the Korean Data Analysis Society, 18(6): 3001-3009 (in Korean with English abstract).
WHO, 2018. WHO Global Ambient Air Quality Database, available at https://www.who.int/
airpollution/data/en/, Accessed on Aug. 19, 2020.
Wu, X., Y. Wang, S. He, and Z. Wu, 2020. PM2.5/
PM10 ratio prediction based on a long short- term memory neural network in Wuhan, China, Geoscientific Model Development, 13(3): 1499- 1511.