Evaluating the Agricultural Drought for Pre-Kharif Season in Bangladesh using MODIS Vegetation Health Index
MODIS VHI 를 이용한 방글라데시 Pre-Kharif 시즌 농업가뭄의 평가
Mohammad Kamruzzaman
a⋅Jang Min-Won
b,†⋅Hwang Syewoon
c⋅Jang Taeil
d 모하마드 캄루자먼⋅장민원⋅황세운⋅장태일Abstract
This paper aimed to characterize the spatial and temporal pattern of agricultural drought in Pre-Kharif season using Vegetation Health Index (VHI) and illustrated drought characteristics in Bangladesh during 2001-2015. VHI was calculated from TCI (Temperature Condition Index) and VCI (Vegetation Condition Index) derived from MODIS Terra satellite data, LST (Land Surface Temperature) and EVI (Enhanced Vegetation Index), respectively. The finding showed that all drought-affected areas were experienced by mild, moderate, severe and extreme droughts in several years of Pre-Kharif seasons.
Significant drought events were found in the year of 2002 and 2013. On average, Chittagong district covered the largest drought area in all drought stages, and the fraction of drought area was the highest in Sylhet and Rangpur for Pre-Kharif season. Finally, overlaying annual VHI raster maps resulted in that the most vulnerable district to agricultural drought were Sylhet, Rangpur, and Mymensingh in the northern and eastern regions of Bangladesh.
Keywords: Agricultural drought; bangladesh; MODIS; pre-kharif; VHI
Ⅰ. Introduction
Drought is perhaps the most complex of chronic natural hazards which has an impact on environmental, agricultural, social, and economic sectors. Agricultural drought is the deficiency of soil moisture below the optimal level required for the proper growth of plants during different growing stages, resulting in growth stress and yield reduction. In Bangladesh, the warming rate was rapidly increasing and the trend was expected to continue over the next few decades (Ahmad and Warrick, 1996; Shahid, 2010a; Rahman and Lateh, 2015).
Further, the climate models projected a decline in precipitation
in a dry season and an increase during the monsoon in South Asia (Christensen et al., 2008). This revealed that there would be severe drought more frequently in the country and result in critical water scarcity that has never experienced before. In order to mitigate the increasing drought hazards, the phenomena should be carefully monitored and also the negative impacts are to be assessed (Gommes and Petrassi, 1994). A well-designed mitigation and preparedness plan against drought can help the decision makers to reduce the drought damage and to adapt to it. In this context, the monitoring of onset, duration, intensity, and extent of drought has become important for managing the adverse impact of drought.
To date, various methods have been developed and used for agricultural drought monitoring, these methods are usually known as agricultural drought indices (Zargar et al., 2011).
Every indicator, mostly based on meteorological data, has its successes and limitations in drought detection. Meteorological information from the ground station has good accuracy and is popular worldwide, but the distribution and density of stations are insufficient for the spatial information detection required (Unganai and Kogan, 1998). A major drawback of climate-based drought indicators is the lack of spatial detail as well as the sparse distribution of weather stations affecting the reliability
a PhD Student, Department of Agricultural Engineering, Gyeongsang National University
b Associate Professor, Division of Agro-system Engineering and Institute of Agriculture and Life Science, Gyeongsang National University
c Associate Professor, Division of Agro-system Engineering and Institute of Agriculture and Life Science, Gyeongsang National University
d Associate Professor, Department of Rural Construction Engineering, Chonbuk National University
† Corresponding author
Tel.: +82-55-772-1933 Fax: +82-55-772-1939 E-mail: [email protected]
Received: August 23, 2018 Revised: September 18, 2018 Accepted: September 28, 2018
of the drought indices (Brown et al., 2002). The spatial extent of drought cannot be properly identified unless there is a good spatial allocation of meteorological stations throughout the area.
In this context, drought monitoring through satellite-based information has been popularly accepted for its low cost, synoptic view, the repetition of data acquisition, and reliability.
Normalized Difference Vegetation Index (NDVI), Vegetation Condition Index (VCI), Temperature Condition Index (TCI) and Vegetation Health Index (VHI) are some of the extensively used vegetation indices. With the advancement in remote sensing technology, the historical drought indices were overpowered by the newly developed indices from remote sensing data that are considered to be real time (Jiao et al., 2016). Particularily, TCI, VCI, VHI, and NDVI are classified into vegetation indices which describe the condition of vegetation in particular area, and are known as significant drought indices for evaluating drought severity. Remote sensing and GIS technique is increasingly being regarded as a useful drought detection technique, as verified by its use across many parts of the world, e.g. Gujarat, India (Chopra, 2006), Western and Central Kansas, USA (Park et al., 2004), Batticaloa District, Srilanka (Partheepan and Dayawansa, 2008) and Borkhar District, Iran (Moktari, 2005). However, each index has its advantages and disadvantages. Amalo et al. (2017) carried out a research on the comparison between remote-sensing-based drought indices (TCI, VCI, and VHI) in East Java. It was found that TCI proved to be detected drought sensitively in dry season or months when high temperature occurred, while VCI detected drought more sensitively in the wet season than TCI. Since different remote sensing indices have different capabilities in monitoring and detecting agricultural drought, researchers have worked on combining them into a comprehensive drought index, assuming that this combination may provide better characterization of drought conditions (Hassan et al., 2015). VHI provides better comprehension about drought occurrence because VHI describes vegetation health from the combination of TCI (temperature) and VCI (vegetation condition) (Kogan, 1995).
Actually, VHI has been used for drought mapping in many regions of the world (e.g. Kogan, 2001; Dalezios et al., 2014;
Ghaleb et al., 2015; Khalil et al., 2013). Therefore, the index is considered to be more effective than other vegetation indices.
TCI and VCI indices are calculated using information of LST (Land Surface Temperature) and vegetation index EVI
(Enhanced Vegetation Index), respectively. Both of these datasets use MODIS imagery that has high temporal and spatial resolution for drought monitoring in regional scale. Besides, MODIS data has proven to be good in monitoring agricultural drought in the previous studies (e.g. Wang et al., 2014; Khalil et al., 2013).
Therefore, the use of the MODIS, LST, and EVI/NDVI imagery is certainly an advent technology in drought monitoring, and this study aimed to evaluate the agricultural drought condition in Pre-Kharif season over Bangladesh by using satellite-based VHI.
Ⅱ. Materials and methods 1. Study area
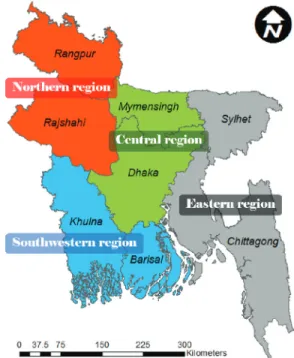
The experimental area is Bangladesh located within the coordinates 20.5˚N to 26.5˚N and 87.5˚E to 93.5˚E (Fig.
1). The total area of Bangladesh is 147,570 ㎢, among which about 71% is dominant by agricultural land (World Bank, 2015).
The crop growing period in Bangladesh is divided into three main seasons: Pre-Kharif (May-June), Kharif (July-October), and Rabi (November-February). The elevation is between the lowest point 0 m at the Indian Ocean and the highest point 1,052 m at Mowdoc located in the northern part of Bangladesh.
Fig. 1 Study area of Bangladesh dividing into four regions
The annual rainfall of the country is about 1,600 mm on average with a maximum of 5,690 mm in the northeast and a minimum of 1,110 mm in the west. About 80% of total rainfall occurs during rainy season with a maximum in July. The average temperature of the country is about 25˚C. The maximum temperature in summer varies between 38˚C to 41˚C. April is the hottest month in the country. There are four different vegetation areas in Bangladesh. The eastern region which is consisted by Sylhet and Chittagong division with low hills covered by jungles. The central region which covers Dhaka division supports swampy vegetation. The northern region which is consisted by Rangpur and Rajshahi division with mostly of cultivated plants and orchards whereas the southern zone which is consisted by Khulna and Barisal division along the Bay of Bengal contains wetlands with mangrove vegetation
2. Methodology a. Data collection
Surface Reflectance (SR) data of the MODIS (Moderate Resolution Imaging Spectra Radio-meter) Satellite with TERRA sensor were used in this study for estimating the VHI index.
Those data are Level 3 of MOD13Q1 16 days EVI with spatial
resolution 250 m and MOD011A2 8 days LST (cloud-free days) with spatial resolution 1 km were used for the period of 2001-2015. Data have been downloaded for the Pre-Kharif season (March-June) each year from NASA’s web-based portal LP DAAC (https://lpdaac.usgs.gov/).
b. Methodology
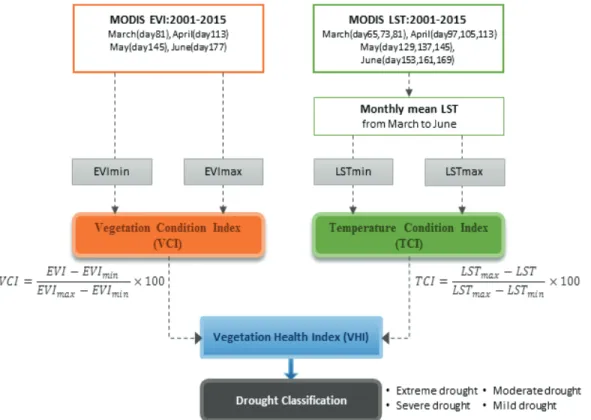
VHI is combined based on LST and EVI satellite imagery of MODIS as s hown in Fig. 2. EVI is determined by us ing MODIS red, blue, and NIR (Near-infrared) band reflectance as shown in Equation (1) (Rocha and Shaver, 2009). In vegetation optimum condition, chlorophylls absorb much visible light (380-700 nm) for photosynthesis processes. Therefore, the reflectance of red light is reduced, and NIR reflectance increases. Low red reflectance indicates high EVI, while high EVI indicates healthy vegetation. Computation of vegetation index needs to consider aerosols factor because it can scatter sunlight directly into the optical sensor and can increase the red visible light reflectance. Furthermore, aerosol can absorb sunlight and decrease NIR reflectance (Xiao et al., 2003).
EVI=G×(NIR−Red)×(L+NIR+C1×Red−C2×Blue) (1)
Fig. 2 Methodology used in this study for mapping VHI
Where L = 1 (canopy background adjustment factor), C1 = 6, and C2 = 7.5 (aeros ol correction factors ), and G = 2.5 (gain factor)
The Enhanced Vegetation Index (EVI), which overcomes the saturation problem of NDVI, especially in areas with large amounts of vegetative biomass (Huete et al., 2002), was selected as the vegetation index for use in this study. It was developed by regarding the blue reflectance band (B) to correct for atmospheric and soil background influences (Huete et al., 2011).
LST data are used to describe the effect of thermal on vegetation health because high temperature and low humidity can cause plant stress. In VHI computation, LST and EVI need to be calculated into TCI and VCI. An equal weight combination between TCI and VCI will produce VHI which can be used as agricultural drought detection and monitoring (Dalezios et al., 2014). TCI, VCI, and VHI were calculated by Equation (2)∼(4), respectively.
As for VCI, the model has been widely used for estimating vegetation condition based on EVI minimum and maximum value. The VCI is expressed in percentage (%) and gives an idea where the observed value is situated between the extreme values (minimum and maximum) in the previous years as shown at Equation (2).
匏勼匂
匜= (EVI
匜−EVI
匟匛匠) / (EVI
匟匔匪−EVI
匟匛匠) × 100 (2) Where EVI
jrepresents the EVI of current month, EVI
minand EVI
maxrepresent maximum and minimum EVI value throughout the time period. In this study, the time period referred to the year of study from 2001 to 2015.
Also, TCI index has been used as an effective agricultural drought index to monitor the spatial pattern of vegetation over a region (Equation (3)) (Patel et al 2011).
匍勼匂
匜= (包匌匍
匟匔匪−包匌匍
匜) /
(包匌匍
max−包匌匍
匟匛匠) × 100 (3) Where LST
jrepresents LST of current month, LST
minand LST
maxrepresent maximum and minimum LST value throughout the time period.
VHI representing overall vegetation health (Kogan, 2001) is generated by using Equation (4). TCI identifies the stress condition of vegetation caused by high temperature and low moisture, while VCI are scaling the vegetation dynamic into
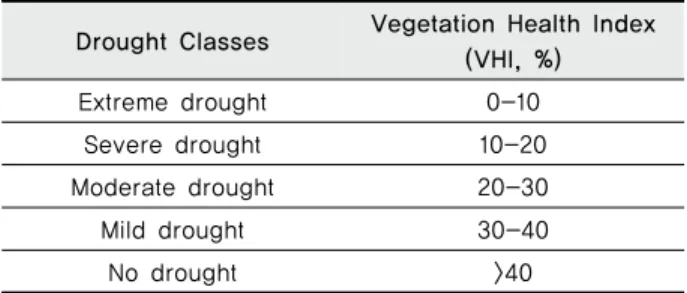
ranges 0 to 100 showing the change of vegetation moisture from optimum condition to bad condition (Ghaleb et al., 2015). VHI combined with TCI and VCI, presents a better drought identification knowledge about drought events comparing with single drought index indicator. VHI is then classified into five classes proposed by Kogan (2001) for further analysis (Table 1).
匏匁匂 = 0.5×匏勼匂 + 0.5×匍勼匂 (4)
Drought Classes Vegetation Health Index (VHI, %)
Extreme drought 0-10
Severe drought 10-20
Moderate drought 20-30
Mild drought 30-40
No drought >40
Table 1 Drought severity classes (Kogan, 2001)
Ⅲ. Results and discussion 1. Mapping VHI
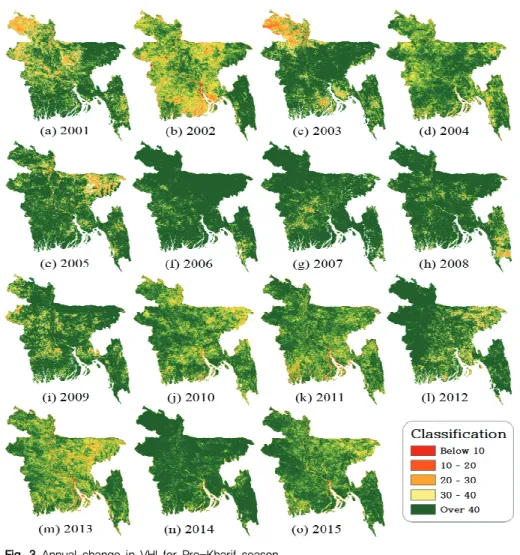
The Pre-Kharif season (March-June) in Bangladesh is a period with unpredictable rainfall, a long period of no rainfall, high temperatures (>40℃ in March to June), and increased evapotranspiration. This study analyzed VHI at Pre-Kharif season from 2001 to 2015, and the drought area was defined as pixels less than 40%-value in VHI by Kogan (2001). Fig.
3 resulted from the equal-weight combination of VCI and TCI raster imagery following Equation (3). Each VHI map was produced by averaging monthly VHI images from March to June. In case that the data quality of TCI imagery was poor because of the significant number of null cells caused by noise, cloud, and unidentified reasons, such pixels were excluded in the whole map algebra process. Overall, the areal extent of drought for Pre-Kharif season was most revealed in 2002, 2011, and 2013 across the different regions of Bangladesh.
2. Annual change in agricultural drought area As shown in Fig. 4, the largest drought-affected area (67.9%
of total area) was found in 2002 followed by 2013 (61.0% of
the total area), while the lowest drought-affected area was found
in the year 2007 (just 9.5% of the total area). As for 2002,
the extreme, severe, moderate, and mild drought area were
found accounting 1,311 ㎢ (0.9% of total area), 11,010 ㎢ (7.9%
of total area), 36,959 ㎢ (26.5% of total area), and 45,404 ㎢ (32.5% of total area), respectively. Whereas, in 2007, the extreme and severe drought was revealed just below 0.1% of
the total area of Bangladesh.
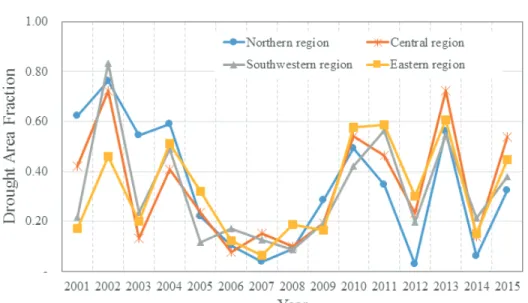
Regarding the spatial distribution, the eastern region (Syllet and Chittagong) showed the largest drought extent in 2013 for Pre-Kharif season between 2001 and 2015, while the northern
Fig. 3 Annual change in VHI for Pre-Kharif seasonFig. 4 Annual area fraction by VHI-based drought classes
(Rangpur and Rajshahi) and southwestern (Khulna and Barisal) regions were most affected by drought in 2002 which covered by about 37% of area of Bangladesh (Fig. 5). As for 2005 to 2009, drought area of VHI<40% was little found over all regions. The most serious drought was revealed at the southwestern region in 2002, and also the fraction of extreme and severe drought area (VHI<20%) was higher than all other years and regions.
3. Analysis of agricultural drought prone area In terms of the average extent of drought area, the analysis demonstrated Chittagong, the largest district in Bangladesh, had
the highest ratio of drought area through all drought conditions.
The least drought-affected area was Mymensingh as shown in Fig. 6. Conversely, considering the drought area fraction of each district, the minimum (0.31) was obtained from Chittagong district and the maximum ratio was shown in Sylhet (0.40) and Rangpur (0.37).
Drought-prone area for Pre-Kharif season was investigated by overlaying drought maps which were reclassified by VHI-based drought evaluation criteria (Fig. 7). All cells in a VHI raster map were divided into just 0 and 1 for under 40%
and others, respectively. The bigger accumulated value can be interpreted as the more vulnerable to agricultural drought in
Fig. 5 Ratio of drought area (VHI<40%) in Pre-Kharif season by regionsFig. 6 Drought area in Pre-Kharif season by drought classes and districts
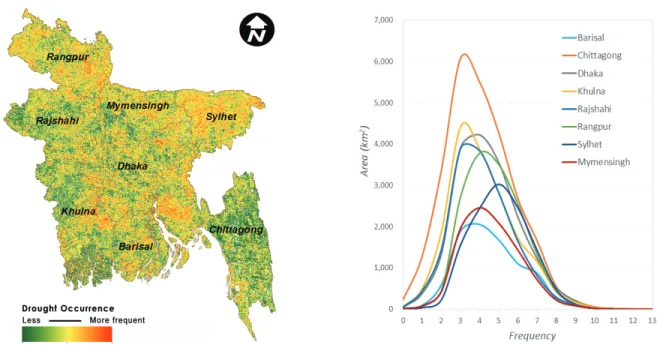
terms of recurrence of drought. From Fig. 7, it was found that just less than 1.0% of the whole area of Bangladesh experienced more than 10 years of agricultural drought (VHI<40%) between 2001 and 2015 and there had been three to six times of drought in about 78% of land for the study period. Fig. 8 described the area distribution by the frequency of drought occurrence (VHI<40%) in each district. The mean frequency was about 4.5 years, and Sylhet, Rangpur, and Mymensingh located in higher latitude fell into drought condition more frequently such as 5.1 years, 4.8 years, and 4.6 years, respectively. This coincided with the results of previous studies (Rahman et al., 2015; Mohsenipour et al., 2015) that revealed that the frequency of droughts in northern regions might be decreasing but still higher that other area. As for Chittagong having the widest drought extent in Fig. 6, the major part of the area was concluded to experience just 3 years of drought events between 2001 to 2015.
Ⅳ. Conclusion and Discussion
Bangladesh has a tropical monsoon climate characterized by wide seasonal variations in rainfall as well as temperature Therefore, seasonal agricultural droughts occur due to deficit of rainfall and increased temperature in a particular season. In Bangladesh, the crop growing period are mainly Pre-Kharif
(May-June), Kharif (July-October) and Rabi (November-February).
The climate characteristics in this season is a period with unpredictable rainfall, a long period of no rainfall, high temperature in March and May, and increased evapotranspiration.
Pre-Kharif crops such as wheat, potato, mustard, and rice are mainly affected by drought, especially traditional rice variety, Aus rice, where irrigation possibilities are limited. Previously, the Government of Bangladesh has not paid enough attention to the Pre- kharif production. However, very recently, the government policy has given emphasis to boost up Aus rice production during Pre-Kharif season and shrink the cultivation area of irrigated rice varieties in the same time to balance the total production.
It is notable that drought-resilient agriculture is necessary to achieve sustainable agricultural development ensuring food security in Bangladesh. Bangladesh has been under the consistent threat of drought, but lack of field surveillance related with drought damages and the limited database impede further and practical studies in drought mitigation management.
Most studies in the past have used mainly meteorological drought indices such as SPI (Standardized Precipitation Index) and PDSI (Palmer Drought Severity Index) to understand the development and characteristics of drought. Meteorological drought indices can be produced with just weather data, which have relatively longer history of gauging compared with other
Fig. 7 Frequency (Max.: 13, Min.: 0) map of agricultural drought inPre-Kharif season
Fig. 8 Distribution of drought area by the number of drought occurrence (years) between 2001 to 2015