Population Genetic Structure of Octopus minor Sasaki from Korea and China Based on a Partial Sequencing of Mitochondrial 16S rRNA
Joo Il Kim, Taeg Yun Oh, Young Il Seo and Eun Seob Cho*
South Sea Fisheries Research Institute, National Fisheries Research and Development Institute, Yeosu 556-823, Republic of Korea
Received March 17, 2009 /Accepted May 26, 2009We determined a portion of mitochondrial 16S rRNA gene sequences (416 bp) to investigate the genet- ic structure of the octopus (Octopus minor Ssaki) population in Korea and China. Samples were ob- tained from Korea (Yeosu, Namhae, Jindo, Muan, Geomundo and Seosan) and China (Sandong) dur- ing the period of August 2006 to September 2007. Sequence analyses of 28 individual specimens col- lected from 7 localities revealed 11 haplotypes, ranging in a sequence divergence of 0.2% - 1.2%.
Phylogenetic analyses using PHYLIP and networks subdivided the octopus into two clades (termed clade A and B) and the nucleotide divergence between them was 0.4%. This haplotype subdivision was in accordance with geographic separation: one at Yeosu, Namhae, Muan and Jindo, and the other at Seosan, Geomundo and Sandong. On the basis of hierarchial genetic analysis, genetic distance be- tween localities in Korea and China were also found, but a significant population differentiation was not shown in this study (p>0.05). Consequently, most of the octopus populations in Korea had consid- erable distribution due to the mitochondrial gene flow that resulted in a formation of a genetically homogenous structure, whereas some of the Korean and Chinese populations had different genetic structures. Gene flow among populations may be restricted due to impassable geographic barriers that promote genetic differentiation.
Key words : Gene flow, mitochondrial DNA, octopus, population structure
*Corresponding author
*Tel:+82-61-690-8959, Fax:+82-61-686-1588
*E-mail : [email protected]
Introduction
A major concern in the field of population genetics is the challenges to understand the causes of differentiation be- tween populations across ranges of geographic distribution.
With the advanced techniques at the level of DNA, genetic data now serve an important role in guiding the manage- ment of marine fishes [6], marine animals [7] and marine invertebrates [23]. Data on the genetic structure of pop- ulations are of particular interest because they may reveal evidence of restricted gene flow or genetic isolation that is undetectable through traditional demographic studies.
The octopus Octopus minor Sasaki, which is located around Korean coast is one of the most important fisheries resources in Korea. In particular, since southern waters are well developed by mud flats based, the region supports good habits for octopus continuing a number of capture rates [11]. However, annual production of octopus has been declined. Moreover, octopus has been imported in great numbers from China to the Korean fisheries market.
However, the octopus is poorly understood in studies of management and conservation genetics. In this study, we used the mitochondrial 16S gene sequences to analyze the inter-population and intra-population genetic structure of this species in Korean and Chinese waters.
Materials and Methods Specimen
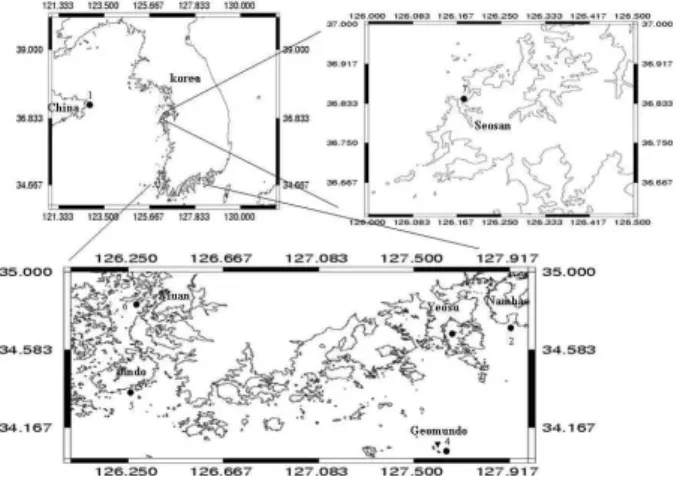
The octopuses were sampled from 6 localities on Korea coasts and l locality on a Chinese coast during the period of October 2006 - October 2007 (Fig. 1). We used a total of 28 individual specimens collected at 7 localities [Korea:
Namhae (locality 2), Muan (locality 6), Yeosu (locality 3), Jindo (locality 5), Seosan (locality 7) and Geomundo (locality 4); China: Sangdong (locality 1)]. Samples were frozen at -70
oC until required.
Molecular works
Total genomic DNA was extracted from 0.05g of an eye-
ball using a DNA Isolation kit (Roche Co.) after
homogenizing. The extracted genomic DNA was frozen at
-20
oC until required. The partial region of the mtDNA 16S
gene was amplified using L2510-16S (5’-CGCCTGTTTAACA
Fig. 1. Sampling locations of the octopus,
Octopus minor
, in Korea and China collected from August 2006 to August 2007.AAGACAT-3’) and H3058-16S (5’-TCCGGTCTGAACTCAG ATCACGTA-3’) primers [10]. PCR reactions were performed under the following conditions in 25 μl mixture: 1.25 unit Taq DNA polymerase (FastStar Taq DNA polymerase, Roche Co.); 1× PCR reaction buffer (Roche Co.); 0.1 mM dNTPs;
20 pmol of each primer; and 5-30 ng genomic DNA.
Amplifications were performed with the MyCycler thermal cycler (Bio-Rad). The thermocycling profile included an ini- tial denaturation step of 95
oC for 5 min, followed by 40 cy- cles of 15 sec at 94
oC, primer annealing for 15 sec at 50
oC, and extension for 30 sec at 72
oC. The final extension step was increased up to 5 min. PCR product was separated by running at 50 V for 50 min in 2% agarose containing 0.5 μg ml
-1ethidium bromide and then checked for molecular size. The PCR product was purified using PCR Purification kit (NucleoSpin
®Extract) by the following manufacture’s instructions. Purified DNA fragment was stored at -20
oC un- til used. The purified DNA was ligated with the vector, pUC 18 DNA (Roche Co.), using a One Shot
®Machi1
TM-T1
®clon- ing kit (Invitorgen).
Sequencing
The purified DNA using an Applied Biosystem model ABI 3730XL automated sequencer and a Big Dye terminator cycle sequencing kit (Perkin-Elmer Applied Biosystems, UK). For the sequencing reaction, 30 ng of purified PCR products, 2.5 pmol of primer, and 1 μl of Big Dye terminator were mixed and adjusted to a final volume of 7 μl with dH
2O. The reaction was run with 5% DMSO for 30 cycles of 15 sec at 95
oC, 5 s at 50
oC, and 4 min at 60
oC. Both strands were sequenced for crosscheck.
Haplotype
Sequence data were aligned using the multiple alignment program Clustal W [24]. When homologous sequences dif- fered by ≥ one nucleotide, the sequences were considered as different haplotypes. Haplotype designations (O1, O2, O3, and so forth) were applied to new sequences as they were discovered.
Phylogenetic analysis
Sequences were determined by parsimony, distances and maximum likelihood (ML) methods. To understand the pos- sible genetic relationships, PHYLIP (Phylogenetic Inference Package) ver. 3.573c [5] was used in this study. This search for parsimony analysis was repeated several times from dif- ferent random staring points using the stepwise addition op- tion to make certain the most parsimonious tree was found.
For distance analysis, subprogram DNADIST in PHYLIP was used to obtain a matrix of Kimura’s two-parameter dis- tance [13]. Distance matrix was analyzed by subprogram NEIGHBOR in PHYLIP with algorithms based on Saitou and Nei’s neighbor-joining (NJ) method [19]. All nucleotide sub- stitution was equally weighted and unordered alignment gaps were treated as missing information. The data set was iterated 100 times using a subprogram SEQBOOT. Reliability of the tree was constructed using subprogram CONSENSE in PHYLIP after pairwise sequence distances were estimated by Kimura’s two-parameter method, which attempts to cor- rect observed dissimilarities for multiple substitution in se- quences evolving with a transition bias.
Genetic diversity
To investigate the magnitude and pattern of genetic diver- sity within localities, the genetic diversity and mean number of pairwise differences among haplotypes, gene diversity, and nucleotide diversity were calculated using Arlequin ver 1.1 [20]. The mean number of differences between all pairs of haplotypes in the sample was obtained by considering the number of mutations having occurred since the di- vergence of any two haployptes, and the frequency of the ones involved in the calculation. Nucleotide diversity was calculated by estimating the probability that two randomly chosen homologous sequences would be different [15].
Genetic migration
Genetic distance (F
ST), coefficient of coancestry (D), and
female migration rate (N
m) between pairs of populations
were computed based on pairwise F
STindices following the approach described in Excoffier et al. [4]. Permutatations were performed to test the significance of the differentiation between pairs of localities. F
STvalues do not increase linearly with divergence time, but they can lineralize (mutation rate is low and divergence time is relatively short) with the fol- lowing as: D=-log(1-F
ST), where D is a coancestry coefficient that is approximately linear with divergence time [18].
Pairwise F
STvalues were converted to estimates of pergener- ation migration time using the equilibrium relationship:
F
ST=1/(2Nm+1).
Hierarchical structure
Hierarchical genetic relationships among populations and sets of populations were assessed by the Holsinger and Mason-Gamer (H-MG) method [9]. This study tested the de- gree of hierarchical subdivision between specified sets of lo- calities with the AMOVA (Analysis of Molecular Variance) program [4] incorporated in Arlequin ver 1.1 [20] Statistical significance of the difference between pairs of localities was tested by permutations (1,000 bootstrap) [4].
Results DNA analysis
The primer pair L2510 (forward)-H3058 (reverse) was used successfully in amplifying the octopus genomic DNA, and a PCR product of predicted size (416 bp) was obtained (Fig. 2). The individual haplotype is listed in Table 1. A total of 11 haplotypes (O1-O11) was obtained by a partial se- quencing 416 bp of the mtDNA 16S gene from 44 individual octopus specimens collected from 7 localities including
Fig. 2. Amplification PCR product using the primers L2510-16S (forward) and H3058-16S (reverse) for the octopus,
Octopus minor
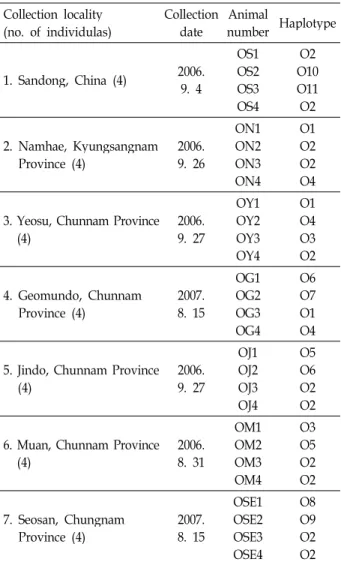
. 100 bp DNA ladder was used as molec- ular size marker in this study.Table 1. A list of sampling region, collection date, animal num- bers and mitochondrial 16S region gene haplotypes Collection locality
(no. of individulas) Collection date Animal
number Haplotype 1. Sandong, China (4) 2006.
9. 4
OS1 OS2OS3 OS4
O2 O10O11
O2 2. Namhae, Kyungsangnam
Province (4) 2006.
9. 26
ON1 ON2ON3 ON4
O1 O2O2 O4 3. Yeosu, Chunnam Province
(4) 2006.
9. 27
OY1OY2 OY3OY4
O1O4 O3O2
4. Geomundo, Chunnam
Province (4) 2007.
8. 15
OG1 OG2 OG3OG4
O6 O7 O1O4
5. Jindo, Chunnam Province
(4) 2006.
9. 27
OJ1 OJ2OJ3 OJ4
O5 O6O2 O2 6. Muan, Chunnam Province
(4) 2006.
8. 31
OM1OM2 OM3OM4
O3O5 O2O2
7. Seosan, Chungnam
Province (4) 2007.
8. 15
OSE1 OSE2OSE3 OSE4
O8 O9O2 O2
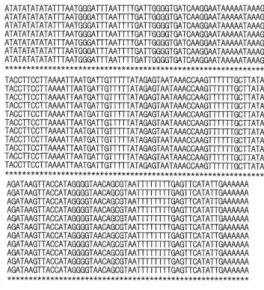
Korea and China (Table 1). Sequence alignment revealed 24 variable nucleotides, and all of them were transversional substitutions (5 G⇔C and 19 A⇔T). The transitional sub- stitutions and paralled mutations did not show (Fig. 3A, 3B).
Sequence divergence
Pairwise comparison between pairs of haplotypes was carried out to understand the divergence and relationship among haplotypes (Table 2). The sequence divergence ranged from 0.2% to 1.2% (1-5 bp), and the largest di- vergence was found when O1, O3, O4, O5, and O6 were respectively compared with O10 and O11. The maximum divergence value always includes O10 and O11. Even ex- cluding the haplotypes that showed the largest divergence value against O10 and O11, the remaining haplotypes also showed relatively large divergence against O10 and O11.
The mean pairwise difference of O10 and O11 against others
(A) (B)
Fig. 3. DNA sequence alignment for a partial region of the mi- tochondrial 16S gene in 11 haplotypes isolated from the oc- topus,
Octopus minor
. An asterisk represents an identical se- quence on vertical lines. Vertical two dots and vacant posi- tions represent the substitution of A⇔T and G⇔C, respectively. Only positions that are different from hap- lotype O1 are indicated.Table 2. Pairwise comparisons among 11 haplotypes obtained from the partial sequences of mitochondiral 16S region gene
1 2 3 4 5 6 7 8 9 10 11
12 34 5 67 89 1011
-1 11 1 23 33 45
0.0024
- 21 1 23 34 34
0.0024 0.0048
-1 2 12 32 45
0.0024 0.0024 0.0024
- 2 21 23 55
0.0024 0.0024 0.0048 0.0048
- 21 22 54
0.0048 0.0048 0.0024 0.0048 0.0048
-1 12 53
0.0072 0.0072 0.0048 0.0024 0.0024 0.0024
- 22 33
0.0072 0.0072 0.0072 0.0048 0.0048 0.0024 0.0048
-2 33
0.0072 0.0096 0.0048 0.0072 0.0048 0.0048 0.0048 0.0048
- 23
0.0096 0.0072 0.0096 0.0120 0.0120 0.0120 0.0072 0.0072 0.0048
-2
0.0120 0.0096 0.0120 0.0120 0.0096 0.0072 0.0072 0.0072 0.0072 0.0048
- Numbers above the diagonal are mean distance values and numbers below the diagonal are absolute distance values. 1, O1; 2, O2; 3, O3; 3, O4; 4, O4; 5, O5; 6, O6; 7, O7; 8, O8; 9, O9; 10, O10; 11, O11
is the largest (3.7 nucleotides; 0.8%), whereas others ranged from 1 (0.2%) to 2.5 (0.6%) nucleotides. Excluding this most divergent O10 and O11, haplotype divergence among others ranged from 0.2% to 0.9% (1-4 bp).
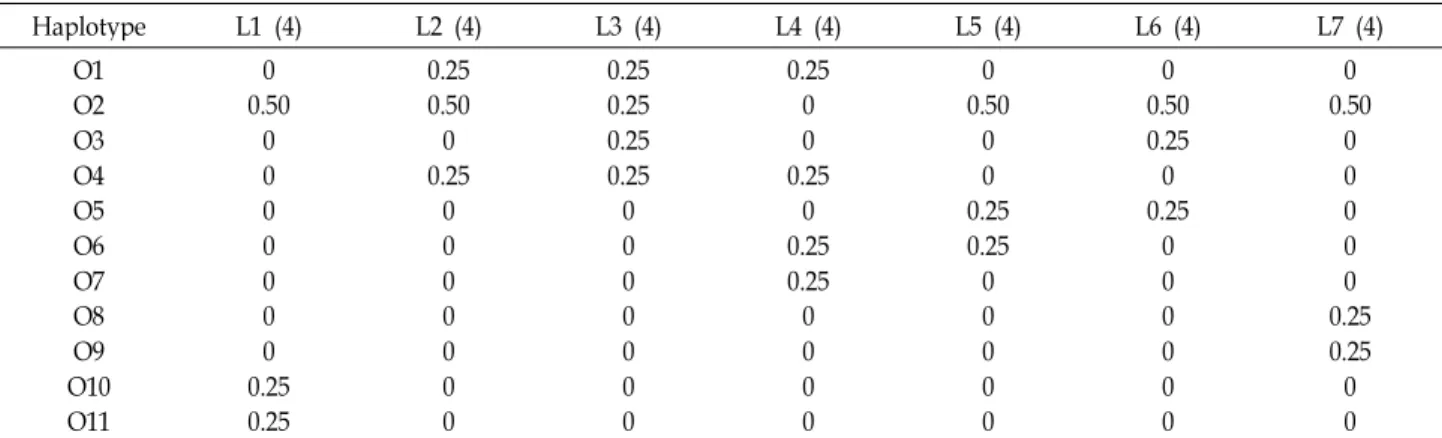
Haplotype distribution
Geographic distribution and frequency of haplotypes are listed in Table 3. The most frequent O2 haplotype (11 in- dividual specimens in 28) was found largely at localities in
Sandong (locality 1), Namhae (locality 2), Yeosu (locality 3), Jindo (locality 5), Muan (locality 6) and Seosan (locality 7), indicating a wide geographic distribution in Korea and China. Two haplotypes (O10 and O11) were found only in Sandong, but O7, O8 and O9 haplotypes also occurred in Geomundo (locality 4) and Seasan. It shows regional re- striction and rarity in O7, O8, O9, O10 and O11 haplotypes.
Sandong, Seosan and Geomundo showed no co-occurring
haplotypes as to Namahe, Yeosu, Jindo and Muan localities.
Table 3. Relative frequencies of mitochondrial DNA 16S gene haplotypes through the populations
Haplotype L1 (4) L2 (4) L3 (4) L4 (4) L5 (4) L6 (4) L7 (4)
O1 O2O3 O4O5 O6 O7O8 O10O9 O11
0 0.500
00 0 00 0.250 0.25
0.25 0.500 0.250 0 00 00 0
0.25 0.250.25 0.250 0 00 00 0
0.25 00 0.250 0.25 0.250 00 0
0 0.500 0.250 0.25 00 00 0
0 0.500.25 0.250 0 00 00 0
0 0.500
00 0 0.250 0.250 0 L1, locality 1: Sandong; L2, locality 2: Namhae; L3, locality 3: Yeosu; L4, locality 4: Geomundo; L5, locality 5: Jindo; L6, locality 6: Muan; L7, locality 7: Seosan. Numbers in parentheses indicate sample size of each population.
Consequently, haplotype distribution can be explained as the co-existence of regional restriction in some haplotypes and far-reaching co-occurring in only one haplotype.
Phylogenetic relationship
Fig. 4 shows the results of phylogenetic analyses to inves- tigate relationships among haplotypes using the NJ method incorporated in PHYLIP. Most haplotypes were weakly asso- ciated or unresolved. The genetic trees generated by NJ and ML methods had a similar topology and even analyses run through several transitions: transversion weightings of 1:0, 1:1, 1:10 and 1:20 did not affect them. 11 haplotypes obtained in this study were subdivided into two independent groups
Fig. 4. PHYLIP analysis of mitochondrial 16S gene sequences us- ing mtDNA sequences of 11 Octopus minor haplotypes.
The tree was obtained using the subprogram NEIGHBOR incorporated in PHYLIP. The tree was rooted using
Octopus vulgaris
. The numbers shown on branches, which represent bootstrap values for 100 replications, were ob- tained from using the subprogram CONSENSE.(clade A and clade B) although haplotype relationships with- in each clade were mostly not resolved. When members of haplotypes in each clade were imposed on their geographic location, they were divided into two geographic groups. Five haplotypes belonging to clade A were found exclusively in Namhae, Yeosu, Jindo and Muan, although overlapping in the distribution of the two clades occurred. Six haplotypes belonging to clade B were found exclusively in Geomundo, Seosan and Sandong. The bootstrap values at the nodes sup- porting each clade were somewhat higher in the NJ tree (66% in clade A and 49% in clade B) than in the ML tree (59% in clade A and 35% in clade B).
Networking
To further illustrate the genetic relationships among hap- lotypes, we used an unrooted one-step median network, which visualizes a possible evolutionary pathway among closely related haplotypes (Fig. 5). Although we expected more resolution in the closely related haplotypes, it provided us with limited information. Haplotypes belonging to clade A could have been derived from a single founder, haplotype O2 (labeled as 2). The network confirmed the result obtained from the PHYLIP analysis in that haplotypes were sub- divided into two clades, separated by 0.4% of nucleotide divergence.
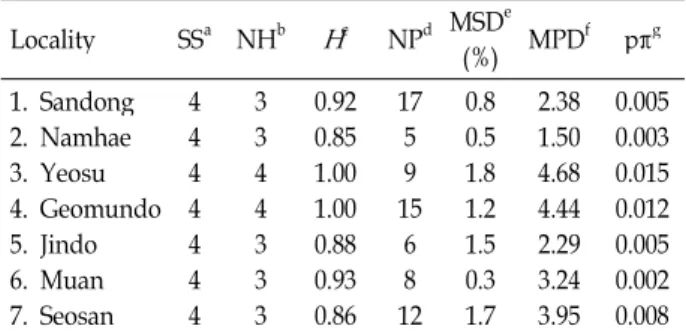
Genetic diversity
Within locality diversity was estimated in terms of hap-
lotype diversity (H), maximum sequence divergence
(MSD), mean number of pairwise differences (MPD) and
nucleotide diversity (π) (Table 4). One of the biggest results
is high H. In a range of 0.8-1, all but Namhae, Jindo and
Fig. 5. Parsimonious one-step median networks analysis among 11
Octopus minor
haplotypes. Each bar indicates one nu- cleotide difference from the neighboring haplotype.Numbers on each circle denote the haplotype name, omitting the antecedent alphabets, O. Note that hap- lotype 2 (O2) in clade A and haplotype 6 (O6) in clade B require two (0.4% of sequence divergence) to connect to each other.
Table 4. Within-locality diversity estimates Locality SSa NHb
H
c NPd MSDe(%) MPDf pπg 1. Sandong
2. Namhae 3. Yeosu 4. Geomundo 5. Jindo 6. Muan 7. Seosan
4 4 4 4 44 4
3 3 4 4 33 3
0.92 0.85 1.00 1.00 0.880.93 0.86
17 5 9 15
68 12
0.8 0.5 1.8 1.2 1.50.3 1.7
2.38 1.50 4.68 4.44 2.293.24 3.95
0.005 0.003 0.015 0.012 0.005 0.002 0.008
aSample size, bNumber of haplotype, cHaplotype diversity,
dNumber of polymorphic sites,eMaxium sequence divergence
fMean number of pairwise differences, gNucleotide diversity
Seosan (H=0.85, 0.88 and 0.86, respectively) were ex- tremely high (H=0.9-1.0). Particularly, all individual speci- mens at Yeosu and Geomundo showed all and nearly all different haplotypes, respectively (both H=1.0). Yeosu and Geomundo showed highly results of MSD (1.8 and 1.2, respectively), MPD (4.68 and 4.44, respectively) and π (0.015 and 0.012, respectively) compared with other localities.
Gene flow
Genetic distance (F
ST), coancestry coefficient (D) and migration rates (Nm) are shown in Table 5. Analysis of F
STbetween populations ranged from 0.09-0.39 (maximum:
comparison between Sandong and Jindo. However, pair- wise comparisons between Yeosu and Namhae/Jindo and Muan had negative values of F
ST(-0.10 and -0.15, re- spectively), indicating to compose homogeneous populations. In particular, the estimate obtained in a com- parison between Sandong and all of the Korean pop- ulations showed relatively higher F
ST(0.23-0.39). However, a test of statistical significance of pairwise F
STestimates showed that the Sandong population is not significantly differentiated from Korean populations (p>0.05). Likewise, no population pair was differentiated with statistical sig- nificance from Korean populations (p>0.05). Pairwise cmparisons of coefficients of coancestry (0-1, where D=0 is identical, shared ancestry) ranged from 0-0.4, which were also consistent with the F
STestimates. The populations of Yeosu and Namhae/Jindo and Muan indicate nearly sim- ilar estimates and existence of ancestry, whereas Sandong, Geomundo and Seosan each have different ancestry.
Furthermore, per generation migration rate (Nm) was ex- tremely high between Yeosu and Namhae/Jindo and Musan. In the relationships between geographic distance and genetic distance, there was a somewhat consistent trend. The greatest genetic distance (F
ST=0.39) was found in a comparison between geographically no closer localities. Yeosu and Namhae/Jindo and Muan located in a distance of below 100 km showed essentially zero ge- netic distance. The increase in genetic isolation appears to understand in proportion to the increase in geographic distance. Consequently, it seems that gene flow does oc- cur among localities, but local populations possess their own sets of haplotypes.
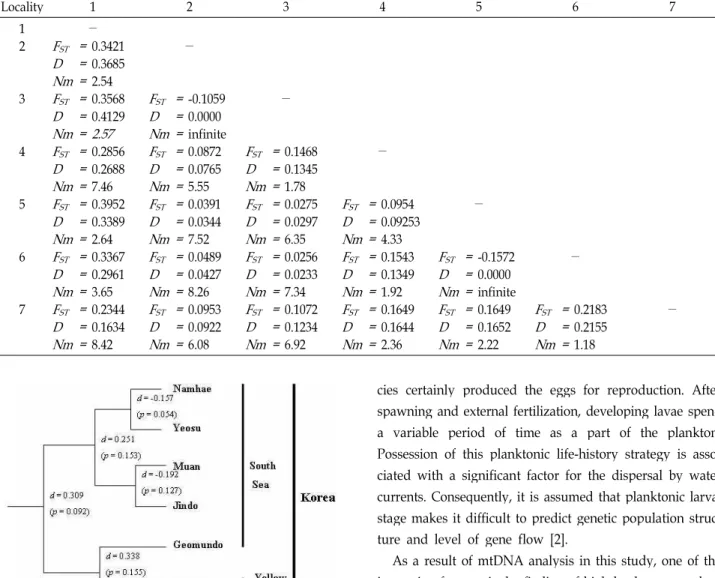
Genetic structure
Hierarchical analysis to test geographic relationships
among populations is presented in Fig. 6. The six Korean
populations were structured into two groups: Namahe,
Yeosu, Muan, Jindo, and Geomundo, Seosan, but these two
groups were not separated based on statistical significance
(p=0.092). No statistically significant structuring was found
between Korean populations. Moreover, there was no sig-
nificant structuring between the Korea and China
populations. Genetic distance in some nodes was negative
(e.g., -0.157 between Namhae and Yeosu, -0.192 between
Muan and Jindo) this is effectively zero, suggesting that
the octopus in those regions appear to form one large ge-
netic group.
Table 5. Mitochondrial 16S gene sequence of genetic distance (
F
ST), coancestry coefficient (D
) and per generation female migration rate (Nm
) of each localityLocality 1 2 3 4 5 6 7
12
3 4 5 6 7
F
ST=
-0.3421D =
0.3685Nm =
2.54F
ST=
0.3568D =
0.4129Nm = 2.57 F
ST=
0.2856D =
0.2688Nm =
7.46F
ST=
0.3952D =
0.3389Nm =
2.64F
ST=
0.3367D =
0.2961Nm =
3.65F
ST=
0.2344D =
0.1634Nm =
8.42-
F
ST=
-0.1059D =
0.0000Nm =
infiniteF
ST=
0.0872D =
0.0765Nm =
5.55F
ST=
0.0391D =
0.0344Nm =
7.52F
ST=
0.0489D =
0.0427Nm =
8.26F
ST=
0.0953D =
0.0922Nm =
6.08-
F
ST=
0.1468D =
0.1345Nm =
1.78F
ST=
0.0275D =
0.0297Nm =
6.35F
ST=
0.0256D =
0.0233Nm =
7.34F
ST=
0.1072D =
0.1234Nm =
6.92-
F
ST=
0.0954D =
0.09253Nm =
4.33F
ST=
0.1543D =
0.1349Nm =
1.92F
ST=
0.1649D =
0.1644Nm =
2.36-
F
ST=
-0.1572D =
0.0000Nm =
infiniteF
ST=
0.1649D =
0.1652Nm =
2.22-
F
ST=
0.2183D =
0.2155Nm =
1.18-
Fig. 6. Hierarchical relationships among localities using the Holsinger and Mason-Gamer method [9]. The value at each node is the distance between its two daughter no- des and the
p
value is the significance of differentiation based on 1,000 random re-samplings.Discussion
A broad study of biology of the octopus concerning as- pects of its physiology, behavior, growth and reproduction has made much progress over the decades [8,14,16,17,21,22].
The specimen for these studies was O. vulgaris occurring in European waters instead of O. minor in Korean coasts.
Consequently, the biological magnitude in O. minor com- pared with O. vulgaris was poorly understood, but this spe-
cies certainly produced the eggs for reproduction. After spawning and external fertilization, developing lavae spend a variable period of time as a part of the plankton.
Possession of this planktonic life-history strategy is asso- ciated with a significant factor for the dispersal by water currents. Consequently, it is assumed that planktonic larval stage makes it difficult to predict genetic population struc- ture and level of gene flow [2].
As a result of mtDNA analysis in this study, one of the interesting features is the finding of high haplotype numbers within local populations. On the other hand, a O2 haplotype was represented as a major one on Korea and China coasts in terms of frequency (a total of 39.4%) and distribution (several localities throughout Korea and China). It is under- stood that a strong movement of this haplotype is possibly associated with a high genetic relatedness, resulting in a ho- mogenous population between Yeosu/Namhae and Muan/
Jindo based on the F
STanalysis. Avise et al. [3] proposed five different distribution patterns of mtDNA clones. Among them category I is one that possesses distinct clones geo- graphically separated. The octopus obtained from Korea and China revealed two distinct mtDNA clades (clades A and B) with the minimum sequence divergence of 0.4% (Fig. 5).
Clade A is distributed in the south-central and western part
of Korea such as Yeosu, Namhae, Muan and Jindo. Clade
B showed a somewhat lengthy distribution occupying the
southeastern part of Korea including Geomundo and the east-central part of China. It clearly showed a discontinuous distribution between two clades with a substantial sequence divergence. Our genetic data appear to show the category I of the phylogeographic pattern described by Avise et al.
[1,3]: phylogenetically discontinuous clones, geographically separated. Avise et al. [3] explained the occurrence of class I category to the presence of a long-term external barrier against gene flow or extinction of the intermediate geno- types connecting each clade in a species with a limited dispersal. We previously studied to differentiate Korean from Chinese octopus inferred from mtDNA COI gene using the PCR method and suggested that Korean populations (Yeosu, Namhae, Muan and Jindo) had a relatively high ge- netic similarity [12]. These results assure us that the geo- graphical distance between populations is associated with increasing gene flow for larval dispersal and have a high genetic relatedness. On a more local scale, if the larvae pas- sively drift over a long distance, they should overcome envi- ronmental differences to become successfully matur the octopus. The long dispersed larvae may undergo the process of competitive exclusion. Our current genetic data support low genetic distance and high gene flow among localities (Yeosu, Namhae, Muan and Jindo), whereas Seosan, Geomundo and Sandong are differentiated from these pop- ulations (d=0.309), although statistically significant genetic differentiation was not observed.
In conclusion, the analysis of mtDNA 16S gene sequences of the octopus to understand population genetic structure of the species showed that the octopus populations in Yeosu, Namhae, Muan and Jindo were highly interconnected. It is suggested that adjacent populations contribute to easily ex- change migrants and planktonic dispersal between localities is associated with geographic distance.
Acknowledgement
This work was funded by a grant from the National Fisheries Research and Development Institute (RP-2009- FR-004).
References
1. Avise, J. C. 1989. Gene trees and organismal histories: a phylogenetic approach to population biology.
Evolution
43, 1192-1208.2. Avise, J. C. 1994. pp. 511,
Molecular markers, natural history,
and evolution
. Chapman and Hall. New York.3. Avise, J. C., J. Anold, R. M. Ball, E. Bermingham, T. Lamb, J. E. Neigel, C. A. Reeb, and N. C. Saunders. 1987.
Intraspecific phylogeography: the mitochondrial DNA bridge between population genetics and systematics.
Annu.
Rev. Ecol. Syst
. 18, 489-522.4. Excoffier, L., P. E. Smouse, and J. M. Quattro. 1992. Analysis of molecular variance inferred from metric distances among DNA haplotypes: application to human mitochondrial DNA restriction data.
Genetics
131, 479-491.5. Felsenstein, J. 1993.
PHYLIP (Phylogeny Inference Package) ver.
3.5c
. Department of Genetics, University of Washington, Seattle.6. Grant, W. S., A. M. Clark, and B. W. Bowen. 1998. Why restriction fragment length polymorphism analysis of mi- tochondrial DNA failed to resolve sardine (
Sardinops
) bio- geography: insights from mitochondrial DNA cytochrome b sequences.Can. J. Fish Aqua. Sci
. 55, 2539-2547.7. Harley, E. H., D. P. Ohland, and P. B. Best. 1995. Systematics of Cetaceans using restriction site mappling of mitochon- drial DNA.
Mol. Phylo. Evol
. 4, 10-19.8. Hernadez-Garcia, V., J. L. Hernadez-Lopez, and J. J.
Castro-Hdez. 2002. On the reproduction of
Octopus vulgris
off the coast of the Canary Islands.Fish Res
. 57, 197-203.9. Holsinger, K. E. and R. J. Mason-Gamer. 1996. Hierarchical analysis of nucleotide diversity in geographically structured populations.
Genetics
142, 629-639.10. Inoue, J. G., M. Masaki, K. Tsukamoto, and M. Nishida.
2000. Complete mitochondrial DNA sequence of the Japanese sardine
Sardinops melanostictus
.Fish Sci
. 66, 924-932.11. Jung, J. M. and D. S. Kim. 2001. Influence of sea condition on catch fluctuation of long line for common octopus,
Octopus variddilis
in the coastal waters of Yeosu.Bull. Kor.
Soc. Fish Tech
. 37, 321-325.12. Kim, J. I., T. Y. Oh, W. S. Yang, and E. S. Cho. 2008.
Development of molecular marker to distinguish
Octopus minor
Sasaki caught in Korea and that in China.J. Life Sci
. 18, 284-286.13. Kimura, M. 1980. A simple method for estimating evolu- tionary rate of base substitution through comparative stud- ies of nucleotide sequences.
J. Mol. Evol
. 116, 111-120.14. McQuaid, C. D. 1994. Feeding behaviour and selection of bivalve prey by
Octopus vulgaris
Cuvier.J. Exp. Mar. Biol.
Ecol
. 177, 187-202.15. Nei, M. 1987. pp. 512,
Molecular Evolutionary Genetics
. Columbia Univ. Press, New York, NY.16. Quetglas, A., M. Gonzalez, and I. Franco. 2005. Biology of the upper-slope cephalopod
Octopus salutii
from the west- ern Mediterranean Sea.Mar. Biol
. 146, 1131-1138.17. Quetglas, A., M. Gonzalez, A. Carbonell, and P. Sanchez.
2001. Biology of the deep-sea octopus
Bathypolypus sponsalis
(Cephalopoda: Octopodidae) from the western Mediterranean Sea.Mar. Biol
. 138, 785-792.18. Reynolds, J., B. S. Weir, and C. C. Cockerham. 1983.
Estimation for the coancestry coefficient: basis for a
short-term genetic distance.
Genetics
105, 767-779.19. Saitou, N. and M. Nei. 1987. The neighbor-joining method:
A new method for reconstructing phylogenetic trees.
Mol.
Biol. Evol
. 4, 406-425.20. Schneider, S., J. M. Kueffer, D. Roessli, and L. Excoffier.
1996.
Arlequin:
a software package for population genetics.Genetics and Biometry Lab., Department of Anthropology, University of Geneva.
21. Smale, M. J. and P. R. Buchan. 1981. Biology of
Octopus vulgaris
off the East coast of South Africa.Mar
.Biol
. 65, 1-12.22. Smith, C. D. 2003. Diet of
Octopus vulgaris
in False bay, South Africa.Mar. Biol
. 143, 1127-1133.23. Sweijd, N., A. Lopata, R. Bowie, T. Marinaki, P. Cook, and E. Harley. 1998. A PCR technique for forensic species level identification of abalone tissue.
J. Shell. Res
. 17, 889-896.24. Thomson, J. D., D. G. Higgins, and T. J. Gibson. 1994.
Clustal W: Improving the sensitivity of progressive multiple sequence alignment through sequence weighting, posi- tion-specific gap penalities and weight matrix choice.