UHF와 S밴드 레이더 관측망 구축
김박사*ㆍ김광호**ㆍ베흐나 깡삐스트홍***ㆍ윤홍주****ㆍ권병혁*****
UHF and S-Band Radar Networks
Park-Sa Kim
*ㆍKwang-Ho Kim
**ㆍBernard Campistrom
***ㆍHong-Joo Yoon
****ㆍByung-Hyuk Kwon
*****요 약
복잡한 기상을 예측하기 위해 레이더와 윈드프로파일러 네트워크의 품질을 평가하였다. 한반도 전역에 걸쳐 배치되어 있는 UHF 도플러 윈드프로파일러와 도플러 기상 레이더는 조밀한 공간 해상도의 관측망을 형성한다.
레이더 네트워크는 3차원 역학 자료를 도출하고, 작은 규모와 중간 규모의 수치 모델 출력 자료를 분석할 수 있 다. 이러한 고해상도의 관측 연구는 세계 어느 곳에서도 수행되지 않았다. 관측망 분석 결과는 수치 모델링에 근 거한 배경 바람장과 일치하였다. 본 연구는 국지 기상뿐만 아니라 악기상 예측에 도움이 될 것이다.
ABSTRACT
The quality of the radar and profiler network was estimated to forecast difficult meteorological situations. A network of UHF Doppler wind profilers and Doppler weather radars have been deployed all over the Korean Peninsular, with dense spatial resolution between instruments. The radar network allows to retrieve the three dimensional dynamics and to analyze the numerical model outputs at small and meso scales. This work has seldom been performed in any other place of the world, with such a high resolution. The wind field from radar network is a good agreement with the background wind fields based on the numerical modeling. This study will be helpful to forecast severe weathers as well as local meteorological phenomena.
키워드
Wind Profiler Radar, S-Band Doppler Radar, Quality Control, Wind Vector, Radar Network 윈드 프로파일러 레이더, S밴드 도플러 레이더, 품질 관리, 바람 벡터, 레이더망
* 부경대학교 지구과학연구소([email protected])
** 기상청 기상레이더센터([email protected])
*** 프랑스 대기과학연구소([email protected])
**** 부경대학교 공간정보시스템공학과([email protected])
***** 교신저자 : 부경대학교 환경대기과학과 ㆍ접 수 일 : 2018. 03. 12
ㆍ수정완료일 : 2018. 03. 29 ㆍ게재확정일 : 2018. 04. 15
ㆍReceived : Mar. 12, 2018, Revised : Mar. 29, 2018, Accepted : Apr. 15, 2018 ㆍCorresponding Author : Byung-Hyuk Kwon
Dept. of environmental atmospheric sciences, Pukyong National University, Email : [email protected]
Ⅰ. Introduction
The Korean peninsula centered on east longitude 128°, between north latitudes 33° and 40°, is bordered by the Yellow Sea, East Sea, northern China, and southern Siberia. This disposition
induces a subtropical humid climate with four well distinct seasons. Spring and autumn are mild and temperate whereas summer and winter frequently undergo some sudden and violent phenomena[1-2]:
frequent precipitation events with flash floods and
landslides or typhoons during the monsoon in
http://dx.doi.org/10.13067/JKIECS.2018.13.2.305
summer (that brings warm and moist southerly air), or blizzard and snow storms linked to the continental area during winter. These events are highly devastating, and difficult to forecast[3-4] in terms of intensity, timing and location, especially in this peninsula of highly variable orography impinged by marine air masses on nearly every sides.
That is why Korea Meteorological Administration (KMA) has made an important effort to implement efficient and reliable numerical models, supported by a wealth of observation networks. Among those, ground radars such as UHF wind profilers, or Doppler weather radars that are able to observe continuously the troposphere with a fine time and spatial resolution, are particularly suitable to fulfill this requirement[5]. UHF wind profilers and radiosonde are also used to estimate atmospheric boundary layer height which is important for model initial input data[6-7]. The four numerical models (global, synoptic and two regional) are operated by KMA for forecast and analysis. Results of the Weather Research and Forecasting (WRF) model are used here. With nearly 31% of false forecasting rate, heavy rainfall has the worst score. We expect that an improvement of the forecast involves a better use of all the products derived by observation networks. The aim of the present work is to estimate the quality of the radar and profiler network to forecast difficult meteorological situations. The good spatial resolution allows to retrieve the three dimensional dynamics and compare to the models, at small and meso scales, which has seldom been performed in any other place of the world, with such a high resolution.
Ⅱ. Instruments and Data
During the last fifteen years, a network of 10 UHF Doppler wind profilers and 11 Doppler weather radars (8 in the S-band and 3 in the
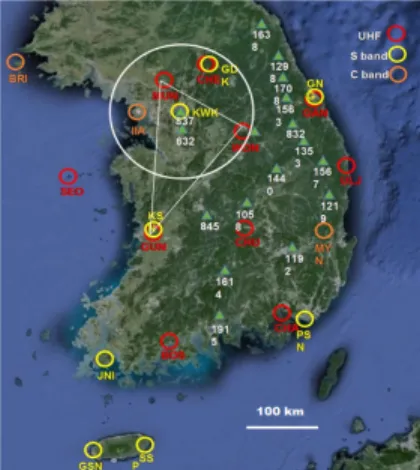
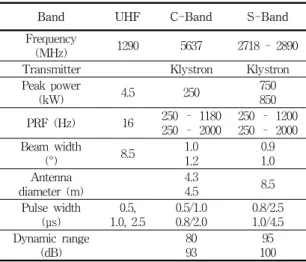
C-band) have been deployed all over South Korea, with an average spacing better than 150 km between instruments, as shown in Fig. 1. Table 1 gives the main characteristics of the radars and profilers.
Fig. 1 Weather radars and UHF profiler networks. The white triangle and circle stand for the comparison zone
The profilers are the five-antenna PCL1300 Degreane radars (Fig. 2) working with a 1,290 MHz transmitted frequency in clear air or raining conditions. The typical performances are as follows:
a vertical coverage of 4 km (much more during precipitation), vertical and temporal resolution of 100 m and collection cycle of 5 minute respectively.
With wind velocity profiles, they can also provide quantitative estimates of rain, of turbulence and on the altitude of the atmospheric boundary layer.
They are operated in a continuous mode with a data collection cycle in five minute.
Even if they detect echoes from clear air (mainly
insect scattering), the main source of weather radar
is precipitation. Radars have the same continuous
operating mode based on data collection cycle of 10
minutes duration. The cycle is composed of 10 to
15 PPI scans at different elevations. The horizontal
data acquisition is limited to a radial range of 250
km with data gate spaced by 200 m. The Volume
Velocity Processing (VVP) method is used to
Band UHF C-Band S-Band Frequency
(MHz) 1290 5637 2718 - 2890
Transmitter Klystron Klystron
Peak power
(kW) 4.5 250 750
850
PRF (Hz) 16 250 – 1180
250 – 2000
250 – 1200 250 – 2000 Beam width
(°) 8.5 1.0
1.2
0.9 1.0 Antenna
diameter (m)
4.3
4.5 8.5
Pulse width (μs)
0.5, 1.0, 2.5
0.5/1.0 0.8/2.0
0.8/2.5 1.0/4.5 Dynamic range
(dB)
80 93
95 100
retrieve the wind from vertical profiles of the radial velocity assuming horizontal linearity of the wind fields[8].
Table 1. Characteristics of the weather radars and the wind profiler
The Weather Research and Forecasting (WRF) Model is an atmospheric model designed, as its name indicates, for both research and numerical weather prediction (NWP). WRF has grown to provide specialty capabilities for a range of Earth system prediction applications, such as air chemistry, hydrology, wildland fires, hurricanes, and regional climate[9]. It is widely used for both studying as well as forecasting a variety of high-impact meteorological events, such as rainfall, tropical cyclones and thunderstorms[10].
Fig. 2 Five-beam UHF wind profiler
III. Results
3.1 Comparison between S-band radar and wind profilers
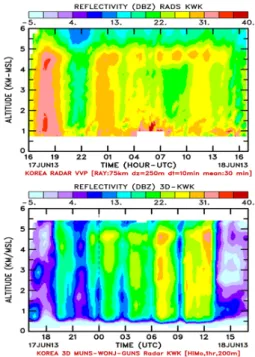
On 17 and 18 June 2013, a long lasting monsoon rain crossed Korean peninsula as shown on the composite reflectivity image. Figure 3, 4 and 5 present time-height sections of parameters (reflectivity, wind speed and vertical wind velocity, respectively) deduced from the S-band weather radar KWK (Kwanaksan radar) and from the triangle of UHF profilers (Munsan-Wonju-Gunsan).
The VVP technique was used to deduce vertical profiles of parameters of wind field and reflectivity under the assumption of horizontal and vertical linearity. This assumption was supposed to be fulfilled in horizontal cylindrical slices of 250 m depth and within a radial distance of 75 km (see Fig. 1). The same assumption of linearity of the field was also used for the triangle formed by the profilers Munsan, Wonju and Gunsan (see Fig. 1) for cylindrical slices of 200 m depth. For the profilers the assumption of linearity was extended to time within one hour interval.
The method is able to retrieve not only vertical profiles of wind and reflectivity but also profiles of second order quantities such as horizontal divergence and vertical vorticity. In fact, only the profiler triangle allows to derive vertical vorticity.
Upward vertical integration of the divergence under
anelastic assumption and null air vertical velocity at
the ground permits to deduce vertical velocity
profiles (Fig. 5). All the quantities presented in the
figures are projected at the vertical of the site of
the KWK radar.
Fig. 3 Time-height sections of reflectivity from the observation of KWK S-band radar (top) and from the
triangle MUNS-WONJ-GUNS UHF wind profilers projected over KWK site (bottom)
The S-band reflectivity section in Fig. 3 with values greater than 10 dBz shows clearly the presence of precipitation in the scanning area all along the presented 24 hours with a bright band located at 4.5 km altitude. At the beginning and end of this event, reflectivity lower than 0 dBz for the profilers indicates the predominance of clear air echoes and so rain scarcity.
The comparison between S-band weather radar and profilers observation is rather satisfactory. The main discrepancy is for stronger absolute divergence values for the weather radar at the end of the event that can be explained by a very heterogeneous and reduced rain domain nearby the weather radar. Note that neither profilers measurement nor weather radar data were assimilated in the model.
Fig. 4 Same as Fig. 3 but for horizontal wind velocity
Fig. 5 Same as Fig. 3 but for vertical wind velocity
3.2 Comparison between numerical model and wind profilers
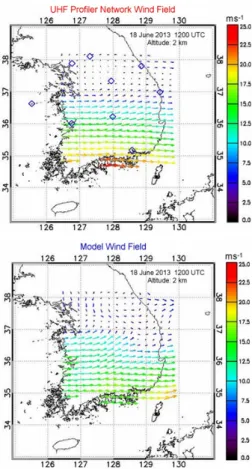
Figure 6 presents an example of comparison of
wind field deduced from the profiler network and
predicted by a numerical modeling. The evaluation is made for an horizontal plane at 2 km altitude on June 18
th, 2013 at 1200 UTC. The parameters presented are wind vector, horizontal divergence and vertical vorticity. The meteorological situation corresponds to the monsoon rainy period already analyzed in the section above. In Fig. 6, the latitudinal change of the wind regime allows us to situate the monsoon front along 37°N.
Fig. 6 Comparison between wind field deduced from the profiler network and forecasted by the numerical model in an horizontal plane at 2 km altitude for the day June
18
th, 2013 at 1200 UTC
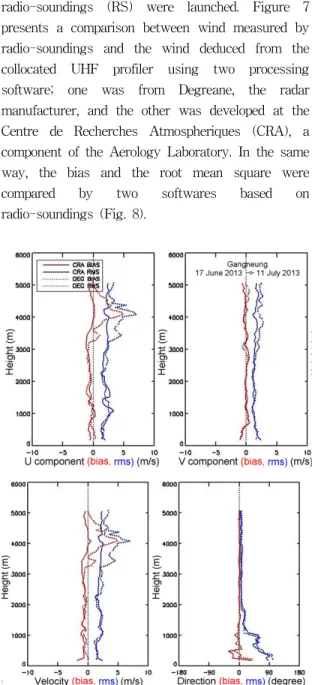
Fig. 7 Comparison between radio-sounding wind (blue) and wind obtained by a UHF profiler with CRA processing software (red) and with Degreane software
(green). Radar data were averaged over one hour
The WRF model used here worked with the
main characteristics and neither profilers
measurement nor weather radar data were
assimilated in the model. The retrieval of wind field
by the profiler network was explained in the
section above. Local and temporal linearity of the
wind field is the main assumption of the retrieval
method. The network domain is decomposed into
contiguous triangles defined by profilers at the
vertex. Wind field is computed independently in
each triangle. In particular, divergence and vorticity
values are constant inside a triangular domain.
3.3 Comparison between radio-soundings and wind profilers
A special UHF profiler evaluation campaign was held from June 17
thuntil July 11
th2013 on the site of Gangneung. During this 25 days period 27 radio-soundings (RS) were launched. Figure 7 presents a comparison between wind measured by radio-soundings and the wind deduced from the collocated UHF profiler using two processing software; one was from Degreane, the radar manufacturer, and the other was developed at the Centre de Recherches Atmospheriques (CRA), a component of the Aerology Laboratory. In the same way, the bias and the root mean square were compared by two softwares based on radio-soundings (Fig. 8).
Fig. 8 Statistical evaluation (bias and root mean square) of UHF profiler accuracy based on radio-soundings
launched during 25 days at Gangneung
IV. Conclusions
This work followed an important development in the algorithms used to process data of wind profilers and weather radars collected by the KMA.
The objective was to be able to retrieve wind characteristics and 2
ndorder parameters such as horizontal divergence and vertical vorticity, at a spatial scale both matching the regional scale of the model and describing the local heterogeneities linked to the relief, and a time scale able to retrieve the sudden change in the meteorological conditions in case of strong, violent and dangerous events. To fulfill this aim, the profilers were used as a network to provide the 3D characteristics of the wind. The method is assessed in this study, by (i) comparing the dynamical characteristics of a network limited to 3 profilers, to these of an S-band radar located in the vicinity, (ii) comparing the dynamics obtained from a set of juxtaposed profiler triangles with first and second order parameters forecasted by the KMA regional model, and (iii) a direct comparison between the profiler individual profiles and radio-soundings measurements performed at the same location. The results are satisfactory and encouraging. They will allow to make process studies of intense meteorological events. They will also provide to the KMA, a wealth of observations to be assimilated, to be able to forecast tricky situations such as heavy rains or snow events.
감사의 글
This work was funded by the Korea Meteorolo
gical Administration Research and Development
Program under Grant KMIPA 2015-5030.
References
[1] G. Choi, “Spatio-Temporal Changes in Seasonal Extreme Temperature Events in the Republic of Korea,” J. of the Korean Geographical Society, vol.
49, no. 4, 2014, pp. 489-508.
[2] S. An, K. Ha, K. Seo, S. Yeh, S. Min, and C.
Ho, “A Review of Recent Climate Trends and Causes over the Korean Peninsula,” J. of Climate Change Research, vol. 2, no. 4, 2011, pp. 237-251.
[3] B. Kim, B. Kim, and H. Kim, “On the change of extreme weather event using extreme indices,” J.
of the Korean Society of Civil Engineers, vol. 28, no. 1B, 2008, pp. 41-53.
[4] National Institute of Meteorological Research, Development of forecast guidance for heavy rainfall due to the meso-scale convection system, Research Report, MR072F50, 2007.
[5] T. Kim, D. Lee, and H. Kwon, “Assessment of merging weather radar precipitation data and ground precipitation data according to various interpolation method,” J. of Korea Water Resources Association, vol. 50, no. 12, 2017, pp. 849-862.
[6] S. Kim, B. Kwon, K. Kim, P. Kim, M. Kim, W.
Jo, and H. Yoon, “Case study on the mixed layer development using the UHF radio sounding,” J. of the Korea Institute of Electronic Communication Sciences, vol. 13, no. 1, 2018, pp.
253-264.
[7] M. Kim, B. Kwon, and H. Yoon, “Estimation of surface layer heat flux using the UHF sensor installed on UAV,” J. of the Korea Institute of Electronic Communication Sciences, vol. 13, no. 1, 2018, pp. 265-276.
[8] P. Waldteufel and H. Corbin, “On the Analysis of Single-Doppler Radar Data,” J. of Applied Meteorology, vol. 18, no. 4, 1979, pp. 532-542.
[9] J. Powers and Coauthors, “The weather research and forecasting model: overview, system efforts, and future directions,” Bulletin of the American Meteorological Society, vol. 98, no. 8, 2017, pp.
1717-1737.
[10] I. Chawla, K. Osuri, P. Mujumdar, and D.
Niyogi, “Assessment of the Weather Research and Forecasting (WRF) model for simulation of extreme rainfall events in the upper Ganga Basin,” Hydrology and Earth System Sciences, vol.
22, no. 2, 2018, pp. 1095-1117.
저자 소개
김박사(Park-Sa Kim)
2010년 부경대학교 환경대기과학 과 졸업(이학사)
2012년 부경대학교 일반대학원 지구환경시스템과학부 환경대기 과학 전공 졸업(이학석사) 2014년 부경대학교 일반대학원 지구환경시스템과 학부 환경대기과학 전공 박사과정 수료
2014년∼현재 부경대학교 지구과학연구소 전임연구원
※ 관심분야 : 대기과학, 미기상학
김광호(Kwang-Ho Kim)
2007년 부경대학교 환경대기과학 과 졸업(이학사)
2009년 부경대학교 일반대학원 환경대기과학과 졸업(이학석사) 2015년∼2017년 부경대학교 지구과학연구소 전임연 구원
2017년 부경대학교 일반대학원 지구환경시스템과 학부 환경대기과학 전공(이학박사)
2017년∼현재 기상청 기상레이더센터 연구원
※ 관심분야 : 미기상학, 레이더기상학
Bernard Campistron1982년 Professor Université de Paul Sabatier
1987년 Centre National de la R echerche Scientifique, France 1980∼현재 Centre de Recherche s Atmospheriques
※ 관심분야 : 대기과학, 원격탐사
윤홍주(Hong-Joo Yoon)
1983년 부경대학교 해양공학과 졸업(공학사)
1985년 부경대학교 대학원 해양 학과 졸업(공학석사)
1997년 프랑스 그르노블 I 대학교 대학원 위성원 격탐사전공 졸업(공학박사)
1999년∼2002년 여수대학교 해양공학과 교수 2002년∼현재 부경대학교 공간정보시스템공학 교수 2012년∼2013년 부경대학교 공간정보연구소 초대 소장
2013년 (사)한국클라우드센터럴파크 이사 2014년 한국전자통신학회 부회장 2015년 공간정보 Big Data 센터장 2015년 행정공간정보화연구소 소장 2016년 (사)한국생태공학회 회장
※ 관심분야 : 해양 원격탐사, GIS
권병혁(Byung-Hyuk Kwon)