The Journal of the Convergence on Culture Technology (JCCT)
Vol. 5, No. 4, pp.413-420, November 30, 2019. pISSN 2384-0358, eISSN 2384-0366
- 413 -
*정회원, 한국한의학연구원 책임연구원 (제1 및 교신저자) (충북대학교 전자계산학과 공학박사졸업)
접수일: 2019년 9월 15일, 수정완료일자: 2019년 10월 14일 게재확정일자: 2019년 10월 20일
Received: September 15, 2019 / Revised: October 14, 2019 Accepted: October 20, 2019
*Corresponding Author: bjlee@kiom.re.kr
Dept. of Future Medicine Division, Korea Institute of Oriental Medicine, Korea
머신러닝 기반 체지방 측정정보를 이용한 고콜레스테롤혈증 예측모델
Prediction model of hypercholesterolemia using body fat mass based on machine learning
이범주*
Bum Ju Lee*
요 약 본 연구의 목적은 기존의 body fat mass 변수와 고콜레스테롤혈증의 연관성연구를 벗어나, 머신러닝기법을 기 반으로 body fat mass 변수들의 조합을 이용하여 고콜레스테롤혈증 예측 모델을 개발하는 것이다. 이러한 연구를 위 하여 국민건강영양조사 데이터를 기반으로 두 가지 variable selection 메소드와 머신러닝 알고리즘을 이용하여 총 6 개의 모델을 생성하였고 질병 예측력을 비교분석하였다. 여러 body fat mass 관련 변수들 중에서 몸통지방량 변수가 고콜레스테롤혈증 예측력이 가장 우수한 변수인 것을 밝혀내었고, 머신러닝 기반 예측모델들 중에서 correlation-based feature subset selection 기반 naive Bayes 알고리즘을 이용한 모델이 0.739의 the area under the receiver operating characteristic curve 값과 0.36의 Matthews correlation coefficient 값을 얻었다. 이러한 연구의 결과는 향후 국내외 대규모 스크리닝 및 대중보건 연구에서 질병예측분야의 중요정보로 활용될 것으로 예상 한다.
주요어 : 머신러닝, 데이터마이닝, 예측모델, 콜레스테롤, 고콜레스테롤혈증, 고콜레스테롤, 체지방
Abstract The purpose of the present study is to develop a model for predicting hypercholesterolemia using an integrated set of body fat mass variables based on machine learning techniques, beyond the study of the association between body fat mass and hypercholesterolemia. For this study, a total of six models were created using two variable subset selection methods and machine learning algorithms based on the Korea National Health and Nutrition Examination Survey (KNHANES) data. Among the various body fat mass variables, we found that trunk fat mass was the best variable for predicting hypercholesterolemia. Furthermore, we obtained the area under the receiver operating characteristic curve value of 0.739 and the Matthews correlation coefficient value of 0.36 in the model using the correlation-based feature subset selection and naive Bayes algorithm. Our findings are expected to be used as important information in the field of disease prediction in large-scale screening and public health research.
Key words :Machine learning, Data mining, prediction model, Cholesterol, Hypercholesterolemia, High cholesterol, Body fat mass
http://dx.doi.org/10.17703/JCCT.2019.5.4.413
JCCT 2019-11-52
Prediction model of hypercholesterolemia using body fat mass based on machine learning
- 414 -
Ⅰ. 서 론
고콜레스테롤혈증(hypercholesterolemia)은 죽상경화 증의 발달에 매우 높은 영향을 미치는 질병으로써 심혈 관 질환들에 대한 주요 요인으로 작용하고 있다 [1, 2].
가족성 고콜레스테롤혈증 (familial
hypercholesterolemia)은 약 250명 중 한 명 정도로 발 생하며 유전적인 요인이 매우 높을 뿐만아니라, 이러한 환자들은 LDL 콜레스테롤이 상승하고 죽상 동맥경화 성 심혈관 질환이 촉진되는 경향이 있다 [3].
신체 지방량 및 제지방량과 같은 body fat mass 정 보와 body mass index (BMI), 복부둘레 (waist circumference), 복부 둘레와 키의 비율 (waist to height ratio)과 같은 인체계측정보 (anthropometry)는 대사성질환, 당뇨, 심혈관질환, 암 등과 매우 밀접한 연 관성을 지니고 있다고 알려져 있다 [4-12
]
. 예를 들어, 당뇨와 body fat mass와의 연구에서 Vasan et al. [13]은 다리의 지방 (leg fat)이 2형 당뇨와 매우 연관성이 높다는 것을 주장하였고, 몇몇의 연구에서는 당뇨를 식 별 또는 예측하는데 있어서 신체 지방량보다는 복부 지 방량이 더 높은 연관성 또는 식별력을 나타낸다고 주장 하였다 [11, 14-16]. 또한 신체 지방 퍼센테이지(body fat percentage), 체지방 지수 (fat mass index), 제지방 량(fat-free mass) 및 BMI를 이용하여 심혈관 질환을 예측하는 연구도 수행되었다 [17].
최근 머신러닝 및 데이터마이닝은 의학/생물학분야 에서 질병 예측 및 식별을 위한 연구에 널리 사용되고 있다[6-9, 18]. 예를 들어, 여러 머신러닝 기법을 기반으 로 인체계측정보를 이용한 serum high-density (HDL) lipoprotein 콜레스테롤과 low-density lipoprotein (LDL) 콜레스테롤 예측 연구가 수행되어졌으며 [6], 고중성지방혈증 예측 모델에 관한 연구도 보고되었다 [7]. 이러한 연구들은 최근 인공지능 (artificial intelligence)을 기반으로 한 질병 예측 및 식별 연구로 까지 진행되고 있다.
한편 근래에 이르러 dual-energy x-ray absorptiometry (DEXA) 기술의 발달로 인하여 기존 BMI, 복부둘레, 엉덩이둘레, 복부와 키의 비율 등의 인체 계측정보를 넘어서, 체지방 및 제지방과 콜레스테롤 수 치와의 연관성을 탐색하는 연구들이 진행되고 있다. 이 러한 연구들은 body fat distribution 또는 fat mass 측정
값이 total cholesterol과 매우 연관성이 높다는 연구결과 를 제시하였고, 아울러 fat mass 수치가 높으면 고콜레스 테롤혈증의 위험요인이 증가한다는 연구가 수행되었다 [19-22]. 예를 들어 Wiklund의 연구 [22]에서는 복부의 fat mass/골반의 fat mass 비율뿐만 아니라 복부 fat mass/total fat mass의 비율이 콜레스테롤 수치와 상관 성이 높은 것다는 것을 밝혀내었고, 특히 여자보다는 남 자에서 이러한 상관성이 더욱 높다는 연구결과를 발표하 였다. 그러나, 이러한 연구들은 각각의 fat mass 변수들 과 콜레스테롤 수치 또는 고콜레스테롤혈증과의 연관성 분석에 한정된 연구만을 수행하였다. 아울러, 이러한 수 많은 연구들에도 불구하고, 아직까지 머신러닝을 기반으 로 고콜레스테롤혈증을 예측할 수 있는 모델에 대한 연 구는 전 세계적으로 찾아보기 어렵다. 따라서, 본 논문에 서는 기존의 체지방 변수와 콜레스테롤 수치와의 연관성 에 대한 연구가 아니라, 체지방 변수들을 기반으로 머신 러닝 기법을 이용하여 고콜레스테롤혈증 예측 모델을 개 발하는 것을 목적으로 한다. 이러한 연구결과는 대중보 건 및 대규모 건강 스크리닝 분야에서 다양한 질병 예측 분야에 공헌할 수 있으리라 예상한다.
Ⅱ. 메소드
1. 데이터 셋
본 연구는 한국한의학연구원 IRB 승인을 받아 진행하였 고(IRB No. I-1909/007-003), 사용된 데이터는 국민건강영 양조사 2008-2011년 자료를 이용하였다 [23]. 제공된 데이 터의 전처리와 샘플 선별에 있어서, 원시자료의 전체 샘플 수 37,753개 중에서 체지방변수, 콜레스테롤 수치, 혈액 수치, 키, 몸무게 등 고콜레스테롤혈증과 연관성이 있는 변수들 중 널 값을 포함한 샘플들을 제거한 후, 16,305 개의 샘플들이 추출되었고, 이 중에서 positive 샘플과 negative 샘플의 밸런스를 매치하기 위하여 랜덤샘플링 기법으로 질병군 1,000명 (남자 364명, 여자 636명)과 정상군 1000명 (남자 409명, 여자 591명)을 추출하였다.
이러한 사유는 class imbalanced data 문제에 따른 동 일 샘플 수 선정과 총 샘플들 중에서 환자군이 약 1,000 명 정도로 적은 것에 기인한다.
2. 고콜레스테롤혈증(hypercholesterolemia) 정의 고콜레스테롤혈증의 정의는 총콜레스테롤의 수치와
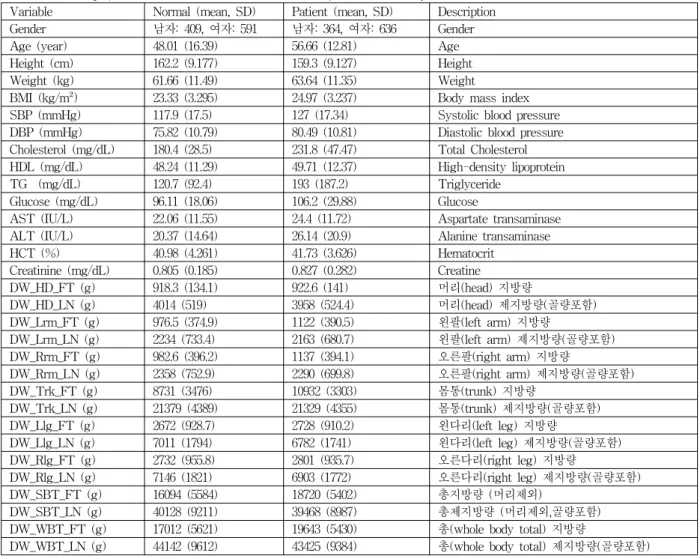
표 1. 실험에 참여한 피험자의 인구학적 정보 및 변수 정보
Table 1. Demographic characteristics and variables of subjects in this study
Variable Normal (mean, SD) Patient (mean, SD) Description
Gender 남자: 409, 여자: 591 남자: 364, 여자: 636 Gender
Age (year) 48.01 (16.39) 56.66 (12.81) Age
Height (cm) 162.2 (9.177) 159.3 (9.127) Height
Weight (kg) 61.66 (11.49) 63.64 (11.35) Weight
BMI (kg/m²) 23.33 (3.295) 24.97 (3.237) Body mass index
SBP (mmHg) 117.9 (17.5) 127 (17.34) Systolic blood pressure
DBP (mmHg) 75.82 (10.79) 80.49 (10.81) Diastolic blood pressure Cholesterol (mg/dL) 180.4 (28.5) 231.8 (47.47) Total Cholesterol HDL (mg/dL) 48.24 (11.29) 49.71 (12.37) High-density lipoprotein
TG (mg/dL) 120.7 (92.4) 193 (187.2) Triglyceride
Glucose (mg/dL) 96.11 (18.06) 106.2 (29.88) Glucose
AST (IU/L) 22.06 (11.55) 24.4 (11.72) Aspartate transaminase
ALT (IU/L) 20.37 (14.64) 26.14 (20.9) Alanine transaminase
HCT (%) 40.98 (4.261) 41.73 (3.626) Hematocrit
Creatinine (mg/dL) 0.805 (0.185) 0.827 (0.282) Creatine
DW_HD_FT (g) 918.3 (134.1) 922.6 (141) 머리(head) 지방량
DW_HD_LN (g) 4014 (519) 3958 (524.4) 머리(head) 제지방량(골량포함)
DW_Lrm_FT (g) 976.5 (374.9) 1122 (390.5) 왼팔(left arm) 지방량
DW_Lrm_LN (g) 2234 (733.4) 2163 (680.7) 왼팔(left arm) 제지방량(골량포함)
DW_Rrm_FT (g) 982.6 (396.2) 1137 (394.1) 오른팔(right arm) 지방량
DW_Rrm_LN (g) 2358 (752.9) 2290 (699.8) 오른팔(right arm) 제지방량(골량포함)
DW_Trk_FT (g) 8731 (3476) 10932 (3303) 몸통(trunk) 지방량
DW_Trk_LN (g) 21379 (4389) 21329 (4355) 몸통(trunk) 제지방량(골량포함)
DW_Llg_FT (g) 2672 (928.7) 2728 (910.2) 왼다리(left leg) 지방량
DW_Llg_LN (g) 7011 (1794) 6782 (1741) 왼다리(left leg) 제지방량(골량포함)
DW_Rlg_FT (g) 2732 (955.8) 2801 (935.7) 오른다리(right leg) 지방량
DW_Rlg_LN (g) 7146 (1821) 6903 (1772) 오른다리(right leg) 제지방량(골량포함)
DW_SBT_FT (g) 16094 (5584) 18720 (5402) 총지방량 (머리제외)
DW_SBT_LN (g) 40128 (9211) 39468 (8987) 총제지방량 (머리제외,골량포함)
DW_WBT_FT (g) 17012 (5621) 19643 (5430) 총(whole body total) 지방량
DW_WBT_LN (g) 44142 (9612) 43425 (9384) 총(whole body total) 제지방량(골량포함)
고콜레스테롤혈증 치료를 위한 약의 복용여부로 결정 하였다. 따라서, 국민건강영양조사 이용지침서에 따라 공복시 총콜레스테롤 ≥240mg/dl or 콜레스테롤 약 복 용에 해당하면 고콜레스테롤혈증 환자군으로 분류하였 고, 그 외 샘플들은 정상군으로 분류되었다 [23].
3. 변수 측정
국민건강영양조사의 체지방 측정은 dual energy X-ray absorptiometry (QDR-4500W fan-beam densitometer, Hologic, Inc., Bedford, USA)로 진행 되었으며, 몸통, 왼다리, 오른다리, 왼팔, 오른팔, 신 체전체 등의 부위별로 지방량 및 제지방량 등을 측 정하였다. 본 연구에 사용된 변수들은 국민건강영양 조사 원시데이터 이용설명서와의 혼동을 피하기 위 하여 변수명을 그대로 사용하였다 [23]. 따라서, 각 변수들에 대한 내용은 DW_부위_FT (부위별 지방
량, fat, g) 및 DW_부위_LN (부위의 제지방량, lean, g)으로 구성되었다 [23]. 세부적인 변수 및 본 연구에 사용된 혈액정보, 신체정보 등의 인구학적 정보는 표 1에 기술되었다.
4. 머신러닝
모델 생성을 위해 본 연구에서는 Waikato Environment for Knowledge Analysis (Weka) 툴 [24]
을 이용하였다. 체지방 관련 각각의 변수들에 대한 고 콜레스테롤혈증 예측력을 비교하기 위하여 binary logistic regression을 사용하여 변수 각각에 대한 the area under the receiver operating characteristic curve (AUC)를 구하였다. 이러한 이유는 의학, 생물학, 및 공 학연구분야에서 예측 및 분류 모델의 주요 성능평가 지 표로 AUC가 주로 사용되기 때문이다. 따라서, 본 연구 에서 개발된 여섯 개의 모델들에서도 AUC를 주요 성
표 2. 변수 각각에 대한 고콜레스테롤혈증 예측 성능 Table 2. Predictive power by each variable
Variable AUC
Age 0.659
DW_HD_FT 0.487
DW_HD_LN 0.533
DW_Lrm_FT 0.606
DW_Lrm_LN 0.516
DW_Rrm_FT 0.614
DW_Rrm_LN 0.516
DW_Trk_FT 0.687
DW_Trk_LN 0.475
DW_Llg_FT 0.512
DW_Llg_LN 0.535
DW_Rlg_FT 0.515
DW_Rlg_LN 0.539
DW_SBT_FT 0.639
DW_SBT_LN 0.516
DW_WBT_FT 0.639
DW_WBT_LN 0.517
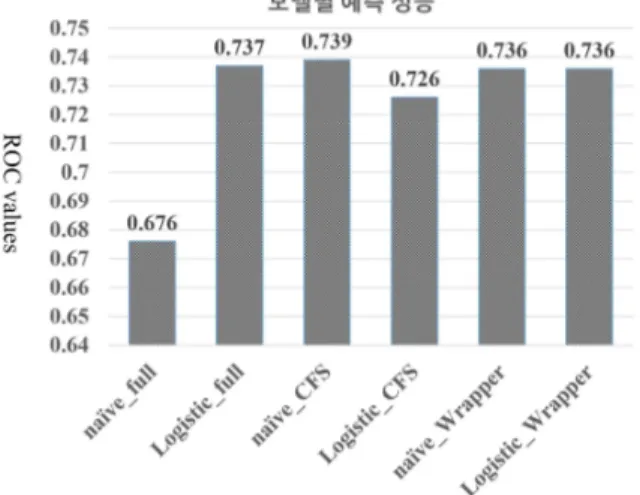
그림 1. 여섯 개 모델의 예측 성능비교 Figure 1. Predictive power of six models 능지표로 선정하였다. 또한 보다 구체적인 성능 분석을
위하여 sensitivity, 1-specificity, F-Measure, Matthews correlation coefficient (MCC)를 제시하였다.
본 연구에서는 최적의 변수 조합을 선별하기 위하여 variable subset selection 메소드를 사용하였다. 이러한 메소드들은 대부분 크게 두 가지로 나뉜다. 필터 방식 은 모델생성 이전에 전처리를 수행하는 동안 변수들을 선별하는 방식이고, wrapper 방식은 분류 알고리즘을 이용하여 그 성능을 측정하면서 변수들을 선별하는 방 식이다[7]. 따라서, 이 논문에서는 이러한 두 가지 방식 중에서 각각 한가지씩의 variable subset selection 메소 드들을 수행하였다. 첫째 메소드는 필터방식인 correlation-based feature subset selection (CFS) [7, 25]를 기반으로 도출한 방법으로써, CFS는 독립변수들 서로간에는 correlation이 낮고 독립변수들과 종속변수 (클래스)간에는 correlation이 높은 변수들의 집합이 우 수한 모델을 생성하는 서브셋이라는 이론으로 생성된 메소드이다 [25]. 따라서, 본 연구에 사용된 모든 변수 들을 기반으로 각 변수들간의 연관성은 낮고 변수와 종 속변수와의 연관성은 높은 변수들의 집합을 도출하였 다. 두 번째 메소드는 변수 추출 방법이 블랙박스라고 불리우는 wrapper 기반의 변수 추출 메소드로써 [7, 26], wrapper를 기반으로 naive Bayes와 logistic regression을 이용하여 변수 집합을 각각 선별하고, 해 당 알고리즘으로 최종 모델을 생성하였다. 변수 서브셋 추출시 서치 방법으로는 BestFirst 방식을 이용하였다.
아울러, 통계 분석을 위해서 SPSS 23 버전 (SPSS, Inc., Chicago, IL, USA)을 이용하여 각 변수들의 평균 과 표준편차를 얻었다.
Ⅲ. 실험결과 및 고찰
1. 실험결과
본 실험에서는 고콜레스테롤혈증 식별을 위하여 변 수 각각에 AUC 값을 도출하여 예측력을 비교하였고, 아울러 전체 변수들에 대하여 variable subset selection 메소드와 두 개의 머신러닝 알고리즘을 기반으로 총 6 개의 모델 (naive_full: naive Bayes 기반 전체변수를 이용한 모델, Logistic_full: logistic regression 기반 전 체변수를 이용한 모델, naive_CFS: naive Bayes 기반 CFS variable subset selection 메소드를 이용한 모델, Logistic_CFS: logistic regression 기반 CFS 메소드를 이용한 모델, naive_Wrapper: naive Bayes 기반 wrapper 메소드를 이용한 모델, Logistic_Wrapper:
logistic regression 기반 wrapper 메소드를 이용한 모 델)을 생성하여 고콜레스테롤혈증 예측력을 비교하였 다.
표 2는 변수 각각에 대한 고콜레스테롤혈증 예측력 비교를 위한 AUC 값을 기술한 것으로서, 모든 변수들 중에서 DW_Trk_FT(몸통지방량)가 고콜레스테롤혈증 을 예측하는데 가장 높은 AUC 값을 나타내었다 (AUC
= 0.687). 두 번째로 위 질병에 대한 예측력이 좋은 변 수는 나이였으며 (ACU = 0.659), 그 뒤를 이어
The Journal of the Convergence on Culture Technology (JCCT)
Vol. 5, No. 4, pp.413-420, November 30, 2019. pISSN 2384-0358, eISSN 2384-0366
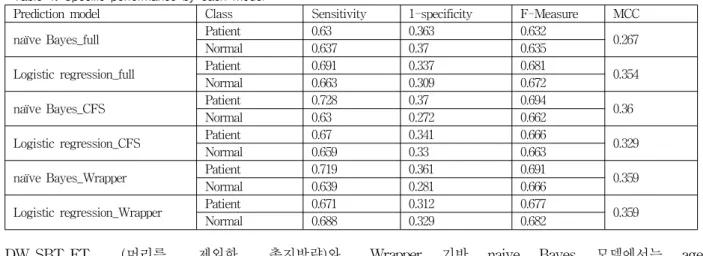
- 417 - 표 3. 여섯 개 예측 모델별 세부 성능 분석
Table 1. Specific performance by each model
Prediction model Class Sensitivity 1-specificity F-Measure MCC
naïve Bayes_full Patient 0.63 0.363 0.632
0.267
Normal 0.637 0.37 0.635
Logistic regression_full Patient 0.691 0.337 0.681 0.354
Normal 0.663 0.309 0.672
naïve Bayes_CFS Patient 0.728 0.37 0.694
Normal 0.63 0.272 0.662 0.36
Logistic regression_CFS Patient 0.67 0.341 0.666 0.329
Normal 0.659 0.33 0.663
naïve Bayes_Wrapper Patient 0.719 0.361 0.691
0.359
Normal 0.639 0.281 0.666
Logistic regression_Wrapper Patient 0.671 0.312 0.677 0.359
Normal 0.688 0.329 0.682
표 4. Variable subset selection 메소드에 따라 선별된 각 모 델별 변수 리스트
Table 4. Selected variables by each variable subset selection method
Variable subset method selected variables CFS_BestFirst age, DW_Trk_FT Wr a p p e r _ l o g i s t i c
regression_BestFirst
DW_Trk_FT, DW_Llg_FT, DW_Llg_LN, DW_Rlg_LN Wrapper_naiveBayes_
BestFirst
age, DW_Trk_FT, DW_Trk_LN, DW_Rlg_LN
DW_SBT_FT (머리를 제외한 총지방량)와
DW_WBT_FT (총 지방량)가 동일한 예측력을 나타내 었다 (AUC= 0.639).
그림 1은 모든 변수들을 이용하여 생성된 모델들과, variable subset selection 메소드들을 이용하여 변수들의 조합을 기반으로 생성된 총 여섯 개 모델에 대한 예측 성 능을 비교한 것이다. 가장 높은 성능을 나타낸 모델은 CFS 기반 naive Bayes 모델(naive_full model)이 가장 높은 성능을 나타내었으나 (AUC = 0.739), 전체 변수를 이용한 logistic regression모델 (AUC = 0.737), wrapper 기반 navie Bayes 모델 (AUC = 0.736) 및 wrapper 기반 logistic regression 모델 (AUC = 0.736)들과 성능상 큰 차이를 나타내지는 않았다. 그러나, 표 4에서 보듯이 variable subset selection 메소드들에 따라 모델에 포함 되기 위해 선택된 변수들은 매우 다른 것을 볼수 있다.
본 모델 연구에서는 두 가지 variable subset selection 메 소드를 사용하였고, 각 메소드마다 선택된 변수들의 리 스트들이 큰 차이를 보였다. CFS 기반 메소드에서는 총 17개의 변수들 중에서 age와 DW_Trk_FT 변수만이 선 택되었는데 이러한 이유는 body fat mass 변수들 사이에 서 매우 높은 correlation이 존재하는 것으로 여겨진다.
Wrapper 기반 naive Bayes 모델에서는 age, DW_Trk_FT, DW_LIg_LN, DW_RIg_LN이 선택되었다.
세부적인 선별내용은 표 4에 기술되었다.
표 4는 생성된 모델들에 대한 세부적인 성능평가를 나 타낸다. 예를 들어, CFS 기반 naive Bayes 모델은 환자 군 예측에서 0.728의 민감도(sensitivity)와 0.37의 1-특이 도(1-specificity), 0.694의 F-Measure, 0.36의 MCC (matthews correlation coefficient)를 나타내었고, 정상군 예측에서 0.63의 민감도, 0.272의 1-특이도, 0.662의 F-Measure 값을 얻었다.
2. 고찰
서론에서 언급하였듯이, 본 연구와 같이 머신러닝을 기반으로 체지방 및 제지방 측정 변수를 이용하여 고콜 레스테롤혈증을 예측하는 모델을 제시한 연구는 거의 없다. 그러나, 유사한 연구의 사례로 Bosy-Westphal et al. [27]의 연구에서는 fat mass, 복부둘래, BMI 등을 이용하여 콜레스테롤 수치를 포함한 대사성질환 위험 요소를 판별하기 위하여 ROC 값을 도출하였고, 두 가 지 이상의 대사성질환을 지닌 사람을 식별하는데 있어 서 여성의 경우 BMI는 0.694, 복부둘래는 0.703, fat mass 퍼센테이지는 0.691의 AUC 값을 나타냈다고 보 고하였다. Lara-Esqueda et al. [28]는 정상 키, 작은 키 를 지닌사람들에게서 BMI 범위에 따라 고콜레스테롤 혈증 예측을 위한 연구가 수행되어졌고, 결과적으로 BMI는 정상인과는 다르게 키가 작은 사람들에게서는 질병 예측력이 매우 낮다고 보고하였다. Gibby et al.
[29]의 연구에서는 복부의 fat 퍼센테이지가 고혈압과 당뇨와는 매우 연관성이 높으나, 실제 고콜레스테롤혈
Prediction model of hypercholesterolemia using body fat mass based on machine learning
- 418 - 증 및 뇌졸중과는 연관성이 없다는 것을 밝혀내었다.
Gangwisch et al. [30]은 고콜레스테롤혈증과 관련된 몸무게, 인종, 나이 등의 교란변수들 적용한 여러 모델 들을 제시하였고, 이러한 모델들을 기반으로 수면시간 이 청소년 여성들에서는 높은 콜레스테롤 또는 고콜레 스테롤혈증의 위험요인이 될 수 있다고 보고하였다.
또한 고콜레스테롤혈증 식별을 위해 body fat mass 와 함께 주로 사용되는 체형관련 변수인 BMI와 복부둘 래 정보를 이용하여 고콜레스테롤 혈증을 예측한 연구 가 있었다. 이 연구에서 남성에 대해 BMI의 경우 0.69 의 sensitivity, 0.49의 1-specificity를 얻었고, 복부둘래 의 경우 0.62의 sensitivity, 0.57의 1-specificity를 얻었 다 [31]. 이러한 거의 모든 연구들은 각각의 변수들과 고콜레스테롤혈증의 연관성여부 및 변수 각각에 대한 식별력 또는 예측력에 관한 연구로 한정되어져 있다.
본 연구에서는 이러한 각각의 변수에 대한 질병 식별력 에 대한 연구가 아니라 이러한 변수들을 통합하고 머신 러닝을 적용하여 보다 예측력을 높이려는 것에 초점을 두고 있다.
본 연구의 제약사항은 다음과 같다. 첫째, 본 연구의 결과가 한국인 인구를 대표하기는 어렵다. 이러한 이유 는 샘플에 있어서 class imbalance 문제와 매우 적은 질병군 샘플수의 부족으로 인하여 class별 약 1,000개씩 의 샘플을 추출하였기 때문이다. 둘째, 본 연구는 cross-sectional study의 특성에 기인하여 원인 및 결과 에 대한 인과관계를 파악하는데 제약이 있다.
Ⅳ.
결 론
본 연구에서는 기존의 연구방법인 body fat mass 관 련 변수들과 고콜레스테롤혈증과의 연관성 연구에서 벗어나, 머신러닝을 기반으로 통합된 변수들을 이용하 여 보다 질병 식별력을 높이기 위한 모델을 개발하였 다. 본 연구에서는 body fat mass 관련 변수들 중에서 몸통지방량이 고콜레스테롤혈증을 예측하는데 가장 식 별력이 좋은 변수인 것을 밝혀내었고, 머신러닝 기반 예측모델에서 CFS 기반 naive Bayes 모델을 이용하여 약 0.739의 AUC 값을 얻었다. 이러한 연구의 결과는 향후 대중보건 분야 또는 대규모 스크리닝 연구에서 기 초정보로 활용되어질수 있다고 예상한다.
References
[1] Berbée JF, Boon MR, Khedoe PP, Bartelt A, Schlein C, Worthmann A, Kooijman S, Hoeke G, Mol IM, John C, Jung C, Vazirpanah N, Brouwers LP, Gordts PL, Esko JD, Hiemstra PS, Havekes LM, Scheja L, Heeren J, Rensen PC. Brown fat activation reduces hypercholesterolaemia and protects from atherosclerosis development. Nat Commun.
2015;6:6356. doi: 10.1038/ncomms7356.
[2] Trentman TL, Avey SG, Ramakrishna H.
Current and emerging treatments for hypercholesterolemia: A focus on statins and proprotein convertase subtilisin/kexin Type 9 inhibitors for perioperative clinicians. J Anaesthesiol Clin Pharmacol. 2016;32(4):440-445.
doi: 10.4103/0970-9185.194773.
[3] Knowles JW, Rader DJ, Khoury MJ. Cascade Screening for Familial Hypercholesterolemia and the Use of Genetic Testing. JAMA.
2017;318(4):381-382. doi: 10.1001/jama.2017.8543.
[4] Lee BJ, Ku B, A comparison of trunk circumference and width indices for hypertension and type 2 diabetes in a large-scale screening:
a retrospective cross-sectional study. Sci Rep.
2018;8:13284(1-10). doi:
10.1038/s41598-018-31624-x
[5] Lee BJ, Kim JY. Identification of Type 2 Diabetes Risk Factors Using Phenotypes Consisting of Anthropometry and Triglycerides based on Machine Learning. IEEE J Biomed Health Inform. 2016;20(1):39-46. doi:
10.1109/JBHI.2015.2396520.
[6] Lee BJ, Kim JY. Identification of the Best Anthropometric Predictors of Serum High- and Low-Density Lipoproteins Using Machine Learning. IEEE J Biomed Health Inform.
2015;19(5):1747-1756. doi:
10.1109/JBHI.2014.2350014.
[7] Lee BJ, Kim JY. Indicators of hypertriglyceridemia from anthropometric measures based on data mining. Comput Biol Med. 2015;57:201-211. doi:
10.1016/j.compbiomed.2014.12.005.
[8] Lee BJ, Kim JY. A comparison of the predictive power of anthropometric indices for hypertension and hypotension risk. PLoS One 2014;9(1):e84897. doi: 10.1371/journal.pone.0084897.
[9] Lee BJ, Ku B, Nam J, Pham DD, Kim JY.
The Journal of the Convergence on Culture Technology (JCCT)
Vol. 5, No. 4, pp.413-420, November 30, 2019. pISSN 2384-0358, eISSN 2384-0366
- 419 - Prediction of fasting plasma glucose status using anthropometric measures for diagnosing type 2 diabetes. IEEE J Biomed Health Inform.
2014;18(2):555-561. doi:
10.1109/JBHI.2013.2264509.
[10] Lee BJ, Kim JY. Identification of Hemoglobin Levels Based on Anthropometric Indices in Elderly Koreans. PLoS One 2016;11(11):e0165622.
doi: 10.1371/journal.pone.0165622.
[11] Chi JH, Shin MS, Lee BJ. Association of type 2 diabetes with anthropometrics, bone mineral density, and body composition in a large-scale screening study of Korean adults. PLoS One.
2 0 1 9 ; 1 4 ( 7 ) : e 0 2 2 0 0 7 7 . doi:10.1371/journal.pone.0220077.
[12] Ahn E, Kim E. A study on the eating behaviors and food intake of diabetic patients in Daegu·Gyeongbuk area. The Journal of the Convergence on Culture Technology.
2019;5(3):229-239 doi:
http://dx.doi.org/10.17703/JCCT.2019.5.229.
[13] Vasan SK, Osmond C, Canoy D, Christodoulides C, Neville MJ, Di Gravio C, Fall CHD, Karpe F. Comparison of regional fat measurements by dual-energy X-ray absorptiometry and conventional anthropometry and their association with markers of diabetes and cardiovascular disease risk. Int J Obes (Lond). 2018;42(4):850–857. doi:
10.1038/ijo.2017.289.
[14] Gastaldelli A. Abdominal fat: does it predict the development of type 2 diabetes? Am J Clin Nutr. 2008;87(5):1118–1119. doi:
10.1093/ajcn/87.5.1118
[15] Ohlson LO, Larsson B, Svärdsudd K, Welin L, Eriksson H, Wilhelmsen L, et al. The influence of body fat distribution on the incidence of diabetes mellitus: 13.5 years of follow-up of the participants in the study of men born in 1913.
Diabetes. 1985;34(10):1055–1058. doi:
10.2337/diab.34.10.1055
[16] Carey VJ, Walters EE, Colditz GA, Solomon CG, Willet WC, Rosner BA, et al. Body fat distribution and risk of non-insulin-dependent diabetes mellitus in women: the Nurses' Health Study. Am J Epidemiol. 1997;145(7):614–619.
doi: 10.1093/oxfordjournals.aje.a009158
[17] Ortega FB, Sui X, Lavie CJ, Blair SN. Body Mass Index, the Most Widely Used but also Widely Criticized Index: Would a Gold-Standard Measure of Total Body Fat be a Better
Predictor of Cardiovascular Disease Mortality?
Mayo Clin Proc. 2016;91(4):443–455. doi:
10.1016/j.mayocp.2016.01.008
[18] Sookyung Hyun, Susan Moffatt-Bruce, Cheryl Newton, Brenda Hixon, Pacharmon Kaewprag.
Tree-based Approach to Predict Hospital Acquired Pressure Injury. International Journal of Advanced Culture Technology. 2019;7(1):8-13 doi: 10.17703/IJACT.2019.7.1.8.
[19] Gishti O, Gaillard R, Durmus B, Abrahamse M, van der Beek EM, Hofman A, Franco OH, de Jonge LL, Jaddoe VW. BMI, total and abdominal fat distribution, and cardiovascular risk factors in school-age children. Pediatr Res.
2015;77(5):710-718. doi: 10.1038/pr.2015.29.
[20] Muls E, Kolanowski J, Scheen A, Van Gaal L;
ObelHyx Study Group. The effects of orlistat on weight and on serum lipids in obese patients with hypercholesterolemia: a randomized, double-blind, placebo-controlled, multicentre study. Int J Obes Relat Metab Disord.
2001;25(11):1713-1721.
[21] Hecker KD, Kris-Etherton PM, Zhao G, Coval S, Jeor SS. Impact of body weight and weight loss on cardiovascular risk factors. Curr Atheroscler Rep. 1999;1:236-242.
[22] Wiklund P, Toss F, Weinehall L, Hallmans G, Franks PW, Nordström A, Nordström P.
Abdominal and gynoid fat mass are associated with cardiovascular risk factors in men and women. J Clin Endocrinol Metab.
2008;93(11):4360-4366. doi: 10.1210/jc.2008-0804.
[23] The Fourth Korea National Health and Nutrition Examination Survey (KNHANES IV-3), 2009, Korea Centers for Disease Control and Prevention.
[24] Hall M, Frank E, Holmes G, Pfahringer B, Reutemann P, Witten IH. The WEKA data mining software: an update. SIGKDD Explor.
2009;1(1):10-18.
[25] Hall M, Holmes G. Benchmarking attribute selection techniques for discrete data class data mining. IEEE Trans Knowl Data Eng.
2003;15(6):1437-1447.
[26] Kohavi R, John GH. Wrappers for feature subset selection. Artif Intell. 1997;97(1):273-324.
[27] Bosy-Westphal A, Geisler C, Onur S, Korth O, Selberg O, Schrezenmeir J, Müller MJ. Value of body fat mass vs anthropometric obesity indices in the assessment of metabolic risk factors. Int J Obes (Lond). 2006;30(3):475-483.
Prediction model of hypercholesterolemia using body fat mass based on machine learning
- 420 -
※ 이 논문은 2019년도 과학기술정보통신부의 재원으로 한국연구재단 바이오의료기술개발 사업의 지원을 받아 수행된 연구임
(NRF-2015M3A9B6027139).
[28] Lara-Esqueda A, Aguilar-Salinas CA, Velazquez-Monroy O, Gómez-Pérez FJ, Rosas-Peralta M, Mehta R, Tapia-Conyer R. The body mass index is a less-sensitive tool for detecting cases with obesity-associated co-morbidities in short stature subjects. Int J Obes Relat Metab Disord. 2004;28(11):1443-1450.
[29] Gibby JT, Njeru DK, Cvetko ST, Merrill RM, Bikman BT, Gibby WA. Volumetric analysis of central body fat accurately predicts incidence of diabetes and hypertension in adults. BMC Obes.
2015;2:10. doi: 10.1186/s40608-015-0039-3.
[30] Gangwisch JE, Malaspina D, Babiss LA, Opler MG, Posner K, Shen S, Turner JB, Zammit GK, Ginsberg HN. Short sleep duration as a risk factor for hypercholesterolemia: analyses of the National Longitudinal Study of Adolescent Health.
Sleep. 2010;33(7):956-961.
[31] Shabnam AA, Homa K, Reza MT, Bagher L, Hossein FM, Hamidreza A. Cut-off points of waist circumference and body mass index for detecting diabetes, hypercholesterolemia and hypertension according to National Non-Communicable Disease Risk Factors Surveillance in Iran. Arch Med Sci.
2012;8(4):614-621. doi: 10.5114/aoms.2012.30284.