Criteria of Nitrate Concentration in Soil Solution and Leaf Petiole Juice for Fertigation of Cucumber under Greenhouse Cultivation in Gyeonggi region
Jung-Soo Park*, Ahn-Sung Roh, Jae-Eun Jang, Chang-Sung Kang, and Hee-Dong Kim Gyeonggi-do Agricultural Research & Extension Services, Hwaseong, 18388, Korea
(Received: October 8 2013, Revised: July 31 2015, Accepted: August 13 2015)
To develop a technique for efficient management of fertility for cucumber in greenhouse, a quick test method to quantify nitrate (NO 3 - ) content in soil solution and leaf petiole juice using a simple instrument that are easy to use for farmers was investigated. N fertilizer (urea) was applied at 0, 50, 100 and 200% levels of the recommended application rate from 30 days after transplanting to harvest by soil fertigation treatments. Stable results were obtained from analysis of nitrate (NO 3 -
) using top 10 th or 11 th leaf petioles collected between 10 to 11 am in the morning. Under the semiforcing culture, NO 3 -
content of leaf petiole juice was highest at 60 days after transplanting (DAT) at all fertigation treatments. Appropriate NO 3 - content of leaf petiole juice was 2,418±78 ~ 2,668±118 at 45 DAT, 3,032±90 ~3,332±63 at 60 DAT, 2,709±50~3,158±155 at 75 DAT, 2,535±49~
2,907±83 at 90 DAT, and 2,242±48 ㎎ L -1 at 105 DAT. In addition, appropriate NO 3 - content of soil solution was 167±9 ~212±15 at 45 DAT, 83±10~112±12 at 60 DAT, 49±3~92±6 at 75 DAT, 71±9~103±9 at 90 DAT, and 73±9 ㎎ L -1 at 105 DAT. The cucumber yield at 100% N level of fertigation was 7,770 ㎏ 10a -1 and no difference in yield was found at 200% N level of fertigation. However, there was 12% decrease in yield at 50%
N fertigation and, 17% decrease at 0% N fertigation. Under retarding culture, NO 3 -
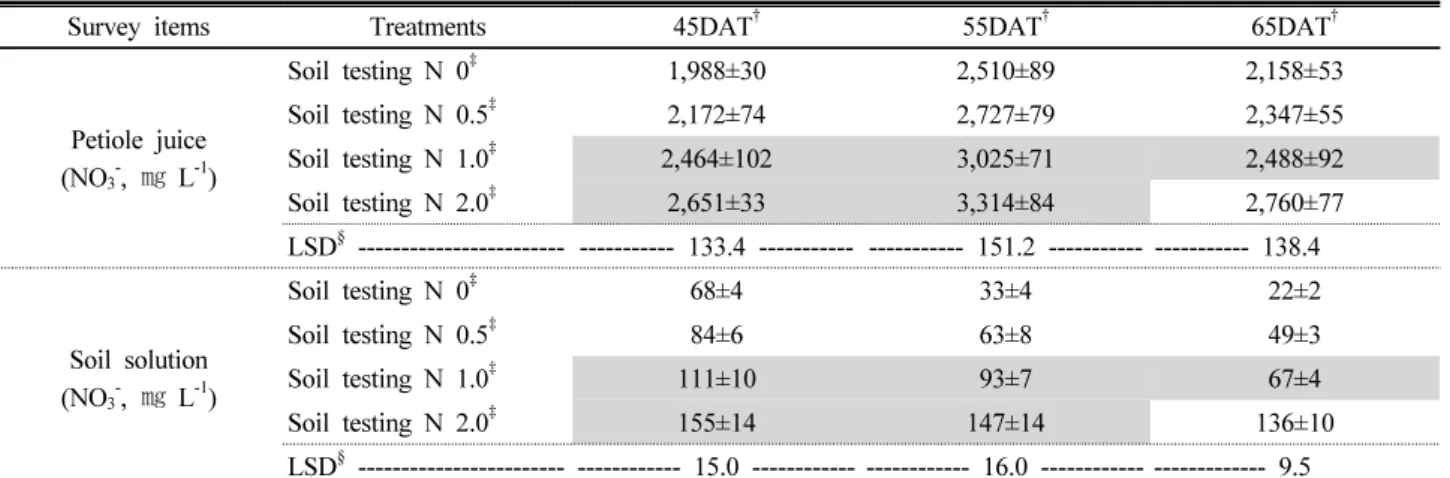
concentration of leaf petiole juice was highest at 55 days after transplanting (DAT) at all fertigation treatments. Appropriate NO 3 -
content of leaf petiole juice was 2,464±102 ~2,651±33 at 45 DAT, 3,025±71~3,314±84 at 55 DAT and 2,488±92 ㎎ L -1 at 65 DAT, respectively. Appropriate NO 3 - content of soil solution was 111±10 ~155±14 at 45 DAT, 93±7~
147±14 at 55 DAT, 67±4 ㎎ L -1 at 65 DAT, respectively. The cucumber yield at 50% N fertigation was not different from 1,697 ㎏ 10a -1 of 100% N fertigation level and even with that of the 200% N fertigation. However, there was 21% decrease in yield at 0% N fertigation.
Key words: Cucumber, Leaf petiole juice, Soil solution, Nutrient diagnosis
NO
3-concentration of petiole juice and soil solution by different nitrogen application rates for fertigation during the cucumber semi-forcing cultivation in greenhouse.
Survey items Treatments 45DAT
†60DAT
†75DAT
†90DAT
†105DAT
†Petiole juice (NO
3-, ㎎ L
-1)
Soil testing N 0
‡2,077±37 2,376±97 2,142±105 1,847±159 1,798±51
Soil testing N 0.5
‡2,223±50 2,609±31 2,413±46 2,136±116 2,033±66
Soil testing N 1.0
‡2,418±78 3,032±90 2,709±50 2,535±49 2,242±48
Soil testing N 2.0
‡2,668±118 3,332±63 3,158±155 2,907±83 2,641±46
LSD
§--- --- 149.0 --- --- 159.5 --- --- 184.3 --- --- 224.6 --- --- 116.2
Soil Solution (NO
3-, ㎎ L
-1)
Soil testing N 0
‡90±7 21±3 33±5 39±3 34±5
Soil testing N 0.5
‡121±12 40±5 49±3 54±3 44±2
Soil testing N 1.0
‡167±9 83±10 61±7 71±9 73±9
Soil testing N 2.0
‡212±15 112±12 92±6 103±9 137±10
LSD
§--- --- 26.2 --- ---14.8 --- --- 11.9 --- --- 10.8 --- --- 17.1
†
Days after transplanting(Apr. 9).
‡
0, 0.5, 1.0, 2.0 times of recommended nitrogen fertilization rate based for fertigation on soil testing.
§
Least significant difference at 5% level of significance.
1)
*Corresponding author : Phone: +82312295821, Fax: +82312295964, E-mail: [email protected]
Introduction
경기도 과채류 재배면적 (2010년)은 3,173 ha로 전국 (48,296 ha) 대비 6.5% 점유하고 있으며 이중 시설오이는 854 ha로 도내 과채류 재배면적의 26.9%를 차지하고 있다.
오이는 시설 원예작물 중에서도 시비량이 많고 연중 재배되 어 염류집적 등 연작장해 발생이 많다 (Jung et al., 1994;
Jung et al., 1996).
오이 양분 불균형시 나타나는 이상증상에 대한 기존의 식물 영양진단법은 오이 잎을 건조시켜 그 안에 있는 영양 원소의 함량을 측정한 후 건조무게 기준으로 표현하는 방법 이다 (NIAST, 2003). 이러한 정밀분석 방법은 분석에 1~2 주 소요되므로 농가 생산현장에서는 피해 발생시기에 즉시 해결방법이 없어 곤란을 겪고 있다. 오이는 적기에 필요한 양분이 부족하면 구부러지거나 끝이 가늘어 지는 등 기형과 발생으로 상품가치가 크게 떨어지기 때문에 (JARES, 2003), Hong과 Park (2000)은 염류집적에 대한 근본적인 방안으로 서 토양비옥도를 고려한 시비조절이 필요하다고 하였으며, 외국에서는 작물 생산성을 유지하는 동시에 환경오염 경감 을 위해서 토양중 적정 양분상태를 유지하는 방법 또는 작 물자체의 양분상태를 기준으로 시비량을 결정하는 방안 (Hayashi, 1990; Roppongi, 1998) 등이 검토되어 왔다. 이 중 Test strip을 이용한 질산이온 분석법은 그 측정값이 비 교적 정확할 뿐 아니라 (Hong and Park, 2000) 농민과 같이 비전문가도 현장에서 실시간 편리하게 토양과 작물의 질소 양분상태를 확인할 수 있어 그 활용가능성이 높다고 알려져 있다 (Lim et al., 2001). 그러나 토양과 작물중 양분의 과부 족을 진단하기 위한 질산이온 농도 기준설정에 대한 국내 연구는 아직 미미한 실정이다. 따라서 본 시험은 오이 시설 재배시 농가에서 손쉽게 사용 가능한 토양 및 식물체의 간 이 질소 실시간 진단기술을 개발하여 과학적인 양분이용으 로 토양내 염류집적을 완화하고 고품질 친환경 안정생산을 통해 친환경농업 확산에 기여하고자 실시하였다.
Materials and Methods
본 시험은 2010년부터 2년간 경기도농업기술원에서 시험 품종을 반촉성 재배는 백침계인 양명 백다다기, 억제 재배 는 청장계인 오성낙합으로 하여 비닐하우스 내에서 수행하 였다. 정식은 반촉성 재배는 4월 9일, 억제 재배는 9월 5일 에 재식거리 80×40 ㎝, 2조식으로 하였으며 시험구는 각각 난괴법 3반복으로 배치하였다. 질소는 토양검정 질소시비 량을 기준으로 표준시비량의 50%는 20 ㎝ 작토층과 충분히 혼합하여 시험구 모두 정식전 기비로 시용하였고, 나머지 50%는 각 처리별 시용량에 따라 추비로 분시하였다.
처리내용은 토양검정 질소 추비량에 대해 무시용, 표준
시용량의 0.5배, 1배, 2배량의 4수준으로 하였으며, 정식 후 30일부터 일주일에 2회씩 수확종료시까지 관비로 균등 시 용하였다. 기타 인산은 전량 기비, 칼리는 기비 30%, 추비 70% 비율로 하여 추비는 정식 후 30일 부터 일주일에 2회씩 수확 종료시까지 질소와 함께 관비로 균등 시용하였다.
토양 화학성 분석은 농촌진흥청 농업과학기술원 (NIAST, 2000)의 토양분석법에 준하였으며, 정식 후 45일부터 15일 간격으로 토양중 질산이온 (NO
3-) 분석을 위해 각 처리내 생육이 균일한 오이 5주를 대상으로 관수 1일후 오이 줄기 에서 10 ㎝ 떨어진 지점에서 지하로 10 ㎝ 지점인 오이의 근권 토양을 채취하였다. 채취한 토양은 고르게 혼합한 후 5 ㎖ 플라스틱 용기를 이용하여 생토용적침출법 시료로 일 부 이용하고 나머지 잔량은 풍건한 후 2 ㎜체를 통과시켜 토양 화학성 분석시료로 사용하였다. pH는 초자전극법, 전 기전도도 (Electrical Conductivity, EC)는 포화용액침출법, NO
3-N은 Kjeldahl 증류법, 유기물함량은 Tyurin법, 유효인 산은 Lancaster법, 치환성양이온은 1N-NaOAc로 추출하여 Inductively Coupled Plasma (GBC Integra XL Australia) 분석법으로 분석하였다.
오이 엽병즙액 중 질산이온 함량 분석을 위하여 정식 후 45일 부터 15일 간격으로 각 처리내 생육이 균일한 오이 5 주를 선발하여 엽위치별로 엽병을 채취하여 마늘착즙기로 착즙하였으며, 토양 및 엽병즙액 중 질산이온 함량은 휴대용 Reflectometer (RQflec, Merck Co., Jer)를 이용하여 Test strip법으로 측정하였다. 오이 수량은 재배기간 중의 수량 과 상품율을, 오이 수확완료 후에는 초장, 마디수, 줄기의 굵기를 조사하였다. 시험전 토양 화학성은 반촉성 재배는 Table 1과 같이 pH는 6.3, EC는 2.1~2.6 dS m
-1, 억제 재 배는 pH는 6.0~6.3, EC는 1.8~2.4 dS m
-1인 토양조건이 었다.
Results and Discussion
가. 반촉성 재배
재배기간중 기상 및 정식 후 시기별 토양 화학성
재배기간 중의 하우스내 평균기온, 지중온도, 강우량 및 일 조시간은 Fig. 1과 같다. 하우스내 평균기온은 5월 하순 부 터 20°C이상, 지중 10 ㎝의 평균지온은 5월 상순 부터 20°C 이상을 나타내었다.
질소 관비처리에 따른 정식 후 시기별 pH, EC변화는
Table 2, 치환성 칼리 및 질산태질소 함량은 Table 3과 같
다. pH는 5.9∼6.7 정도로 처리간 뚜렷한 경향이 없었으나
EC는 0.8∼2.4 dS m
-1정도로 정식 후 시기별 질소 관비량
증가에 따라 높아지는 경향이었으며, 질소관비 2.0배 처리
에서는 정식후 45일 2.4에서 생육이 진전됨에 따라 감소하
였으나 수확종료기인 정식 후 105일에는 시설재배토양의 적
Table 1. Chemical properties of soils before experiment.
Cultivation type Year pH EC OM Av.P
2O
5Ex. Cation
NO
3-N
K Ca Mg
(1:5) dS m
-1g kg
-1mg kg
-1--- cmol
ckg
-1--- mg kg
-1Semi-forcing
culture
2010 6.3 2.1 11.3 402 0.29 7.3 2.3 75.4
2011 6.3 2.6 16.1 375 0.64 7.5 2.4 94.8
Retarding culture 2010 6.0 2.4 10.0 387 0.34 7.5 0.5 56.6
2011 6.3 1.8 14.1 404 0.49 6.9 2.2 50.7
(a) (b)
(c) (d)
Fig. 1. Meteorological phenomena during the cucumber semi-forcing cultivation. (a) Daily mean temperature inside greenhouse.
(b) Daily mean temperature under ground of 10cm inside greenhouse. (c) Amount of rainfall. (d) Duration of sunshine.
Table 2. Changes of soil pH and EC during the cucumber semi-forcing cultivation by different nitrogen application rates.
Treatments pH EC
45
†60
†75
†90
†105
†45
†60
†75
†90
†105
†--- (1:5) --- --- dS m
-1---
Soil testing N 0
‡6.4 6.7 6.7 6.5 6.4 1.6 1.0 1.2 0.9 0.8
Soil testing N 0.5
‡6.2 6.6 6.7 6.6 6.4 2.0 1.3 1.3 1.1 1.3
Soil testing N 1.0
‡6.2 6.5 6.4 6.5 6.2 2.1 1.5 1.6 1.4 1.7
Soil testing N 2.0
‡6.0 6.4 6.3 6.1 5.9 2.4 1.7 1.8 1.5 2.2
†
Days after transplanting.
‡
0, 0.5, 1.0, 2.0 times of recommended nitrogen fertilization rate based for fertigation on soil testing.
Table 3. Changes of Ex.-K and NO
3-N concentration for soil during the cucumber semi-forcing cultivation by different nitrogen application rates.
Treatments Ex.-K NO
3-N
45
†60
†75
†90
†105
†45
†60
†75
†90
†105
†--- cmol
ckg
-1--- --- mg kg
-1---
Soil testing N 0
‡0.41 0.54 0.54 0.53 0.45 42.1 25.9 26.5 19.6 21.1
Soil testing N 0.5
‡0.48 0.52 0.54 0.47 0.38 55.5 29.1 28.5 25.4 24.3
Soil testing N 1.0
‡0.43 0.47 0.44 0.39 0.36 73.3 48.0 36.2 34.8 36.6
Soil testing N 2.0
‡0.44 0.40 0.40 0.34 0.30 79.9 66.7 47.4 50.7 52.6
†
Days after transplanting.
‡
0, 0.5, 1.0, 2.0 times of recommended nitrogen fertilization rate based for fertigation on soil testing.
(a) (b)
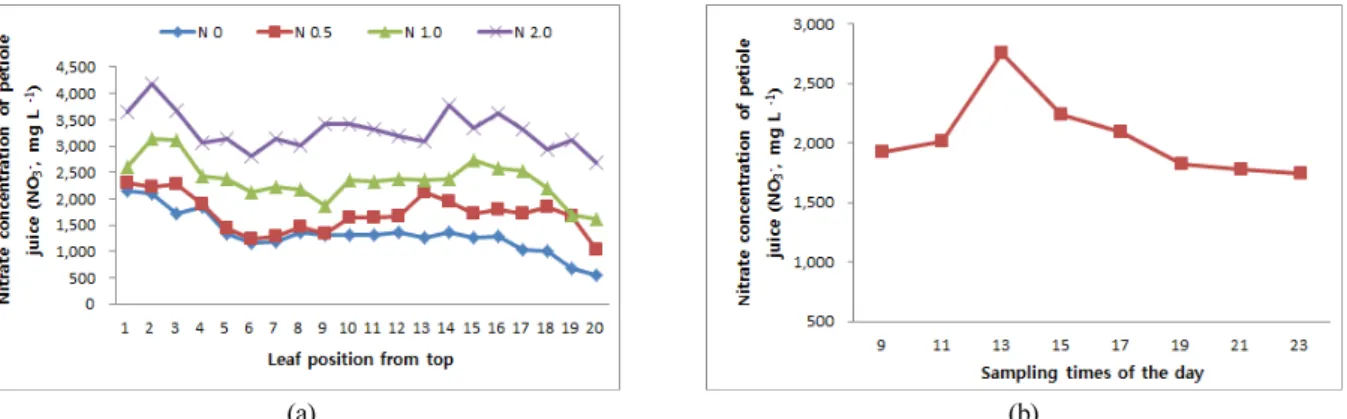
Fig. 2. (a) NO
3-concentration of petiole juice collected at the different leaf position of cucumber. (b) NO
3-concentration of petiole juice collected at the different times of cucumber from 11
thleaf petiole.
정기준 (EC 2.0 dS m
-1이하)보다 높은 2.2로 나타났다. 정 식 후 시기별 질산태질소 함량도 EC와 같은 경향을 나타내 EC값과 질산태질소 함량간에는 상호 밀접한 관계가 있음을 알 수 있었다. 치환성 칼리는 0.30∼0.54 cmol kg
-1정도로 처리간 일정한 경향이 없었다.
엽위순서 및 엽병채취 시간대별 NO
3-함량 작물의 체내 영양원소 농도에 대해 Kim과 Kim (2003)은 엽의 위 치, Scaife와 Stevens (1983)은 하루 중 채취시간에 따라 다 르다고 하였다. 따라서 본 시험에서도 즙액측정에 이용될 엽병의 적정위치와 채취시간대를 결정하기 위하여 엽병위 치와 채취시간대별로 NO
3-함량변화를 조사하였다 (Fig. 2).
엽병즙액 중 NO
3-함량은 질소 관비수준이 증가할수록 증가하는 경향이었으며, 같은 관비수준내에서도 엽병 위치 에 따라 현저한 차이를 보였다. 엽병 위치별로는 3번 이상 의 상위엽병이 19번 이하의 하위엽병에 비해 엽병즙액내 NO
3-함량이 높았으나 질소 관비수준간에는 일정한 경향이 없어 질소 관비수준에는 비의존적인 반면, 엽병위치 4~18 번 사이의 엽병즙액 중 NO
3-함량은 질소관비 수준에 의존 적인 변화를 나타내었다. 또한 4~9번, 12~18번 사이의 엽 병즙액 중 NO
3-함량은 엽병 위치에 따라 변화가 심하여 이 위치의 엽병들은 간이 양분진단 시료로 이용하기가 곤란하
였으나 상위 10~11번째 엽병은 다른 위치의 엽병들에 비해 질소 관비수준간 함량 차이가 뚜렷하였다. 따라서 엽병즙액 을 이용한 간이 양분진단을 위한 엽병 위치는 질소관비 수 준별 엽병즙액내 NO
3-함량 차이가 뚜렷하고 안정적인 상 위 10~11번째 엽병을 대상으로 하는 것이 가장 적절하다고 판단되었다.
하루 중 엽병 채취시간대를 결정하기 위하여 상위 11번째 엽병을 시간대별로 채취하여 NO
3-함량 변화를 조사하였다.
NO
3-함량은 오전 9시~11시까지는 완만히 증가하는데 비 해 오전 11시부터 급격히 증가 후 오후 1시에 최대값을 나타 냈고 이후 감소하는 것으로 나타났다. 오이 영양진단을 위 한 엽병 채취시간은 야간인 19시 이후도 비교적 안정적이었 으나 관비는 농가에서 주로 오전에 이루어지므로 양분진단 후 바로 질소 관비량 조절, 시용을 위해서는 오전 10~11시 사이에 엽병을 채취하여 분석하는 것이 가장 적당하다고 생 각된다.
정식 후 시기별 생토 추출액, 엽병즙액 중 NO
3-함
량 및 오이 수량 정식 후 시기별 생토 추출액 및 엽병즙
액 중 NO
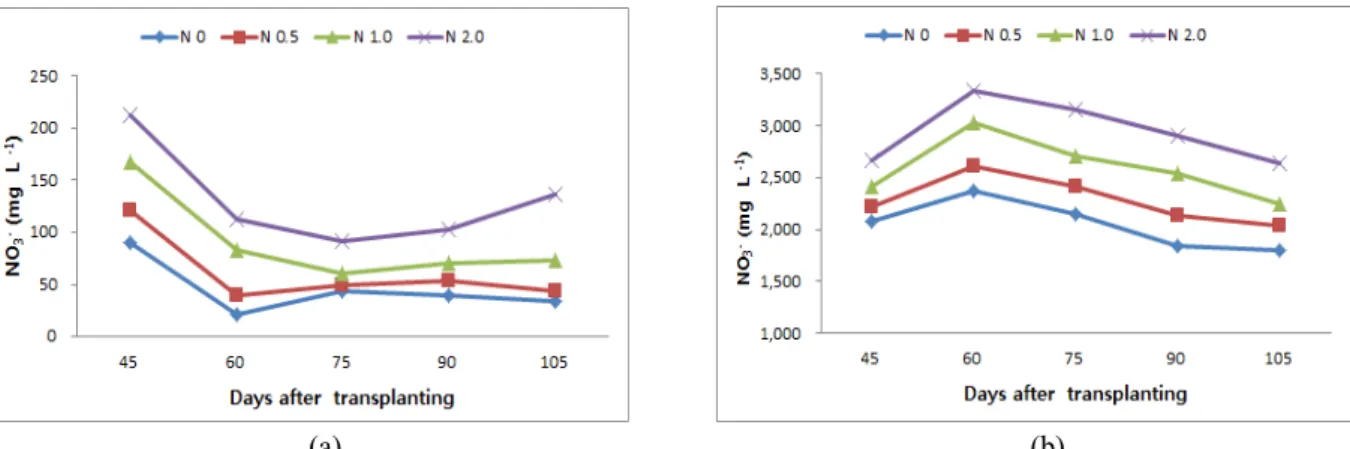
3-함량 변화는 Fig. 3과 같다. 정식 후 시기별 생
토 추출액 중 NO
3-함량은 질소 관비수준 모두 정식 후 45
일에 가장 높았으며 이후 관비 무시용과 0.5배는 정식 후
(a) (b)
Fig. 3. Changes of NO
3-concentration for soil solution and leaf petiole juice according to days after transplanting during the cucumber semi-forcing cultivation. (a) NO
3-concentration of soil solution (soil : water = 1:5, v/v). (b) NO
3-concentration of leaf petiole juice.
Table 4. Growth properties and yields of the cucumber by different rates of nitrogen application during semi-forcing cultivation under greenhouse.
Treatments Plant length
No. of node
Stem diameter
Ratio of marketable fruit Marketable yield of fruit
2010 2011 Mean 2010 2011 Mean Index
㎝ plant
-1㎜ --- % --- --- f.w. ㎏ 10a
-1---
Soil testing N 0
†611 66 10.1 77.5 66.0 75.3 6,552 6,375 6,463 83
Soil testing N 0.5
†637 68 10.3 81.0 67.3 76.8 6,927 6,829 6,878 88
Soil testing N 1.0
†647 69 10.5 82.2 71.3 78.6 7,781 7,759 7,770 100
Soil testing N 2.0
†666 70 10.5 77.3 68.2 75.7 7,340 7,520 7,430 96
LSD
‡--- --- --- --- --- --- --- - 473.1 - 777.4 C.V(%) --- --- --- --- --- --- --- --- 3.31 -- 5.46
†
0, 0.5, 1.0, 2.0 times of recommended nitrogen fertilization rate based for fertigation on soil testing.
‡
Least significant difference at 5% level of significance.
60일까지, 관비 1.0배와 2.0배는 정식 후 75일까지 감소하 였으나, 정식 후 75일 이후에는 관비 0.5배와 무시용구는 같거나 감소하는 경향이었고 관비 1.0배와 2.0배는 증가하 였다. 특히 관비 2.0배는 정식 후 75일 이후 증가폭이 컸는 데 이는 작물이 흡수하고 남은 잉여량이 토양중에 잔류하기 때문으로 생각되었다. 정식 후 시기별 엽병즙액 중 NO
3-함 량은 질소 관비수준 모두 정식 후 60일까지 증가 후 감소하 였고, 관비수준이 증가할수록 엽병즙액내 NO
3-함량이 높 았다. 또한 생토액내 NO
3-함량에 비해 엽병즙액 중 NO
3-함 량이 10배 이상 차이를 보이고 관비수준별로도 차이가 뚜렷 하여 농업현장에서 간이 양분진단시 생토 추출액보다는 엽 병즙액 진단이 보다 변별력이 뛰어난 것으로 생각된다.
질소관비 수준별 오이 생육 및 수량은 Table 4와 같다.
오이 상품과 수량은 질소 관비 1.0배 (7,770 ㎏ 10a
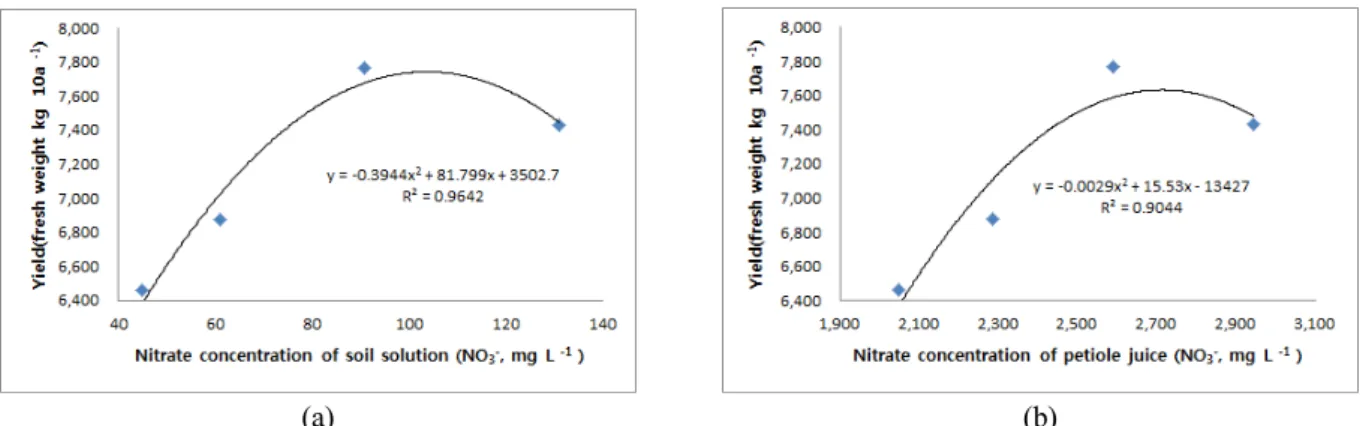
-1) 대비 질소 관비 2.0배는 차이 없었으나, 질소 0.5배는 12%, 질소 관비 무시용은 17% 감수하였다. 생토 추출액 중 NO
3-함량 과 수량간, 엽병즙액 중 NO
3-함량과 수량간 2차 회귀식은 모두 고도의 유의성이 인정되었으며, 생토 추출액중 105 ㎎
L
-1NO
3-농도 수준과 엽병즙액 중 2,700 ㎎ L
-1NO
3-농도 수준에서 최대의 수량을 나타내었다 (Fig. 4).
정식 후 시기별 엽병즙액 및 생토 추출액의 NO
3-적 정함량 질소 관비수준 및 정식 후 시기별 엽병즙액과 생 토 추출액의 NO
3-함량은 Table 5와 같다. 정식 후 시기별 NO
3-적정함량은 오이 상품과 수량이 많고 유의차가 없었 던 질소관비 1.0배와 2.0배 처리 중에서 EC가 정식 후 105 일에 2.0이상으로 증가된 질소관비 2.0배 처리의 엽병즙액 과 생토 추출액은 제외하고, 생토 추출액의 NO
3-함량이 질 소관비 1.0배와 유의차가 없었던 정식 후 75일의 질소관비 0.5배는 추가한 범위로 설정하였다. 이와 같이 설정된 엽병 즙액 중 NO
3-적정함량은 정식 후 45일 2,418±78~
2,668±118, 60일 3,032±90~3,332±63, 75일 2,709±50~
3,158±155, 90일 2,535±49~2,907±83, 105일 2,242±48
㎎ L
-1이었으며, 생토 추출액중 NO
3-적정함량은 정식 후 45일 167±9~212±15, 60일 83±10~112±12, 75일 49±3~
92±6, 90일 71±9~103±9, 105일 73±9 ㎎ L
-1로 나타났다.
(a) (b)
Fig. 4. (a) Relationship between the total fresh weight of cucumber and the NO
3-concentration of soil solution during semi-forcing cultivation. (b) Relationship between the total fresh weight of cucumber and the NO
3-concentration of leaf petiole juice during semi-forcing cultivation.
Table 5. NO
3-concentration of petiole juice and soil solution by different nitrogen application rates for fertigation during the cucumber semi-forcing cultivation in greenhouse.
Survey items Treatments 45DAT
†60DAT
†75DAT
†90DAT
†105DAT
†Petiole juice (NO
3-, ㎎ L
-1)
Soil testing N 0
‡2,077±37 2,376±97 2,142±105 1,847±159 1,798±51
Soil testing N 0.5
‡2,223±50 2,609±31 2,413±46 2,136±116 2,033±66
Soil testing N 1.0
‡2,418±78 3,032±90 2,709±50 2,535±49 2,242±48
Soil testing N 2.0
‡2,668±118 3,332±63 3,158±155 2,907±83 2,641±46
LSD
§--- --- 149.0 --- --- 159.5 --- --- 184.3 --- --- 224.6 --- --- 116.2
Soil Solution (NO
3-, ㎎ L
-1)
Soil testing N 0
‡90±7 21±3 33±5 39±3 34±5
Soil testing N 0.5
‡121±12 40±5 49±3 54±3 44±2
Soil testing N 1.0
‡167±9 83±10 61±7 71±9 73±9
Soil testing N 2.0
‡212±15 112±12 92±6 103±9 137±10
LSD
§--- --- 26.2 --- --- 14.8 --- --- 11.9 --- --- 10.8 --- --- 17.1
†
Days after transplanting(Apr. 9).
‡
0, 0.5, 1.0, 2.0 times of recommended nitrogen fertilization rate based for fertigation on soil testing.
§
Least significant difference at 5% level of significance.
나. 억제 재배
재배기간 중 기상 및 정식 후 시기별 토양 화학성
재배기간 중 하우스내 평균기온, 지중온도, 강우량 및 일조 시간은 Fig. 5와 같다. 하우스내 평균기온와 지중 10 ㎝의 평균지온은 모두 9월 하순부터 20°C이하로 경과되었다.
질소 관비처리에 따른 정식 후 시기별 pH, EC변화는 Table 6, 치환성 칼리 및 질산태질소 함량 변화는 Table 7과 같다. pH와 치환성 칼리는 질소 관비처리간 뚜렷한 경향이 없었으나 정식후 시기별 EC와 질산태질소 함량은 질소 관 비량 증가에 따라 높아지는 경향이었다. 특히 질소 관비 2.0배 처리에서는 정식 후 65일에 EC가 2.3 dS m
-1으로 나 타나 시설재배토양의 적정 EC기준인 2.0 dS m
-1이하를 벗 어나는 것으로 나타났다.
정식후 시기별 생토 추출액, 엽병즙액 중 NO
3-함량 및 오이 수량 정식 후 시기별 생토 추출액 및 엽병즙액
중 NO
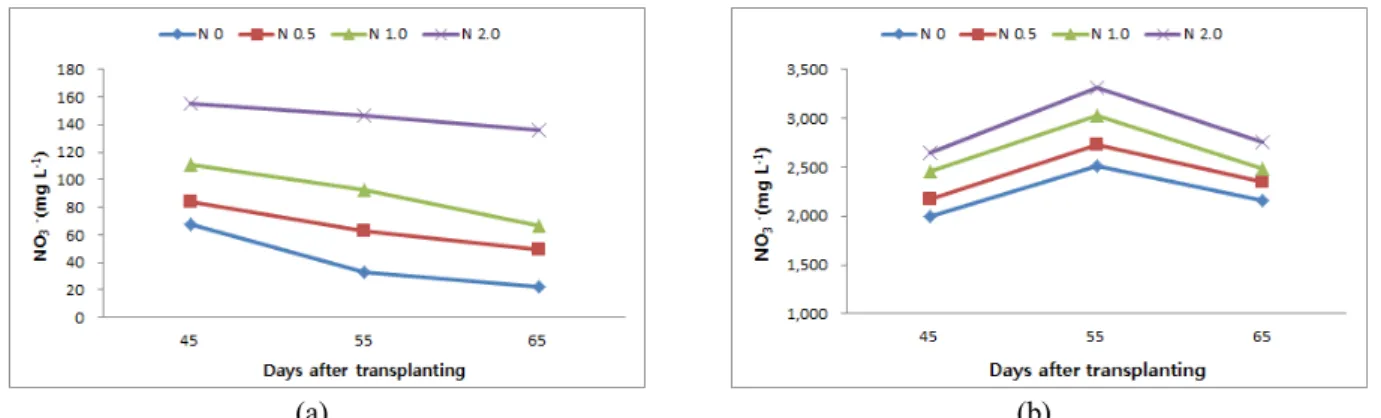
3-함량 변화는 Fig. 6과 같다. 생토 추출액 중 NO
3-함량은 질소 관비수준 모두 정식 후 45일부터 65일까지 감 소하였고 질소 관비수준이 높을수록 많았다. 엽병즙액 중 NO
3-함량도 질소 관비수준 모두 정식 후 55일까지 증가 후 감소하였고 질소 관비수준이 높을수록 많았다.
질소 관비수준별 오이 생육 및 수량은 Table 8과 같다.
오이 상품과 수량은 질소 관비 1.0배 (1,697 ㎏ 10a
-1) 대비 질소 관비 0.5배, 2.0배는 차이 없었으나, 질소 관비 무시용 은 21% 감수하였다. 생토 추출액 중 NO
3-함량과 수량간, 엽병즙액 중 NO
3-함량과 수량간 2차 회귀식은 모두 고도의 유의성이 인정되었으며, 생토 추출액 중 115 ㎎ L
-1NO
3-농 도 수준과 엽병즙액 중 2,700 ㎎ L
-1NO
3-농도 수준에서 최대의 수량을 나타내었다 (Fig. 7).
정식 후 시기별 엽병즙액, 생토 추출액의 NO
3-적정
함량 질소 관비수준 및 정식 후 시기별 엽병즙액과 생토
(a) (b)
(c) (d)
Fig. 5. Meteorological phenomena during cucumber retarding cultivation. (a) Daily mean temperature inside greenhouse. (b) Daily mean temperature under ground of 10cm inside greenhouse. (c) Amount of rainfall. (d) Duration of sunshine.
Table 6. Changes of soil pH and EC during the cucumber retarding cultivation by different nitrogen application rates.
Treatments pH EC
45DAT
†55DAT
†65DAT
†45DAT
†55DAT
†65DAT
†--- (1:5) --- --- dS m
-1---
Soil testing N 0
‡6.6 6.7 6.5 1.4 1.3 1.5
Soil testing N 0.5
‡6.7 6.6 6.5 1.5 1.6 1.7
Soil testing N 1.0
‡6.5 6.4 6.3 1.8 1.8 1.9
Soil testing N 2.0
‡6.3 6.2 6.1 2.0 1.9 2.3
†
Days after transplanting.
‡
0, 0.5, 1.0, 2.0 times of recommended nitrogen fertilization rate based for fertigation on soil testing.
Table 7. Changes of Ex.-K and NO
3-N concentration for soil during the cucumber retarding cultivation by different nitrogen application rates.
Treatments Ex.-K NO
3-N
45DAT
†55DAT
†65DAT
†45DAT
†55DAT
†65DAT
†--- cmol
ckg
-1--- --- mg kg
-1---
Soil testing N 0
‡0.41 0.41 0.39 27.0 37.8 31.3
Soil testing N 0.5
‡0.44 0.40 0.39 34.0 50.2 41.6
Soil testing N 1.0
‡0.38 0.46 0.35 57.2 62.9 56.1
Soil testing N 2.0
‡0.34 0.39 0.33 67.8 80.5 94.6
†
Days after transplanting.
‡
0, 0.5, 1.0, 2.0 times of recommended nitrogen fertilization rate based for fertigation on soil testing.
(a) (b)
Fig. 6. Changes of NO
3-concentration for soil solution and leaf petiole juice according to days after transplanting during the cucumber retarding cultivation. (a) NO
3-concentration of soil solution(soil : water = 1:5, v/v). (b) NO
3-concentration of leaf petiole juice.
Table 8. Growth properties and yields of the cucumber by different rates of nitrogen application during retarding cultivation under greenhouse.
Treatments Plant
length
No. of node
Stem diameter
Ratio of marketable fruit Marketable yield of fruit
2010 2011 Mean 2010 2011 Mean Index
㎝ plant
-1㎜ --- % --- --- f.w. kg 10a
-1---
Soil testing N 0
†328 40 10.7 77.5 67.8 75.3 1,310 1,361 1,335 79
Soil testing N 0.5
†331 40 11.1 81.0 69.1 76.8 1,536 1,610 1,573 93
Soil testing N 1.0
†333 41 11.2 82.2 73.3 78.6 1,677 1,717 1,697 100
Soil testing N 2.0
†336 41 11.3 77.3 72.0 75.7 1,630 1,773 1,701 100
LSD
‡--- --- --- --- --- --- --- - 190.6 - - 112.7 C.V(%) --- --- --- --- --- --- --- ----6.20 - -- 3.49
†
0, 0.5, 1.0, 2.0 times of recommended nitrogen fertilization rate based for fertigation on soil testing.
‡
Least significant difference at 5% level of significance.
(a) (b)
Fig. 7. (a) Relationship between the total fresh weight of cucumber and the NO
3-concentration of soil solution during retarding cultivation. (b) Relationship between the total fresh weight of cucumber and the NO
3-concentration of leaf petiole juice during retarding cultivation.
추출액의 NO
3-함량은 Table 9와 같다. 정식 후 시기별 NO
3-적정함량은 오이 상품과 수량이 많고 유의차가 없었 던 질소 관비 0.5배, 1.0배, 2.0배 처리 중에서 엽병즙액과 생토 추출액의 NO
3-함량이 질소 관비 1.0배, 2.0배 처리와 유의차가 있었던 질소 관비 0.5배의 정식 후 45일, 55일, 65 일과 질소 관비 2.0배의 정식 후 65일을 제외한 범위로 설
정하였다. 이와 같이 설정된 정식 후 시기별 엽병즙액 중 NO
3-적정함량은 정식 후 45일은 2,464±102~2,651±33, 55일 3,025±71~3,314±84, 65일 2,488±92 ㎎ L
-1이었으 며, 생토 추출액 중 NO
3-적정함량은 정식 후 45일은 111±
10~155±14, 55일 93±7~147±14, 65일 67±4 ㎎ L
-1로 나
타났다.
Table 9. NO
3-concentration of petiole juice and soil solution by different nitrogen application rates for fertigation during the cucumber retarding cultivation under greenhouse.
Survey items Treatments 45DAT
†55DAT
†65DAT
†Petiole juice (NO
3-, ㎎ L
-1)
Soil testing N 0
‡1,988±30 2,510±89 2,158±53
Soil testing N 0.5
‡2,172±74 2,727±79 2,347±55
Soil testing N 1.0
‡2,464±102 3,025±71 2,488±92
Soil testing N 2.0
‡2,651±33 3,314±84 2,760±77
LSD
§--- --- 133.4 --- --- 151.2 --- --- 138.4
Soil solution (NO
3-, ㎎ L
-1)
Soil testing N 0
‡68±4 33±4 22±2
Soil testing N 0.5
‡84±6 63±8 49±3
Soil testing N 1.0
‡111±10 93±7 67±4
Soil testing N 2.0
‡155±14 147±14 136±10
LSD
§--- --- 15.0 --- --- 16.0 --- --- 9.5
†
Days after transplanting (Sep. 9).
‡
0, 0.5, 1.0, 2.0 times of recommended nitrogen fertilization rate based for fertigation on soil testing.
§
Least significant difference at 5% level of significance.
Table 10. A simple diagnostic criteria of NO
3-concentration of leaf petiole juice and soil solution according to days after transplanting during the cucumber cultivation under greenhouse.
Survey items Semi-forcing cultivation Retarding cultivation
45DAT
†60DAT
†75DAT
†90DAT
†105DAT
†45DAT
†55DAT
†65DAT
†Petiole juice
(NO
3-, ㎎ L
-1) 2,300 ~2,800 2,900~3,400 2,600~3,300 2,400~3,000 2,100~2,300 2,300~2,700 2,900~3,400 2,300~2,600 Soil solution
(NO
3-, ㎎ L
-1) 150 ~230 70 ~130 40 ~100 60 ~120 60 ~90 100 ~170 80 ~160 60 ~80
†