선박 탑승자를 위한 다중 센서 기반의 스마트폰을 이용한 활동 인식 시스템
라지브 쿠마 피야레, 이 성 로°
Activity Recognition of Workers and Passengers onboard Ships Using Multimodal Sensors in a Smartphone
Rajeev Kumar Piyare, Seong Ro Lee°
요 약
상황 인식은 유비쿼터스컴퓨팅 환경에 대한 진화를 변화시켰고 무선 센서네트워크 기술은 많은 응용기기에 대 한 새로운 방법을 제시하였다. 특히, 행동 인식은 사람의 응용서비스를 제공하는데 있어 특정 사용자의 상황을 인 식하는 핵심 요소로 의학, 취미, 군사 분야에서 폭넓은 응용분야를 갖고 있고 사용반경의 확대에서도 효율과 정확 도를 높이는 방법에 크게 기여한다. 스마트폰 센서로부터 나오는 데이터로부터 프레임이 512인셈플 데이터를 얻 어, 프레임간50%의 오버랩을 갖도록 하고 Machine Learning Algorithm 인 WEKA Experimenter (University of Waikato, Version 3.6.10)을 써서 데이더로부터 시간영역 특징값을 추출함으로써 행동 인식에 대한 99.33%의 정 확도를 얻을 수 있었다. 또한, WEKA Experimenter의 사용기법인 C4.5 Decision Tree과 다른 방법인 BN, NB, SMO or Logistic Regression간의 비교실험을 하였다.
Key Words : sensor fusion, activity recognition, classification algorithms, feature extraction
ABSTRACT
Activity recognition is a key component in identifying the context of a user for providing services based on the application such as medical, entertainment and tactical scenarios. Instead of applying numerous sensor devices, as observed in many previous investigations, we are proposing the use of smartphone with its built-in multimodal sensors as an unobtrusive sensor device for recognition of six physical daily activities. As an improvement to previous works, accelerometer, gyroscope and magnetometer data are fused to recognize activities more reliably.
The evaluation indicates that the IBK classifier using window size of 2s with 50% overlapping yields the highest accuracy (i.e., up to 99.33%). To achieve this peak accuracy, simple time-domain and frequency-domain features were extracted from raw sensor data of the smartphone
http://dx.doi.org/10.7840/kics.2014.39C.9.811
※ 본 연구는 2013년도 정부(교육부)의 재원으로 한국연구재단의 지원을 받아 수행된 기초연구사업(No. 2009-0093828)과 미래창조과학 부 및 정보통신산업진흥원의 IT융합 고급인력과정 지원사업(NIPA-2014-H0401-14-1009) 및 2013년도 정부(미래창조과학부)의 재원 으로 한국연구재단(No.2011-0029321)의 지원을 받아 수행된 연구임의 연구결과임.
First Author : Department of Electronics Engineering, Mokpo National University, [email protected], 학생회원
° Corresponding Author : Department of Information Electronics Engineering, Mokpo National University, [email protected], 정회원
논문번호:KICS2014-05-174, Received May 8, 2014; Revised September 12, 2014; Accepted September 12, 2014
Ⅰ. Introduction
Cruise tourism is a fast growing and important branch of tourism. Thousands of tourists travel around the globe while staying at a sailing hotel, dining in a floating restaurant for days to months.
Therefore, it is vital to keep track of their health while onboard cruise ships. Over the last few years, activity recognition using accelerometer signals has become an active research area due to its large number of potential applications including context-awareness, healthcare, and active lifestyle [1,2]. For instance, patients with diabetes, cardiovascular disease, insomnia or obesity often follow well defined exercise routines (walking, jogging, running, or cycling) as a part of their treatment. Such human activities can be recognized by motion pattern analysis using wearable sensors, but this solution is obtrusive, and few users want to wear special shirts, bracelets or belts for that purpose[3,4]. Although this provides sufficient contextual information, placing sensors at multiple locations can become cumbersome for the wearer. With the increase in number of sensors, it also increases the complexity of the classification problems and the overall cost of the system.
Mobile phones have become a practical and popular activity tracking platform because people are accustomed to carry phones on a daily basis. This makes data easier to collect as compared to custom tracking systems. In addition, mobile phones eliminate the need to design custom hardware, because they have built in sensors, (such as tri-accelerometer, gyroscope, and magnetic sensor), Global Positioning System (GPS), Wi-Fi, Bluetooth, camera, proximity sensor, microphone, and so forth.
Furthermore, software creation and distribution are easier because open source tools allow anyone to create applications and deploy them on mobile phones. Thus, mobile phones conveniently contain all of the hardware and software capabilities to create a stand-alone activity tracking sys-tem, with the practical benefit that people wear them every day.
Most of the previous studies only utilized
accelerometer data acquired from the smartphone for physical activity recognition [5-7]. Lara et al. [8]
introduced a mobile platform for real-time human activity recognition. Their system is composed of a wearable device and a Bluetooth-enabled Android phone; experiments were performed in a sequential fashion which recognized walking, running and sitting activities. They analyzed the C4.5 tree family classification algorithm and produced acceptable results. In [5] Ravi et al. reported the results of their study for a small group of dynamic activities using a single triaxial accelerometer worn near the pelvic region. Four features were extracted from the accelerometer data (i.e., mean, standard deviation, energy, and correlation). In order to perform the classification task, they analyzed the performance of base-level classifiers and meta-level classifiers on two subjects, and achieved high accuracy. The sampling frequency was 50 Hz and window size was 5.12 seconds. They used the Plurality Voting classifier but complication may arise while increasing the number of subjects as well as dynamic activities. Zhao et al. developed a smartphone based activity reporting system using a three axial accelerometer. The system used decision tree and k-means clustering algorithm to recognize user’s activity[9].
However, accelerometer data only reflects the change of physical activity in linear acceleration, but angular velocity and orientation information were not reflected by an accelerometer. Generally, acceleration sensors have been applied in most of the physical activity recognition research works because they are small, inexpensive, light-weight, and consume little power [10]. However, the fusion of multiple sensors including several accelerometers, gyroscopes, GPS, camera, and infra-red (IR) motion detectors not only improves the results but is rather mandatory for an accurate activity recognition system, as noted by Kern, et al. [11]. In this research, a smartphone such as Samsung Galaxy S2 is employed as a multiple sensor device for data collection to recognize the interesting activities for daily activity recognition.
Moreover, this is one of the first research works
Avg. Min Max
Age (years) 26 25 30
Weight (kg) 69 60 85
Height (cm) 172 162 187
BMI (kg/m2) 24.9 18.5 29.9
Table. 1. Summary of Physical characteristics of the participants.
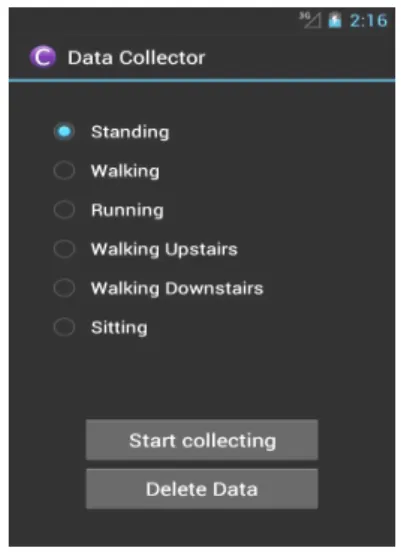
Fig. 1. Smartphone Data collection app.
in the field of physical activity recognition of workers and passengers onboard ships using smartphone which attempts to consider a variety of sensor data (e.g., accelerometer, gyroscope, and magnetometer) and to find the best set of sensors for a specific application. The rest of the paper is organized as follows: Section II provides the method of the physical activity recognition. The experimental results and discussion are presented in Sections III. Finally, Section IV concludes the paper.
Ⅱ. Methodology
2.1 Data Collection
To collect the activities dataset, four healthy subjects (2 males and 2 females) of different ages (between 25 and 30), heights and weights participated in this study. The characteristics of the participants are shown in Table 1. Participants were graduate students of Mokpo National University, Department of Electronics Engineering.
Six common dynamic activities were selected as the basic activities of daily life to be recognized—
walking, running, sitting, walking upstairs, walking downstairs and standing. A custom smartphone application was designed for data collection and annotation as shown in Fig 1. This application collects data from an accelerometer, a gyroscope and a magnetometer at 50 Hz and stored it on a SD card for offline analysis. Previous studies have claimed that sampling frequency between 22 Hz and 100 Hz is suitable for classifying different physical activities[12]. Before performing each activity, the subject would select the activity on a designed phone app. Each subject was requested to perform these activities in a naturalistic fashion (without fixed duration or sequence). The smartphone was
placed in the front pant pocket regardless of its orientation to record the activities. A pant pocket location is an acceptable solution from the user’s point of view, if the user wishes to use the smartphone for activity recognition.
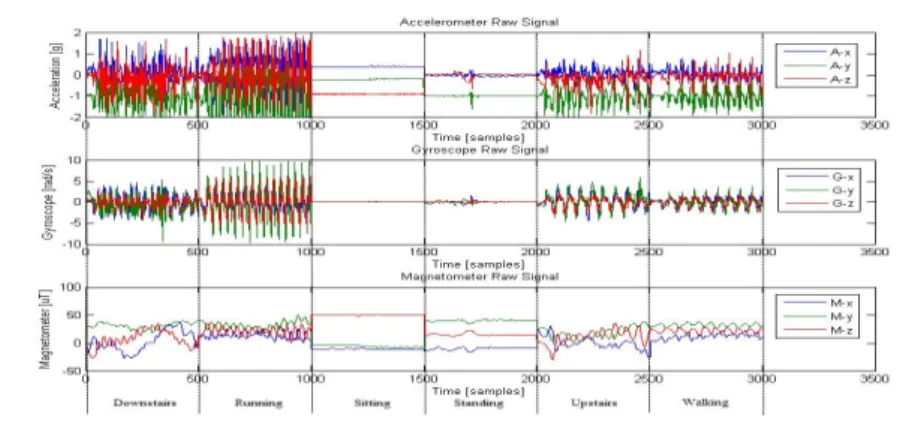
A representative data stream of all the three sensors for each activity is shown in Fig 2 to understand the difficulty of recognition. It can be observed from Fig 2 that sitting and standing do not show periodic behavior, but do have distinctive patterns while the other four activities which involve repetitive motions do illustrate periodic behavior based on the relative magnitudes of the x, y, and z values. For most activities, the larger variation is along y-axis values. To distinguish these minor differences in the data for the performed activities, we investigate suitable feature extraction methods for these dynamic activities.
2.2 Feature Extraction
The raw sensor data was labeled based on the performed activity. There were approximately 30,000 samples for each activity with a total of 160,200 samples. To recognize activity information, a feature-level fusion scheme is applied using the extracted features from each sensor instead of the raw sensor data. Since the extracted feature set contains richer information, integration at this level provides better recognition results. As the fusion
Fig. 2. Raw signal plots for the six different activities being studied.
Fig. 3. Multi-sensor data fusion.
does not use the raw sensor data, the scalability and sensor independency is increased; however, it requires transforming raw data to an appropriate features. Fig. 3 illustrates the procedure of feature level fusion by integrating multi-sensors data.
Smartphones are embedded with a high quality sensors which can measure and report values in three perpendicular directions (x, y, z). For example, the measurement range of the accelerometer is between -2g and +2g. The three measured acceleration value represent the direction of the acceleration, relative to the phone. While information for x, y and z accelerations can be extremely useful in the case of body worn sensors, where the orientation of a sensor is fixed, such regime of operation cannot be expected in our case.
Since a phone is a portable device, it is obvious that its position varies from person to person. Therefore to overcome the problem of orientation, these three values are then preprocessed and combined into a single value, which represents the magnitude of the sensor. Obtaining the magnitude r from the measurements (x, y, z) is simply done by taking the Euclidean norm i.e.:
(1)
This magnitude of the sensor is independent of the orientation of the phone adding an addition dimension for each sensor i.e., x, y, z and magnitude.
The sliding window method with 50% overlap was employed to divide the sensor signals into smaller time windows. Feature extraction on sliding windows with a 50% overlap has demonstrated reasonable results in previous works[3,5]. This window size is capable of capturing complete cycles in repetitive action activities such as walking, running and stair walking, whilst allowing for fast computation of features. At a sampling frequency of 50 Hz and window size of 2 seconds, each window with 50% overlap represents 1 second. The features were extracted from the sliding windows signals for activity recognition. Window size of 2 seconds was selected based on the previous studies[13,14]. Seven time-domain and one frequency-domain feature was extracted from each sliding window, giving a total of 28 attributes per sensor and 28 x 3 = 84 attributes for all three sensors. The choice of simple
No. Feature Description features generated 1 Minimum value for each axis (x,y,z
and magnitude) 4
2 Maximum value for each axis (x,y,z
and magnitude) 4
4 Standard Deviation for each axis
(x,y,z and magnitude) 4
3 Mean value for each axis (x,y,z and
magnitude) 4
5 Kurtosis value for each axis (x,y,z
and magnitude) 4
6 Skewness value for each axis (x,y,z
and magnitude) 4
7 Average energy over 3 axes 1 8 Inter-axis Correlations: xy, xz,yz 3 Table. 2. Summary of the set of features extracted.
statistic features is due to the simplicity and low computational cost. A description of each feature is presented in Table 2. These features have been used within previous works and have achieved acceptable levels of accuracy (~85%)[3,5,15].
Features 1-6 are standard time-domain statistical metrics. Feature 7-Energy is the sum of the squared discrete FFT (Fast Fourier Transform) component magnitudes of the signal. The sum is divided by the window length for the purposes of normalization and is presented as:
(2)
where are the FFT components of the window for the x-axis and is the length of the window.
Feature 8- Correlation has been shown to improve the detection of activities involving movements of multiple body parts [16]. Correlation is calculated between each pair of axes as the ratio of the covariance and the product of the standard deviations and is given by Equation 3:
(3)
These features are then used as an input for WEKA data mining software to train and build the classifiers. WEKA[17] is a collection of machine learning algorithms and offers a collection of visualization tools for data mining tasks.
2.3 Classification Models
One of the aims of this study is to investigate how well could the multi-modal sensors in a smartphone be used for movement recognition similar to the previous accelerometer based approaches. Various different classification models have been applied to the problem of human activity recognition. However, there is no universally accepted method of recognizing a particular set of activities and all approaches have associated limitations and benefits. For this study, in order to identify which machine learning algorithm provided the most accurate activity detection, six different classification algorithms were applied to the data.
These include: BN (Bayesian Network), NB (Naïve Bayes), J48 (C4.5 Decision Tree), SMO (Sequential Minimal Optimization), Logistic Regression and IBK (Nearest Neighbor with K=1). To identify which machine learning model achieved the best accuracy, a 10-fold stratified cross validation with ten iterations was performed using WEKA experimenter.
In practice, a 10-fold cross validation is the most widely used methodology to calculate the accuracy of a classifier[18].
Ⅲ. Activity recognition analysis and Discussion
3.1 Evaluation using different combination of sensors
The best set of sensors for physical activity recognition is the ones with the highest correlation with the different activity classes. Accelerometer sensors have been widely used for motion detection.
Gyroscope is useful for capturing user’s motion and device orientation changes. Orientation determination is a significant feature to distinguish among sets of on-body device placements and determining the device orientation in each placement. Magnetometer
Fig. 4. Classification accuracies of various classifiers with different fusion of sensors
Average Accuracy with Different Features (%) Classifiers All
Features
Time Domain
FFT Energy
J48 97.36 97.36 79
NB 95.93 96.06 68.75
BN 97.72 97.88 75.42
SMO 98.79 98.79 65.5
Logistic 98.76 98.51 75.82
IBK 99.33 99.4 75.4
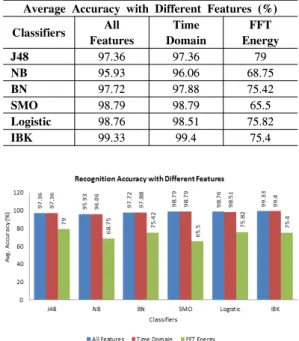
Table. 3. Evaluation results with different combination of features, sampling rate=50 Hz, window length = 2s and overlap percentage = 50%.
Fig. 5. Classification accuracy comparison based on Table 3.
sensor also helps determining the orientation as well as absolute heading information. The purpose of this experiment was to evaluate the performance of different sensors and their combinations using simple time-domain and frequency-domain features in order to assess which is the best combination for activity recognition. Six different classification models were evaluated with four different combinations of sensors. The results of activity recognition using different sensors have been investigated for the whole dataset. Fig 4 illustrates the overall classification accuracies of using different classifiers with all the features. It can be observed that, when used alone, accelerometer sensor data produced reasonable recognition accuracy, however, when combined with gyroscope and magnetometer, the overall performance was better than their individual performances in each case. Combining accelerometer with the gyroscope resulted in high recognition accuracy except for BN where performance was better for accelerometer combined with magnetometer. For the two-sensor combination, accelerometer with gyroscope (Acc+
Gyro) produced the best results. However, the optimum performance was achieved when all the sensors (Acc+Gyro+Mag) were used at the same time. It can be concluded that when considering a large number of activities for daily physical activity recognition, a single sensor might not produce best recognition accuracy; therefore, fusing the information from different smartphone sensors can improve the recognition performance drastically.
3.2 Activity recognition using different combination of features
The experiment in this section was carried out using different set of features computed from all the three sensor data. These features were maximum, minimum, mean, standard deviation, kurtosis, skewness, inter-axis correlation and FFT energy.
This section elaborates the repetition of 10-fold cross validation evaluation on the recommended classifiers with one of the features removed i.e.;
effect of using only time-domain features, only frequency-domain features and combination of all on the recognition accuracy. The results and comparisons of the 10-fold cross validation of the various classifiers with a certain feature removed from the training data are listed in Table 3 and Fig 5.
From Fig 5, using only time-domain features, from all feature set, did not produce accuracy that was statistically different with reference accuracy for all features. However, the removal of time-domain features (using only frequency-domain features) had caused the accuracy for all the classifiers to drop up to average of 23%. The IBK classifier had shown to
Classification Accuracy (%)
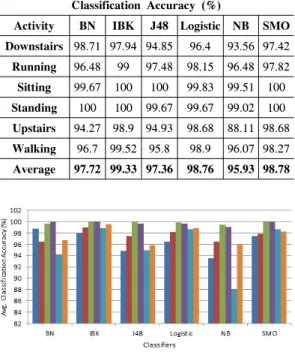
Activity BN IBK J48 Logistic NB SMO Downstairs 98.71 97.94 94.85 96.4 93.56 97.42 Running 96.48 99 97.48 98.15 96.48 97.82 Sitting 99.67 100 100 99.83 99.51 100 Standing 100 100 99.67 99.67 99.02 100 Upstairs 94.27 98.9 94.93 98.68 88.11 98.68 Walking 96.7 99.52 95.8 98.9 96.07 98.27 Average 97.72 99.33 97.36 98.76 95.93 98.78 Table. 4. Percentage of correctly classified instances for each activity using each of the six different classification algorithms. Results show the average percentage correctly classified instances for the 10 fold 10 iteration tests.
Fig. 6. Classification accuracy for each activity based on Table 4.
be the best classifier in this case with overall recognition accuracy of 99.33% using full feature set and 99.4% when evaluated with only time-domain features.
From the above observations, the results suggested that the classifiers built with only time-domain features provided comparable and acceptable accuracies as the classifier built with all feature sets. Based on these results, in cases where computing resources are limited, FFT- based features can be excluded and it is still possible to obtain equivalent recognition accuracies.
3.3 Offline recognition via 10-fold stratified cross validation
The purpose of this experiment was to compare the performance of different classifiers using all the features for each different activity. However, it is difficult to directly compare different classification algorithms due to lack of universally accepted
quantitative performance evaluation measures. Some researchers have used overall accuracy and F-measure as a performance index[15] while others have used True Positive rate (TPR)[19]. Therefore, this work adopts a similar evaluation approach. The 10-fold stratified cross validation with 10 iterations is used to evaluate the performance of different classifiers. After 10 iterations, the average classification accuracy is computed and reported as the overall accuracy. Fig. 6 shows the physical activity recognition rate for BN, IBK, J48, Logistic, NB and SMO classifiers using all the features. It can be observed that in most cases high levels of accuracy was achieved. For the two most common activities, standing and sitting, BN, IBK, J48 and SMO achieved accuracy of 100%. By investigating each activity’s recognition rate, it can be inferred that the classification models distinguish between the device placements and user activities with an overall accuracy of greater than 95%. In conclusion, the IBK classifier provided an overall highest recognition accuracy of 99.33%, classifying activities sitting and standing with an accuracy of 100%.
Ⅳ. Conclusion
This work contributes to the physical activity recognition domain using unobtrusive devices by multi-sensor information fusion. Three smartphone sensors, i.e.; accelerometer, gyroscope and magnetometer are used to recognize six daily physical activities. This research focuses on evaluation analysis of classifiers’ accuracy and providing reliable results for selecting the best set of sensors and features to optimize the performance of activity recognition applications for smartphones. As an improvement to previous works, accelerometer, gyroscope and magnetometer data are fused to recognize activities more reliably. The evaluation indicates that the IBK classifier using window size of 2s with 50% overlapping yields the highest accuracy (i.e., up to 99.33%). To achieve this peak accuracy, simple time-domain and frequency-domain features were extracted from raw sensor data of the
smartphone.
References
[1] L. G. Villanueva, S. Cagnoni, and L. Ascari,
“Design of a wearable sensing system for human motion monitoring in physical rehabilitation,” J. Sensors, vol. 13, no. 6, pp.
7735-7755, 2013.
[2] M. V. Albert, S. Toledo, M. Shapiro, and K.
Kording, “Using mobile phones for activity recognition in Parkinson’s patients,” J.
Frontiers in neurology, vol. 3, Nov. 2012.
[3] L. Bao and S. S. Intille, “Activity recognition from user-annotated acceleration data,” in Proc. Pervasive Computing, vol. 3001, pp.
1-17, Linz/Vienna, Austria, Apr. 2004.
[4] D. Gordon, J.-H. Hanne, M. Berchtold, T.
Miyaki, and M. Beigl, “Recognizing group activities using wearable sensors,” in Proc.
Mobile and Ubiquitous Systems: Computing, Networking, and Services, vol. 104, pp. 350- 361, 2012.
[5] N. Ravi, N. Dandekar, P. Mysore, and M. L.
Littman, “Activity recognition from accelerometer data,” in AAAI, vol. 5, pp.
1541-1546, 2005.
[6] J. R. Kwapisz, G. M. Weiss, and S. A. Moore,
“Activity recognition using cell phone accelerometers,” ACM SIGKDD Explorations Newsletter, vol. 12, pp. 74-82, 2011.
[7] M. A. Awan, Z. Guangbin, and S.-D. Kim, “A dynamic approach to recognize activities in WSN,” Int. J. Distrib. Sensor Netw., 2013.
[8] Ó. D. Lara, A. J. Pérez, M. A. Labrador, and J. D. Posada, “Centinela: A human activity recognition system based on acceleration and vital sign data,” Pervasive and Mobile Computing, vol. 8, pp. 717-729, 2011.
[9] Z. Zhao, Y. Chen, J. Liu, Z. Shen, and M.
Liu, “Cross-people mobile-phone based activity recognition,” in Proc. 22nd Int. Joint Conf. Artificial Intelligence, vol. 3, pp. 2545- 2550, 2011.
[10] T. M. Do, S. W. Loke, and F. Liu,
“HealthyLife: An activity recognition system with smartphone using logic-based stream reasoning,” in Mobile and Ubiquitous Systems:
Computing, Networking, and Services, pp.
188-199, 2013.
[11] N. Kern, B. Schiele, and A. Schmidt,
“Recognizing context for annotating a live life recording,” Personal and Ubiquitous Comput., vol. 11, pp. 251-263, 2007.
[12] C. V. Bouten, K. T. Koekkoek, M. Verduin, R. Kodde, and J. D. Janssen, “A triaxial accelerometer and portable data processing unit for the assessment of daily physical activity,” IEEE Trans. Biomedical Eng., vol.
44, pp. 136-147, 1997.
[13] W. Wu, S. Dasgupta, E. E. Ramirez, C.
Peterson, and G. J. Norman, “Classification accuracies of physical activities using smartphone motion sensors,” J. Medical Internet Research, vol. 14, 2012.
[14] S. J. Preece, J. Y. Goulermas, L. P. Kenney, and D. Howard, “A comparison of feature extraction methods for the classification of dynamic activities from accelerometer data,”
IEEE Trans. Biomedical Eng., vol. 56, pp.
871-879, 2009.
[15] I. Cleland, B. Kikhia, C. Nugent, A. Boytsov, J. Hallberg, K. Synnes, et al., “Optimal placement of accelerometers for the detection of everyday activities,” J. Sensors, vol. 13, pp.
9183-9200, 2013.
[16] R. Herren, A. Sparti, K. Aminian, and Y.
Schutz, “The prediction of speed and incline in outdoor running in humans using accelerometry,” Medicine and science in sports and exercise, vol. 31, pp. 1053-1059, 1999.
[17] Waikato environment for knowledge analysis (WEKA), Available: http://www.cs.waikato.a c.nz/ml/weka
[18] I. H. Witten and E. Frank, Data Mining:
Practical Machine Learning Tools and Techniques: Practical Machine Learning Tools and Techniques, 2nd Ed., Elsevier, 2005.
[19] M. Shoaib, J. Scholten, and P. Havinga,
“Towards physical activity recognition using smartphone sensors,” in Proc. IEEE 10th Int.
Conf. Ubiquitous Intelligence & Computing, Vietri sul Mare, Italy, pp. 80-87, 2013.
라지브 쿠마 피야례 (Rajeev Kumar Piyare)
2008년 4월:Bachelor of Ele- ctronics Engineering University of the South Pacific Under- graduate
2011년 9월:Post graduate Di- ploma in Electronics Engin- eering University of the South Pacific
2014년 8월:Mokpo National University Department of Electronics Engineering Master of Engineering
<관심분야> Machine learning, data mining, ubiquitous computing
이 성 로 (Seong Ro Lee)
1987년 2월 : 고려대학교 전자공 학과 학사
1990년 2월 : 한국과학기술원 전 기 및 전자공학과 석사 1996년 8월 : 한국과학기술원 전
기 및 전자공학과 박사 1997년~현재 : 목포대학교 정보
전자공학과 교수
<관심분야> 디지털통신시스템, 이동 및 위성통신시스 템, USN/텔레매틱스응용분야, 임베디드시스템