JESK
http://jesk.or.kr eISSN:2093-8462Universal User Interface Design of ATM Touch Screen Based on the Reaction Time
Yong Hwan Kim1, Byung Yong Jeong2, Myoung Hwan Park2
1Korea Workers' Compensation and Welfare Service, Ansan, 15532
2Department of Industrial and Management Engineering, Hansung University, Seoul, 02876
Corresponding Author Myoung Hwan Park Department of Industrial and Management Engineering, Hansung University, Seoul, 02876
Mobile : +82-10-9027-1576 Email : [email protected]
Received : August 25, 2016 Revised : September 01, 2016 Accepted : September 19, 2016
Objective:This study is concerned with the user interface (UI) design of touch screen based on the reaction time of Automated Teller Machine (ATM) user.
Background: Adopting the touch screen technology, the ATM service has recently established a new user interface different from the existing button-type interface.
Method: Experiments were conducted by simulating ATM touch screen layouts, and layouts were focused on location of menu buttons (left and right, top and bottom), number of menu buttons (8 and 12 buttons).
Results: The results show that there are significant differences in correction ratio and reaction time by user groups, types of menu location, and the number of buttons.
Conclusion and Applications: The results of this study can be used to provide baseline information for the interface design of ATM touch screen and the age differences in reaction time.
Keywords: ATM, UI design, Reaction time, Touch screen
Copyright@2016 by Ergonomics Society of Korea. All right reserved.
○
ccThis is an open-access article distributed under the terms of the Creative Commons Attribution Non-Commercial License (http://creativecommons.org/licenses/by-nc/3.0/), which permits unrestricted non-commercial use, distribution, and reproduction in any medium,
1. Introduction
ATMs are designed to provide banking services such as depositing, cash withdrawal, passbook updating, transfer, balance inquiry, etc., 24 hours a day and 365 days a year, just like Cash Dispensers (CD) with no need for a customer to visit a bank window.
The ATM service was first introduced in Korea by Shinhan Bank (formerly Chohung Bank) in 1984 (Bank of Korea, 2009).
Adopting the touch screen technology, the ATM service has recently established a new user interface different from the existing button-type interface. Since this new user interface induces interactive and intuitive manipulations by touching the button- patterns displayed on the touch screen, it is convenient and causes no aversion to users. The user interface elements of the user manipulation section, through which ATM users interact with the machine, include layout, color, font size, menu size, number of menu items, menu labeling, and feedback. Major researches on ATMs include the study on ATMs and keypads conducted by Lee et al. (2007), the study
et al. (2010), the study on ATM universal designs for accessibility conducted by Moon (2009), the study on ATM User Interface (UI) designs conducted by Cho and Park (2009), and the study on ATM usability for the elderly conducted by Kim and Lee (2008). It is thought that there needs to be a systematic, quantified UI guideline in consideration of elderly users.
The objective of this study is to examine the design of the first page of ATM touch screen in view of the universal design in reference to hit rates and reaction time data through experiments that were conducted among the elderly class and youth class, utilizing the touch screen model of currently used ATM first pages.
2. Methods
2.1 Experimental apparatus
ATM types include the stand type that is installed mainly in department stores, outlets, and convenient stores; the L-type that is used mainly in the financial industry; the mini type that provides only withdrawal and inquiry services just like CDs; and the wall type that is a drive-through ATM for drivers to use without getting out of the car (Moon, 2009). Among these, this study adopts the L-type, increasing in number, which is used mainly in the financial industry and contains various functions.
The experiment prototype designed for this study reflects the L-type ATM touch screen that is used in banks. This touch screen monitor is a 19-inch 4:3 TFT-LCD monitor of Samsung and its resolution is 1,280 x 1,024 pixels. The page size is reduced to 15 inch since the actual size of ATM screens being used in banks is only 15 inch (30.4 x 22.8cm), which is smaller than the used screen monitor (38 x 30cm). Specific elements of the prototype reflect the first page of ATMs being used in banks: the font is Gothic type and the size is 30pt just as in actual ATMs.
The monitor setting used in the experiment was designed based on Comnet-9000DM of Chungho ComNet Co., Ltd., which is a common form of L-type ATM. The height from the ground to the monitor was 77cm. The assessment scale of the prototype was the reaction time in the experiment, and a computer program was designed by means of Visual Basic by Microsoft to design the experiment screen and to measure the reaction time in each screen design.
2.2 Subject and experimental procedure
For the experiment with the ATM interface model, 40 individuals were selected as the subject: 20 youths (10 male and 10 female subjects) and 20 elderly ones in their 60s (10 male and 10 female subjects) who all had used ATMs. As they stated in interviews, they would use ATMs at least once a month. They were all right-handed and had no problem with their eyesight or hearing ability.
The youths were 23.9 ± 2.5 years old while the elderly ones were 63.5 ± 4.2 years old. As for the number of ATM uses per month, the youths used the ATM 3.2 times a week while the elderly ones 2.1 times a week.
Table 1 shows research variables. As for independent variables, the subject user groups were divided to 4 levels depending on their age and sex; 6 levels of menu arrangements (layout of menu) were designed; and 2 levels of the menu button numbers were designed. The number of experimental combinations for each subject was 2 (no. of menu items) x 6 (layouts) = 12. The same experiment was repeated twice to analyze the effects of interaction, and thus 24 different combinations were attempted by each subject. Dependent variables included the total reaction time in each experimental condition and hit rates. The experimental combinations were attempted for each subject in random order. The data of reaction time was analyzed using Minitab. Figure 1 shows scenes of male or female subjects' experiments. The first page illustrates the layout where 8 menu buttons were arranged in the left and right lines.
2.3 Experimental model
As for the research variables, an analysis model to find out the optimal design elements was developed as follows:
y
ijk : Reaction time or hit rateα
i : User group (1-male youth, 2-female youth, 3-male elderly, 4-female elderly)β
j : Layout of menu (1- both left and right, 2- both top and bottom, 3- tool bar type-left, 4- tool bar type-right, t- Tool bar type-top, 6- tool bar type-bottom)g
k : Number of menu buttons (8 buttons, 12 buttons)(β g )
jk: interaction of layout of menu and number of menu buttonse
ijk : Error termIn the analysis model,
α
i indicates the variable of user characteristics, which were divided into 4 levels: male subjects in their 20s, female subjects in their 20s, male subjects in their 60s, and female subjects in their 60s.β
j indicates the layout of menu. There were 6 different arrangement settings: both left and right side arrangement, both top and bottom arrangement, tool bar type (buttons put together) left side arrangement, tool bar type right side arrangement, tool bar type top arrangement, and tool bar Table 1. Research variablesClassification Variables Level
Independent Variable
Age, sex 20s (Male, Female), 260s (Male, Female)
Layout of menu Dispersed Layout (both left and right, both top and bottom), Tool bar type (left, right, top, bottom)
Number of menu buttons 8buttons, 12buttons Dependent
Variable
Hit rate Pressing same button as required
Reaction time Time between pressing start button and answer button
of 8 menu buttons and 12 menu buttons.
(β g )
jk indicates interactions of the layout of menu and number of buttons.3. Results
3.1 Analysis of hit rates
To analyze whether there are significant difference in hit rates depending on the user group, layout of menu, and number of menu buttons, ANOVA (analysis of variance) was conducted. The result is presented in Table 2. As shown in Table 2, with the significance level being 0.05, there was a statistically significant difference in hit rates depending on the user group (
p
<0.001). In contrast, there was no statistically significant difference in hit rates depending on the layout of menu, number of buttons, and interactions between the layout and number of buttons (p
>0.05).Figure 2 compares the average hit rates of each user group. As shown in this figure, the hit rates of the subjects in their 20s were higher than those of the subjects in their 60s. Among the subjects in their 20s, the hit rates of the female were higher than those Table 2. ANOVA of hit rate
Factor dof SS MS
F p
-valueUser group 3 0.66688 0.22226 6.6 0.000*
Layout of menu 5 0.24709 0.04941 1.47 0.198
Number of menu buttons 1 0.00504 0.005 0.15 0.700
Layout of menu * Number of menu buttons 5 0.16894 0.03379 1 0.415
Error 941 31.70284 0.03369
Total 955 32.79079
*
p<
0.05*dof=degree of freedom, SS=Sum of squares, MS=Mean square
of the male. In contrast, the hit rates of male subjects in their 60s were higher than those of female subjects in their 60s.
3.2 Analysis of the total reaction time
To examine if there would be a significant difference in the total reaction time depending on the user group, layout of menu, and number of buttons, ANOVA was conducted. The result is presented in Table 3. As shown in the table, with the significance level being 0.05, there was a statistically significant difference (
p
<0.001) in the total reaction time depending on the user group. There was also a statistically significant difference depending on the layout (p
<0.001) and number of menu buttons (p
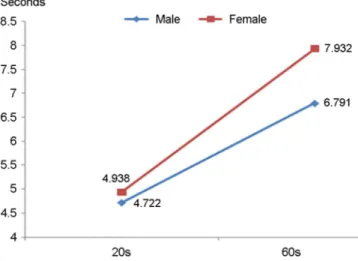
<0.001).Figure 3 compares the total reaction time depending on the age and sex. As shown in Figure 3, the total reaction time of those in their 20s was shorter than that of those in their 60s. The total reaction time of the male both in their 20s and 60s was shorter than that of the female.
Table 3. ANOVA of Reaction time
Factor dof SS MS
F p
-valueUser group 3 1689.88 564.55 193.29 0.000*
Layout of menu 5 79.39 15.95 5.46 0.000*
Number of menu buttons 1 142.04 142.14 48.67 0.000*
Layout of menu * Number of menu buttons 5 10.82 2.16 0.74 0.593
Error 941 2748.41 2.92
Total 955 4670.54
*
p<
0.05*dof=degree of freedom, SS=Sum of squares, MS=Mean square
Figure 4 compares the total reaction time depending on the layout of menu. As shown in this figure, the shortest reaction time was measured in the 'both top and bottom' arrangement. As the menu buttons were arranged 'tool bar type-bottom' arrangement, the total reaction time became the longest. In addition, the reaction time of divided arrangements was shorter than those of tool-bar type.
Figure 5 compares the total reaction time depending on the number of menu buttons. As shown in Figure 5, the total reaction time when there were 8 buttons was shorter than when there were 12 buttons.
3.3 Comparison between the elderly and the youths
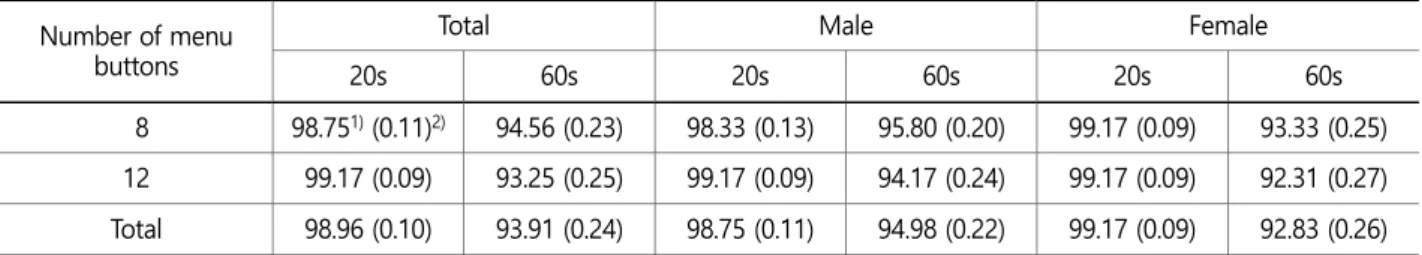
Table 4 compares the hit rates of the menu with 8 buttons and those with 12 buttons depending on the sex and age. As shown in Table 4, the hit rates were determined based on whether the subjects remembered and chose the correct answer among given statements on the screen after one of the statement was shown once. In general, the hit rates of those in the 60s were lower than the rates of those in the 20s. The difference in hit rates depending on the age was more significant among female subjects: Among youths in their 20s, there was no significant difference in hit rates regardless of the number of menu buttons. In contrast, the rates decreased among those in their 60s as the number increased. As for the difference in hit rates depending on the gender, the difference among female subjects was smaller than that among male subjects as the number of buttons increased.
Table 5 compares the average and standard deviation of the total reaction time depending on the sex and age when the number of menu buttons was 8 and 12 respectively. As shown in Table 5, the reaction time of the elderly subjects in their 60s was longer than that of the youths in their 20s, and the difference in the total reaction time depending on the age was more significant among female subjects than male subjects. As for the difference in the total reaction time depending on the number of menu buttons, the difference in the reaction time depending on the age was more significant among female subjects than male subjects when the number of buttons increased to 12.
4. Discussion and Conclusion
To define touch screen design principles for the first page of ATM screen, this study examined the total reaction time and hit rates of users depending on the user group, layout of menu, and number of menu buttons. The experimental result of this study showed that as the number of menu items reduced, the time for menu navigation decreased accordingly. This corresponded to the finding Table 4. Hit rate by number of menu buttons, sex and age group
Number of menu buttons
Total Male Female
20s 60s 20s 60s 20s 60s
8 98.751) (0.11)2) 94.56 (0.23) 98.33 (0.13) 95.80 (0.20) 99.17 (0.09) 93.33 (0.25) 12 99.17 (0.09) 93.25 (0.25) 99.17 (0.09) 94.17 (0.24) 99.17 (0.09) 92.31 (0.27) Total 98.96 (0.10) 93.91 (0.24) 98.75 (0.11) 94.98 (0.22) 99.17 (0.09) 92.83 (0.26)
1)Mean, 2)Standard Deviation
Table 5. Response time by number of menu buttons, sex and age group
Number of menu buttons Total Male Female
20s 60s 20s 60s 20s 60s
8 4.547 6.878 4.378 6.321 4.716 7.431
12 5.113 7.845 5.065 7.258 5.16 8.447
Total 4.83 7.36 4.722 6.791 4.938 7.932
lower left side to the right side (Fujimura, 2004). Hence, it was thought that in order to save a user's reaction time on the first page, it was best to arrange menu items in both the top and bottom on the first page of the ATM's touch screen interface.
This study comparatively examined the hit rates and reaction times of those in their 60s and 20s. As a result, it turned out that elderly ones needed more time and effort to process the mental load as the quantity of information to handle increased. Since elderly users would need more time and be less accurate than young ones as the number of screen items to be processed increased and deeper information was presented, it was necessary to integrate or reduce screen items and to decrease the depth of information to be processed. In addition, the quantity of information to be handled at each time also needed to be reduced.
To reduce the screen navigation time, the number of menu buttons that a user had to recognize needed to be reduced as suggested regarding the design of ATM touch screen interfaces. For elderly users, it was necessary to maintain a high level of compatibility, and the signals needed to be displayed in a greater scale or more brightly. Providing ways of education or practice to be familiar with similar data processing formats may be useful as well. Unless it causes security problems, a navigation function to let the user recognize the current step in the entire process and a function to return to a previous step in case of errors or mistakes also need to be taken into consideration.
This study on interface design assumes that reducing the reaction time of an ATM user enhances the user's level of satisfaction and that a button arrangement of the shortest reaction time is the optimal route for interface design. This assumption was established solely based on existing methods of assessing visual interfaces based on reaction time. There has been no research finding that the reaction time of an ATM touch screen user affects the user's level of satisfaction, which is a limitation for this study.
There also is the limitation that experiments were conducted not for all age groups of ATM users. Thus, a future study will need to examine the correlation between the reaction time and the level of satisfaction. Nonetheless, this study is of significance in that it collects and analyzes quantitative data rather than using one of the existing qualitative methods that are commonly used to assess user interfaces.
Acknowledgements
This research was financially supported by Hansung University.
References
Bank of Korea,
Electronic Financial Transaction Report
, 2009. 05.Cho, K.M. and Park, S.H., A Study on Interface Guideline for ATM Interface Suitable to User's Mental Model,
Journal of Digital Design
, 9(1), 41-50, 2009.Fujimura, M.,
A Plan Worth of Ten Billion
(translated in Korean), New Proposal, Seoul, 2004.Hong, S.K., Park, J.C. and Kim, S.S., Input Performance of the Old Adults in Touch Interface,
Journal of the Ergonomics Society of Korea
, 29(4), 605-610, 2010.Kim, H.J. and Lee, K.M., A Study on the Usability of Automatic Teller Machine for the Aged Ⅰ,
Archives of Design Research
, 21(1), 127-136, 2008.Lee, D.H., Kim, D.J., Na, S.H. and Chung, M.K., The effect of input device type on aging for numeric entry task,
Proceedings of
Korean Institute of Industrial Engineers
, Spring, 553-559, 2007.Moon, S.,
A Study on the ATM Design Based on Universal Design
, Master's Dissertation, Kookmin University, 2009.Author listings
Yong Hwan Kim: [email protected]
Highest degree: M.S., Department of Industrial and Management Engineering, Hansung University Position Title: Assistant Manager, Korea Workers' Compensation and Welfare Service.
Area of Interest: Ergonomics, Safety & Health management, UX design.
Byung Yong Jeong: [email protected]
Highest degree: PhD, Department of Industrial Engineering, KAIST
Position Title: Professor, Department of Industrial and Management Engineering, Hansung University Areas of interest: Ergonomics, Safety and Health Management
Myoung Hwan Park: [email protected]
Highest degree: PhD, Department of Industrial Engineering, KAIST
Position title: Professor, Department of Industrial and Management Engineering, Hansung University Areas of interest: Management Science, Innovation Engineering