JESK
http://dx.doi.org/10.5143/JESK.2015.34.6.563 http://jesk.or.kr eISSN:2093-8462Study on Design Research using Semantic Network Analysis
Jaehee Chung¹, Ken Nah², Sungbum Kim³
¹Culture & Design Management, Yonsei University, Incheon, 21983
²Design Management, IDAS Hongik University, Seoul, 04066
³IT Convergence, Kumoh National Institute of Technology, Gumi, 703-701
Corresponding Author Ken Nah
Design Management,
IDAS Hongik University, Seoul, 04066 Mobile : +82-10-3054-7858
Email : [email protected]
Received : August 18, 2015 Revised : September 09, 2015 Accepted : October 01, 2015
Copyright@2015 by Ergonomics Society of Korea. All right reserved.
○
ccThis is an open-access article distributed under the terms of the Creative Commons Attribution Non-Commercial License (http://creativecommons.org/licenses/by-nc/3.0/), which permits unrestricted non-commercial use, distribution, and reproduction in any medium, provided the original work is properly cited.
Objective:This study was conducted to investigate the potential of sematic network analysis for design research.
Background: As HCD (Human-Centered Design) was emphasized, lots of design research methodologies were developed and used in order to find user needs.
However, it is still difficult to discover users' latent needs. This study suggests the semantic network analysis as a complementary means for design research, and proved its potential through the practical application, which compares multi-screen purchase and usage behaviors between America and China.
Method: We conducted an in-depth interview with 32 consumers from USA and China, and analyzed interview texts through semantic network analysis. Cross cultural differences in purchase and usage behaviors were investigated, based on measuring centrality and community modularity of devices, functions, key buying factors and brands.
Results: Americans use more services and functions in the multi-screen environment, compared to Chinese. As a device substitutes other devices, traditional boundaries of the devices are disappearing in the USA. Americans consider function to recall Apple, but Chinese consider function, design and brand to recall Apple, Sony and Samsung as an important brand at the time of their purchase.
Conclusion: This study shows the potential of semantic network analysis for design research through the practical application. Semantic network analysis presents how the concepts regarding a theme are structured in the cognitive map of users with visual images and quantitative data. Therefore, it can complement the qualitative analysis of the existing design research.
Application: As the design environment becomes more and more complicated like multi-screen environment, semantic network analysis, which is able to provide design insights in the intuitive and holistic perspective, will be acknowledged as an effective tool for further design research.
Keywords: Design research, Semantic network analysis, Cross-cultural study, Multi- screen purchase and usage behaviors
1. Introduction
A language is a means to directly and precisely express one's thinking and feelings,
and also is a means of communication that can easily cause the errors of interpretation,
according to audience's subjective interest and understanding. As HCD (human-centered design) becomes important gradually, a designer tries to identify user needs through various research methods, and the most general method is to conduct an interview with users. Although an interview sufficiently provides information on the needs that a user perceives and willingly expresses at the time concerned, the interview hardly provides information on other areas. Due to such a limitation, the diverse observation techniques of ethnography are used for design research; however, they are used limitedly, because enormous time and cost are required. This study reviews the utilization possibility of the semantic network analysis in design research by analyzing the interview texts using the semantic network analysis method. The semantic network analysis is a method using the texts showing latent context through structuralization in a quantitative and visual way, in addition to the details directly expressed by a user in an interview. This study conducted interviews the American and Chinese users under the theme of multi-screen purchase and usage behaviors, and drew results by applying the semantic network analysis in order to verify the practical possibility of semantic network.
The future design environment will become a system, in which various devices and services will be intertwined and will co-exist in a complex way. Designers will also play a role of designing individual subjects from the holistic system perspective, rather than simply designing one subject. Therefore, a holistic and analytic method that can complement and verify designer's intuitive interpretation and understanding is forecast to be needed. The semantic network analysis can be an efficient alternative to achieve such a goal.
2. Significance and Trend of Design Research 2.1 Human-centered design and design research
NPD (new product development) consists of the following six stages: establishing a need, analysis of task, conceptual design, embodiment of design, detailed design and implementation (Howard et al., 2008). An NPD Team carries out design research by collecting a variety of design information including design cases, market trends and new technologies in order to draw creative design concepts (Wodehouse and Ion, 2010). Because the past design was technology-centered, or design-centered (Friess, 2010), the design research was centered on technology and design. However, design research concentrates its attention and efforts on identifying user needs using various methods, as design recently changes to human-centered design more and more.
According to ISO 13407 standard (ISO 1999), HCD (human-centered design) actively makes users participate in the design process in an effort to accurately understand users' behaviors and experiences (Friess, 2010). There are very diverse design research methodologies for HCD. Design research methodology can be classified into two methodologies depending on the stage users partake in the new product development process: One is the research method carrying out observation, interview and survey to grasp user's interest and needs in the previous stage of conceptual design. Plowman (2003) divided various research methods into the horizontal axis of qualitative or quantitative research and the vertical axis of semantic or visual data as shown in Figure 1.
Ethnography, used for in-depth understanding of users in the most natural state, was used in cultural anthropology by Malinowski in 1920 for the first time. As ethnography was utilized in the business area, namely, in the NPD area, observation period and the number of observation subjects sharply decreased. As shown in Figure 1, most design researches are concentrated on qualitative research.
As original ethnographic research scope diminished in design research, questions on the reliability of research outcomes were
gradually raised. Consequently, people gradually began to have interest in what people make in addition to what people say and
what people do (Sanders, 2006). This developed into another research method that makes co-design desired by users through
letting users participate in the conceptual design stage. Steen (2011) added such co-design's user research method to the
ethnography mentioned above, and summarized it as shown in Figure 2. Participatory design, ethnography, lead user approach,
contextual design, co-design and empathic design belong to the method. The horizontal axis is an approach from the designer's
or user's position, and the vertical axis is research or design-centered activity. Participatory design lets general users participate
http://jesk.or.kr
in design work, while lead user approach lets lead users participate in design work, and co-design lets entire general people in addition to users participate in design work. Contextual design is to experience users' environment, and design based on such an experience. Empathic design is to design from a user's position more actively using a method like a role play. Ethnography is a research activity in the stage prior to conceptual design observing user's actual usage of a product and finding problems as mentioned above.
2.2 Limitation of design research
As the design research method for HCD develops very diversely and widely, designers can design on the basis of more accurate and meaningful information on users. Nonetheless, design research outcomes have some limitations. First, absolutely trusting users' interview details is risky. The reason is that users cannot perceive their needs in reality, or they are reluctant to talk about their needs frankly in the interview process, although they perceive (Van Kleef et al., 2005). Second, there is a risk that small number of users' opinion may be regarded as an absolute opinion. As examined above, design research is mostly qualitative research targeting small number of users, and therefore design outcomes unsuitable for a majority of users can be mass-produced, if design is made by excessively relying on the research outcome (Stewart and Williams, 2005). Third, a probability of subjective errors can be high in the interpretation of research outcomes. In design research, an interpretation is made by collecting characteristic responses out of the speech details of the users participating in the research. Actually, final outcome can greatly differ according to interpreting person's capability, work experience, view of value and interest (Lee and Lee, 2012). Fourth, there is a difficulty in decision making, due to the lack of quantitative data. Since business decision making is carried out, centered on quantitative data in general, it is very difficult to make a business decision, based on the qualitative outcome of design research (Liu, 2010). In conclusion, the ultimate goals of design research of HCD are: 1) How accurately the interest and needs of users can be identified, 2) How accurately qualitative outcomes can be interpreted and properly used for decision making. To this end, an effort to overcome the limitations of each research method is made by using various qualitative and quantitative researches simultaneously.
2.3 Trend of design research 2.3.1 Cognitive perspective
Design research so far has been developed in various modes, based on "what people say, what people do and what people make"
like the suggestion of Sanders (2006). However, the limitations from the user aspect including the number of users participating
in the research and the reliability of expressions, and from the interpreter aspect, such as subjectivity of interpretation, demanded
new methods in design research. The most representative method is a psychophysiological method that measures activity changes
of physiological organs triggered by psychological state through objective physical indicators (Lee and Ahn, 2009). Eye tracking,
EEG (electroencephalogram), HR (heart rate) and EMG (electromyogram) belong to this method. These are positively utilized as
a complementary alternative of existing research method recently, due to the reliability and objectivity of data. Such a method,
however, may cause unnatural experience owing to the need to be attached on human body and the measuring equipment is
expensive. Also making clear definition of psychological phenomenon on body responses is not easy. All these can be drawbacks
(Lee and Ahn, 2009). However, these psychophysiological methods have significance in that they can measure unconscious thinking
and feelings in the other side of human's conscious expressions. From the aspect to objectively observe human's inner side, the
semantic network analysis in the similar context of the psychophysiological method can be considered. Although the semantic
network analysis is not universally used in the design research area, it can be used as a means complementing qualitative analysis
on interviews from the aspect of identifying human's cognitive structure through semantic analysis. Because semantic network
analysis shows human's thinking structure through digitation of quantitative data, it is expected to play a complementary role
in reviewing and interpreting the qualitative analysis results of interviews.
http://jesk.or.kr
2.3.2 Technological perspective
The design environment becomes more complex recently. Together with the advent of smart devices, the fusion of the manufacturing and service industries has become a general phenomenon. One device was independently used in the past, however, devices are not only used through physical connection, but they are used in a closely combined way nowadays to the extent that classification of device and service is obscure. A designer faces with the complicated design environment to consider surrounding numerous factors in order to design one product, unlike the past simply designing one product independently. Such a change trend accelerates furthermore, and the change scope is expanded from IT devices to the fields of fashion, automobile, architecture and daily necessities. Almost all the products will be under the interaction environment constantly giving and receiving signals through partial connection with complex systems. Such a phenomenon will affect the entire system and individual products in an unexpected manner (Farrell and Hooker, 2013). The future design environment will demand a new alternative that can complement existing design research methods and qualitative analysis. The existing qualitative analysis can draw very accurate and meaningful insights regarding user's attitude and usage mode on individual devices, but it has a limitation in drawing insights from the comprehensive perspective analyzing mutual correlation between devices, in addition to individual device's role in the complex environment. Design research from a technical perspective, through which the function and role of a product can be examined tridimensionally within the relationship between the whole and part, will be demanded anew. As an example of the complex design environment, examination through semantic network analysis by obtaining whole prospect on the function and role of a device in the multi-screen environment is considered to be meaningful from such a perspective.
3. Semantic Network Analysis 3.1 Semantic network analysis
Semantic network is a methodology analyzing the nodes indicating concepts and the strength and characteristics of link, which is a correlation between concepts (Cowley and Mitchell, 2003; Grebitus and Bruhn, 2008). The semantic network analysis has significance in that the thinking, cognitive structure and schema of human's inner side can be understood more comprehensively through the language humans speak (Jameson, 2004; Jonassen et al., 1993; Lehmann, 1992; Olson, 1978). Semantic network analysis was used by Danowski (1982) for the first time. Danowski interfered the meanings contained in texts by applying the network technology, and this became an opportunity to analyze the meanings delivered through texts by observing network structure indicated from the natural language (Danowski, 1982; Doerfel, 1998; Rice and Danowski, 1993; Woelfel and Fink, 1980).
Semantic network analysis has been called differently depending on researchers, such as word network, concept network, text network and semantic network. Actually, names have been used in a mixed way (Park and Chung, 2013). This study uses the concept of semantic network as the concept considering relationship directly expressed in the texts and latent context (Danowski, 1982; Ryan and Bernard, 2000; Popping, 2003). The semantic network analysis explains the whole meaning of texts by visualizing it in spatial structure, after drawing the words to be analyzed in the texts according to their frequency and importance, and by analyzing the importance and correlations of the words using network methodology (Zhang et al., 2014; Lee, 2014).
Semantic network analysis conducts an analysis on the basis of the indicators of community structure indicated through grouped words, based on centrality and modularity evaluating individual word's impact (Henderson et al., 1998) (Girvan and Newman, 2002;
Newman, 2004; Newman and Girvan, 2004). Centrality consists of three indicators, namely, degree centrality, closeness centrality and betweenness centrality, and these mean the size and strength between links connecting each node (Iacobucci et al., 1996).
Grebitus and Bruhn (2008) defined the three indicators of centrality as follows: Degree centrality is an indicator showing the number of other words (attributes) that one word (attribute) is linked with, and this indicates the impact of a word (attribute).
Closeness centrality is an indicator showing how closely one word (attribute) is linked with other words (attributes), namely it
indicates mutual dependence of words (attributes). Betweenness centrality is an indicator showing a possibility of activating two
words (attributes) or its own activation by being located between two words (attributes), namely it indicates the control of words (attributes). Subnetwork means the group of members having similar attributes within a social network. Within the semantic network, the subnetwork means the group of words having similar meanings within the semantic network (Lee and Lee, 2012).
Therefore, the subnetwork is the expression of categorization of similar concepts within human's cognitive structure.
3.2 Implication of semantic network analysis
Semantic network analysis has been used in psychology, library and information science and linguistics (Lee, 2014). However, its utilization area is gradually expanded (Rice and Danowski, 1993). Lee (2014) analyzed 53 academic papers related with semantic network analysis in the domestic academic paper database, and examined the research trend of semantic network analysis. The texts used for the analysis are mainly interview data, discussion data, news articles, study literature and record data, and the mainstream of analysis content is semantic analysis, trend analysis and comparative analysis targeting trend, tendency and core topic for discussion. The areas, where semantic network analysis has been conducted the most actively, are public administration/policy studies (13), pedagogy (6), library and information science (5) and journalism and mass communication (4). The most analogous area to design is industrial engineering (1). In Korea, semantic network analysis is researched, centered on sociology, and library and information science. It is gradually expanded to marketing and brand areas abroad (Henderson, 1998). The reason is that marketing experts are relatively familiar with the basic principles of semantic network analysis, and they trust the semantic network analysis as a means to understand associated concepts within customers' cognitive structure on brands and MOT (moment of truth).
The user interview of design research carried out for the purpose of new product development is an area that can very effectively utilize semantic network analysis. The reason is presented below: First, formal condition for semantic network analysis is met, because user interview text exists. Second, qualitative analysis has limitations in grasping complex structural relationship between multiple concepts, although it has no problem to identify core correlations between some concepts (Lee et al., 2010; Chung et al., 2013; Lee, 2014). Third, qualitative analysis presents only conceptual results composed of mainly texts, but semantic network analysis presents numerical and visual image outcomes, and therefore intuitive and tridimensional understanding becomes much easier on context. Fourth, semantic network analysis shows the importance and correlation of concepts with digitation, and therefore it becomes helpful to follow-up stage and business decision making. Fifth, although a possibility of subjective bias to be involved with is very high in qualitative analysis (Lee, 2014), semantic network analysis can play a complementary role of reviewing and correcting such a subjective interpretation (Lee and Lee, 2012). In this regard, the utilization of semantic network analysis as a complementary alternative of existing qualitative analysis will be high, since it is used for design research, and makes user's inner cognitive structure visible with a quantitative and visual method.
4. Existing Studies on Multi-screen Environment 4.1 Multi-screen usage behaviors
Since the multi-screen industry centered on smartphone, tablet, smart TV, notebook and desktop PC is the area attracting the most attention recently in the consumer electronic devices manufacturing and service industries, multi-screen studies are conducted very actively in industries, as well as academia. Multi-screen studies can be divided into two study areas: One is multi-screen usage behaviors (Oh, 2012; Lim and Lee, 2013; Cho, 2013; Choi et al., 2014; Chang, 2014), and the other is the user interface of multi-screen (Brdiczka, 2008; Tomlinson et al., 2009; Wäljas et al., 2010; Dees, 2011; Ghiani et al., 2013; Zhang et al., 2013; Seok and Pan, 2011; Kim, 2013).
Studies on multi-screen usage behaviors have been centered on service adoption factors and user satisfaction. Concerning the
http://jesk.or.kr
representative study on adoption factors, Oh (2012) analyzed the factors affecting multi-screen service acceptance intention, based on technology adoption model: Davis, 1985. The core factors affecting potential users' adoption intention were perceived usefulness (β=.568, t=11.466, p <.001) and perceived ease of use (β=.306, t=6.538, p <.001). Perceived usefulness is the perception that various and useful services can be used through a multi-screen, and the perceived ease of use is the perception that multi-screen service can be used easily and conveniently. The external variables affecting the perceived usefulness and perceived ease of use were interactivity (β=.339, t=3.868, p <.001) and self-efficacy (β=.624, t=9.983, p <.001). Interactivity is the perception that the information I desire can be used anywhere, anytime, and self-efficacy is the perception that new technology or service can be used by oneself better than others. Oh's study reveals that the adoption factors of multi-screen service are derived from the perception that a variety of information and services suitable to oneself can be used easily and conveniently anytime.
The representative study on user satisfaction with multi-screen service is a study on actual use motive of and dissatisfaction with multi-screen service by Lim and Lee (2013). Use motive was shown in the order of mobility (M=5.03, SD=0.90), content attributes (M=4.40, SD=1.02), media utilization (M=4.28, SD=0.92), sociality (M=4.08, SD=1.07) and habituation (M=3.94, SD=0.96).
Content attributes mean the environment to consume and store various contents, media utilization means the environment to conveniently use smart devices that are accessible anytime. As for dissatisfaction factors, dissatisfaction with content use (M=4.45, SD=0.75) and dissatisfaction with customer service (M=4.23, SD=0.81) were revealed. Dissatisfaction with content use was mainly expressed with dissatisfaction with data and battery consumption, and non-smooth streaming service, rather than content type, when content is used. The studies on adoption factors and user satisfaction with the multi-screen environment present the direction of future service and product development by analyzing customer value, which is regarded as the most important, in order to activate the multi-screen service.
4.2 Multi-screen user interface
Studies on the user interface of the multi-screen environment were on user interface consistency between devices at early stage, but they gradually evolved into studies on practical user interface rules required when specific situations and tasks are conducted.
The studies on user interface consistency were diversely carried out domestically and internationally, and representative studies are as follows: Wäljas et al. (2010) observed multi-screen usage behaviors, which use simultaneously or sequentially various platforms, and defined three factors affecting cross platform service the most. This consists of composition, connectivity and consistency, based on which, they proposed user experience framework suitable for mobile and general platforms. Similarly, Seok and Pan (2011) selected 11 items required for YouTube watching in the multi-screen environment, and defined the items by classifying them into those to be applied identically to maintain consistency and those to be applied autonomously. In addition, the studies on user interface considering specific situations and tasks are more actively conducted recently. Ghiani et al. (2013) proposed proper context-aware migration considering private and public situations under the sequential use environment that should continuously use various devices to perform one task. The context-aware migration is classified into three modes, namely automated, assisted and manual modes, and Ghiani et al. asserted using proper context-aware migration according to specific situation, and presented the technical requirements. At early stage of the multi-screen environment, the studies on user interface consistency were mainstream, as various devices and platforms emerged; however, studies on specified interface addressing specific tasks and contexts are more actively carried out, as consistency was embodied more and more.
Multi-screen studies have been performed, centered on usage behaviors and user interface. However, this study examines the
correlations of devices, functions, core purchase factors and brands comprehensively by dealing with purchase and usage behaviors
more comprehensively. This study also identifies the differences of multi-screen purchase and usage behaviors between USA and
China by comparing the users of both countries through semantic network analysis.
5. Cross-cultural Study on Purchase and Usage Behaviors between USA and China 5.1 Method and process
User interview was conducted targeting 32 people in an in-depth interview mode. The subjects were divided into four groups (1 and 2 groups for USA and 1 and 2 groups for China), and the number of people per group was eight, respectively. Interviews were made in New York, USA and Shanghai, China from March 11 to March 20, 2014 for ten days, respectively. The questions on the condition of interview subject selection were about age and owned devices, and the subjects were selected through thank you and terminate selection process (Kim, 2012). Both the 1 and 2 groups of USA and 1 and 2 groups of China were composed of males and females aged 20~30 having tablets. The subjects of 1 group purchased smartphones anew within one year (March 2013~February 2014), and the subjects of 2 group recently purchased TVs (LCD/LED TVs) within a year, respectively. All these are actual purchasers and decision makers, and they have attributes as main users.
The in-depth interviews were made with questions composed of three topics in an open type.
1) Purchasing behavior of individual device (motive, frequency, key buying factor) 2) Use mode (function, use amount, use change)
3) Linkage image (meaning, symbol)
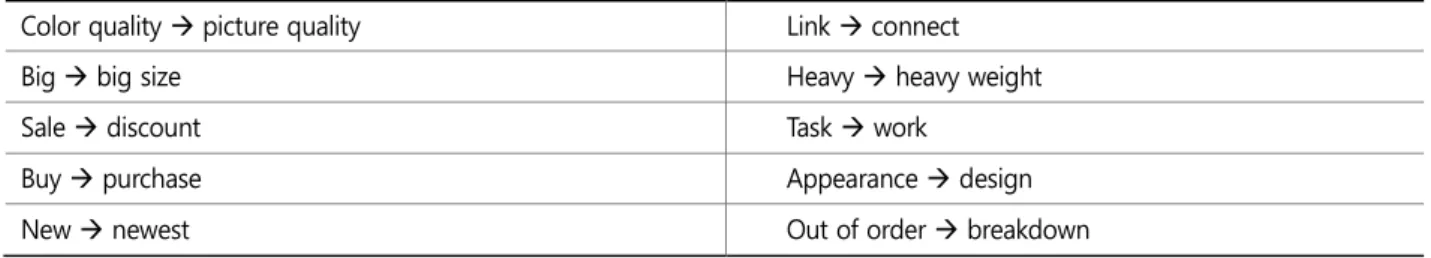
The respondents freely talked about not only their own individual device use modes, but personal use experiences of devices and services in the multi-screen environment. The interview results were translated into Korean by prior coordination of two translators and participating researchers. Cleansing work unifying similar words was carried out for the Korean script as shown in Table 1.
For semantic network analysis, this study selected the words representing China 1 and 2 groups, and USA 1 and 2 groups. As for word selection, this study built data, based on frequency, and then selected 40 final words related with device, function, key buying factor and brand by reflecting the opinions of research participants and onsite workers, except function words among the most frequently used 50 words. Centered on the script and selected words, the words appearing simultaneously from one sentence (co-occurrence) through the KrKwic program were counted. This study analyzed the network matrix drawn through the word count using a network analysis program, NetMiner 4.0.
5.2 Results
5.2.1 Frequently used words
Table 2 shows the most frequently used words of each country, and the number in the bracket means the number of appearance
Table 1. Words cleansingColor quality à picture quality Link à connect
Big à big size Heavy à heavy weight
Sale à discount Task à work
Buy à purchase Appearance à design
New à newest Out of order à breakdown
http://jesk.or.kr
of the word. The appearing words are classified into four categories according to attributes: device, function, key buying factor and brand. Specifically, the device was expressed as the words of smartphone, tablet, TV, notebook, desktop PC, iPhone, iPad.
The function was expressed as the words of the internet, connection, movie, video, game, app, photo, music, sport and news. The key buying factor was expressed as function, price, design, size, screen, newest, technology, performance, system, upgrade and mobile. The brand was expressed as Apple, Samsung, Sony and Sharp. Overall, the frequency on device was the highest in both China and USA, followed by key buying factor. China showed that the ratio of remarks on brand was much higher than USA.
5.2.2 Density
Network density is an indicator showing how much interest in a theme the respondents have (Henderson et al., 1998), namely, it is an indicator calculating how much connection is made between nodes within the network. This study did not consider the front and rear directivity between words, and therefore this study calculated density value of network using the density calculation equation of network without a direction as follows:
= #
k − combination = #
( − 1)/2 ( = 2)
USA 1 and 2 groups, and China 1 and 2 groups showed 0.278, 0,211, and 0.386, 0.265, respectively. China showed higher density values than USA, and this meant that content on and interest in the multi-screen environment were higher in China. Regardless of country, group 1's density was higher than group 2. This implies that the interest of people who bought the newest smartphones in the multi-screen environment was higher than those who bought the newest TVs.
5.2.3 Degree Centrality
Degree centrality means the degree of one word reminding one of other words (Lee et al., 2010), and degree centrality is calculated
Table 2. Frequently used wordsGroup Device Function Key buying factor Brand
USA 1 group Tablet (56), smartphone (45), TV (29), notebook (17), iPhone (14), iPad (12)
Internet (14),
connect (12), app (12), music (10)
Size (19), upgrade (18), screen (15), mobile (15), newest (15), function (13), technology (10)
Apple (10)
USA 2 group TV (90), notebook (19), tablet (16), iPad (13), smartphone (8), desktop PC (8)
Connect (12), movie (10), photo (9), sport (8), internet (8), news (8)
Price (25), size (13),
function (11), technology (11), discount (9), design (9)
China
1 group iPad (68), smartphone (49), TV (3), tablet (19),
notebook (17), iPhone (17), desktop PC (14), iPad (11)
Video (15), internet (8),
movie (8) Exchange (27), design (25),
system (16), performance (8) Apple (23), samsung (14)
China
2 group TV (91), smartphone (28),
iPad (18), notebook (13) Internet (16), movie (14), photo (13), connect (11), game (11)
Function (22), price (19), brand (17), design (16), size (13)
Sony (28), sharp (12),
samsung (10)
by the following equation:
Degree centrality = ( )
g − 1 , = , ( ) =
The more directly connected neighboring nodes are, the higher degree centrality becomes. The word with higher degree centrality plays the role of a keyword having higher impact on the theme. The ten words with the highest degree centrality are as follows:
USA 1 group: smartphone (0.684), tablet (0.684), purchase (0.605), TV (0.579), notebook (0.526), function (0.447), size (0.447), email (0.395), movie (0.395) and Internet (0.395). USA 2 group: TV (0.921), iPad (0.447), notebook (0.421), purchase (0.421), function (0.342), price (0.342), connection (0.315), family (0.289), cable (0.289), match (0.289), home (0.289) and movie (0.289). China 1 group:
purchase (0.923), smartphone (0.795), iPad (0.744), system (0.718), Apple (0.590), tablet (0.538), exchange (0.538), Android (0.487), screen (0.462) and design (0.462). China 2 group: TV (0.897), purchase (0.538), Sony (0.513), 3D (0.436), function (0.436), price (0.410), design (0.385), Internet (0.385), brand (0.385) and iPad (0.359).
Overall, the degree centrality of media consumption like TV, movie and video watching was high in China; however, there were more diverse functions with degree centrality such as email, instant message, app and photo in the USA. When it comes to key buying factor, USA puts importance on function, and group 1 regards newest and technology more important, and group 2 puts more importance on price and discount. Regarding brand, the importance of brand was relatively lower in the USA, but the importance of Apple, Samsung and Sony brands was quite high in China.
5.2.4 Closeness centrality
Closeness centrality is an indicator showing how much one word is close to other words, and is calculated using the following equation:
Closeness centrality = − 1
[ d(ni, nj)] = ,
( , ) =
The higher closeness centrality is, the higher impact on neighboring words is, and this means that the impact on neighboring words is higher, when a word with higher closeness centrality is stimulated, compared to a keyword with lower closeness centrality (Grebitus and Bruhn, 2008). Each country's closeness centrality is very similar to the degree centrality. The ten words with the highest closeness centrality are as follows: USA 1 group: tablet (0.765), smartphone (0.75), purchase (0.72), TV (0.709), notebook (0.684), function (0.65), size (0.639), email (0.619), movie (0.619) and Internet (0.619). USA 2 group: TV (0.929), iPad (0.639), notebook (0.629), purchase (0.629), function (0.591), family (0.582), cable (0.582), match (0.582), home (0.582) and movie (0.582). China 1 group: purchase (0.929), smartphone (0.830), iPad (0.796), system (0.78), Apple (0.709), tablet (0.684), exchange (0.684), Android (0.65), screen (0.65) and design (0.65). China 2 group: TV (0.886), purchase (0.672), Sony (0.672), 3D (0.639), function (0.629), design (0.619), brand (0.619), Internet (0.6), iPad (0.6) and price (0.6).
5.2.5 Node betweenness centrality
Betweenness centrality is shown higher, as more nodes are included in the shortest path between other nodes, and is calculated
using the following equation:
http://jesk.or.kr
Betweenness centrality =
g ni gjk ( − 1)( − 2)
2
= ℎ ℎ ,
( ) = ℎ ℎ ℎ ,
g =
ℎ ℎ ℎ
( )( )
= Total number of all node pairs not including n
A node with high betweenness centrality has control on information flow, and the connection and the flow of total network are hugely impacted, when the node is removed. Table 3 shows the ten words with the highest betweenness centrality. Concerning the analysis from the device aspect, the devices having higher betweenness centrality are tablet and iPad, irrelevant of countries.
Regarding differences between USA and China, the betweenness centrality of notebook was high in the USA, however, notebook did not belong to the word with high betweenness centrality in China. This can be interpreted that consumers in the USA rate the role of notebook relatively higher in the multi-screen environment than in China. As for differences between groups, the betweenness centrality of smartphones was higher in the 1 group, the betweenness centrality of TVs was higher in the 2 group.
This can be conjected that the utilization of each device was relatively higher, after the newest devices were purchased.
The function with higher betweenness centrality was movie watching in the USA. Concerning the differences between the countries, USA had much more diverse functions with high betweenness centrality than China. This can be estimated that the frequency of using the same function sequentially in other devices was higher, or the frequency of using other functions simultaneously like multi-tasking was higher in the USA. Brands with higher betweenness centrality were Apple, or iPad and iPhone, the Apple's products, and it gained attention that Sony appeared in China 2 group. If key buying factors are regarded as function, design and price, the key buying factors with high betweenness centrality were function (1 and 2 groups) and price (2 group) in the USA, and function and design (1 and 2 groups) and price (2 group) in China. The 2 group was more sensitive to price, irrelevant of countries.
Table 3. Node betweenness centrality by group
USA 1 group USA 2 group China 1 group China 2 group
1 Tablet TV Purchase TV
2 Smartphone Notebook iPad Purchase
3 TV Purchase Smartphone Sony
4 Purchase iPad System Price
5 Size Price Apple 3D
6 Notebook Function Exchange Brand
7 Home Connect Tablet Function
8 Movie Game Android Design
9 Function Match Screen Internet
10 Instant message Cable Home Technology
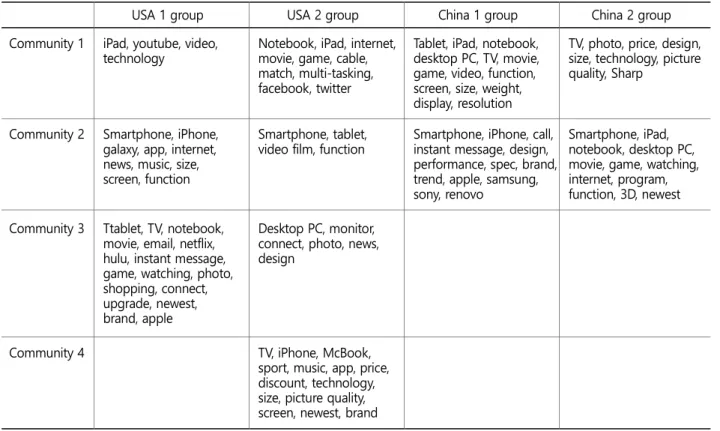
5.2.6 Community modularity
One network consists of several subnetworks, and they express the categorization of similar concepts within human's cognitive structure (Lee and Lee, 2012). This study conducted an aggregation structure analysis that carries out grouping the closely
Table 4. Core community modularity by group
USA 1 group USA 2 group China 1 group China 2 group
Community 1 iPad, youtube, video, technology
Notebook, iPad, internet, movie, game, cable, match, multi-tasking, facebook, twitter
Tablet, iPad, notebook, desktop PC, TV, movie, game, video, function, screen, size, weight, display, resolution
TV, photo, price, design, size, technology, picture quality, Sharp
Community 2 Smartphone, iPhone, galaxy, app, internet, news, music, size, screen, function
Smartphone, tablet, video film, function
Smartphone, iPhone, call, instant message, design, performance, spec, brand, trend, apple, samsung, sony, renovo
Smartphone, iPad, notebook, desktop PC, movie, game, watching, internet, program, function, 3D, newest Community 3 Ttablet, TV, notebook,
movie, email, netflix, hulu, instant message, game, watching, photo, shopping, connect, upgrade, newest, brand, apple
Desktop PC, monitor, connect, photo, news, design
Community 4 TV, iPhone, McBook,
sport, music, app, price, discount, technology, size, picture quality, screen, newest, brand
USA 1 group USA 2 group
http://jesk.or.kr
connected nodes and identifying network structure. Actually, the hard clustering community analysis, in which one node is classified to belong to only one cluster, was used. Subnetwork was categorized, centered on modularity between device, function and key buying factor. Table 4 shows the meaningful community composition of each group, and subnetworks were classified as shown in Figure 3.
6. Conclusion 6.1 Discussion
This study proved the utilization possibility of semantic network analysis in design research by analyzing user interview texts using the semantic network analysis. After conducting in-depth interviews on multi-screen purchase and usage behaviors targeting four groups, namely the user group (1 group) that bought the newest smartphones and the user group (2 group) that purchased the newest TVs in the USA and China, respectively, this study comparatively analyzed the interview details through the semantic network analysis method. As a result, the analysis results are classified into 1) characteristics showing the same result, irrelevant of country and group, 2) characteristics showing differences between countries, 3) characteristics showing differences between groups.
Among these, the clearest characteristics are the differences between countries, which can be estimated that such differences are derived from each country's multi-screen evolvement stage and the status of diversity of multi-screen service.
The characteristics that were revealed the same, irrelevant of country and group, were tablet (device) and movie watching (function) playing a role of centrality and cross point, respectively. Degree centrality, closeness centrality and betweenness centrality were all high in tablet and movie watching. This means that tablet and movie watching are a device and a function, respectively, with high potential for either simultaneous or sequential usage in the multi-screen environment.
Differences between countries were revealed in all four perspectives, namely device, function, key buying factor and brand. Because the diffusion of multi-screen service, centered on communications carriers and broadcasting companies, was conducted much
China 1 group China 2 group
faster in the USA than China, the service was more evolved, and there were much more diverse relevant service types in the USA. Differences between countries are conjectured to be derived from such a condition, and there were much more diverse functions related to multi-screen in the USA than China. Although functions with high degree centrality and closeness centrality were very limited to media consumption (TV, movie and video watching) in China, there were very diverse functions such as game, VOD (Netflix, Hulu), shopping and SNS. The reason is that various services were developed in addition to contents, and this means that various activities were more frequently carried out through the multi-screen environment. Also, more diverse functions with high betweenness centrality were revealed. This means that sequential use of the same functions in other devices, or simultaneous use of other functions like multi-tasking are more common. Looking at the device aspect in such a context, the role of notebook was more important in the USA than China. The degree centrality, closeness centrality and betweenness centrality of notebook were very high in the USA, which can be estimated that the utilization of notebook with bigger screen size and more convenient input increased together, as there were diverse functions used in the multi-screen environment. It can be conjectured that such a phenomenon was affected by the notebook-friendly culture of USA and popularity of Apple Mac.
Concerning the characteristics of subnetwork, devices form a community through various combinations with other devices in the USA, which means that the characteristics of devices within the community become analogous. As different devices carry out analogous functions, it can be interpreted that unique roles of existing devices gradually disappear. In China, however, the formation of sub- network community was uniform, which means individual devices still play a traditional role, and the function and role of a device in the multi-screen environment are more clearly classified, compared to USA.
Regarding the key buying factor aspect, the importance of function is very high, in the USA, compared to China; however, design and brand together with function are important considerations in China. This is interpreted that USA actually conducts more diverse functions than China in the multi-screen environment. As for brand, only Apple is mentioned in the USA, while Sony and Samsung in addition to Apple are perceived as important brands in the multi-screen environment in China.
Lastly, looking at the differences between the 1 group (group purchasing the newest smartphones) and 2 group (group purchasing the newest TVs), differences are revealed from the interest in multi-screen, mainly used device and key buying factor aspects.
Interest in multi-screen can be identified through density: the density value of the 1 group is higher than that of the 2 group, and this means that those who bought the newest smartphones have higher interest in the multi-screen environment than those who bought the newest TVs. This is conjectured that smartphones play a more important role than TVs. When it comes to mainly used device, it was smartphone in the 1 group, and TV in the 2 group, which is judged that the newest device that one bought is more frequently used. Concerning key buying factor, the 1 group thinks newest, technology and design factors more important, while the 2 group thinks price as important. This is judged to be derived from the impact of recently purchased device. In conclusion, the differences between the 1 and 2 groups can be derived from recently purchased devices, rather than the differences of multi-screen related essential usage behaviors. As for purchase and usage behaviors in the multi-screen environment, macro differences of overall environment (differences between countries) according to multi-screen's evolvement stage are judged to function much more enormously than micro differences according to user characteristics (differences between groups).
6.2 Academic and managerial implications
The significance in this study is that this study proposed semantic network analysis for the first time as a method of design
research, and proved its possibility by applying the method to practical work. Because user's interest and needs are directly
expressed through a medium of language in an interview, it is easy to understand the interview details; however, there is a limitation
in identifying unconscious inner side state. To complement such a limitation, various observation techniques are used, and all
these are the methods to accurately understand human's inner essential interest and desires in more-in-depth manner. From this
aspect, the semantic network analysis identifying speaker's inner cognitive structure through language is regarded as having quite
http://jesk.or.kr
a potential as a means of design research. The semantic network analysis shows how the concepts associated with speaker's speech details are structuralized in what manner within speaker's perception through visual and quantitative data. Therefore, semantic network analysis can be very effectively used to understand and verify the insights drawn qualitatively through user interview.
This study verified the possibility of semantic network analysis by applying it to practical work. As a result of analyzing semantic network analysis with basic interview script on multi-screen purchase and usage behaviors, more comprehensive analysis results on mutual correlations of device, function, key buying factor and brand were drawn, and differences between countries, namely USA and China, were shown visibly. Although, the semantic network analysis has hardly been used in design research so far, utilization of it is conjectured to be needed as an analysis means complementing generally carried out qualitative analysis. If the semantic network analysis method is actively used for a variety of data, and interpretation becomes more sophisticated, the discovery of countless design insights is forecast possible.
6.3 Limitation and suggestion for future study
This study has significance in that semantic network analysis was applied to user interview for the first time. However, there are some limitations according to the first attempt. Because this study conducted interviews targeting 32 people, and the interview details were analyzed, there was a limitation in representation and size of the parent group. Although, meaning was huge in that this study compared two cultures, there was a limitation to compare two cultures with the same language. Despite translation of two different languages into Korean through consultation, there was a difficulty that the same word was not fully assured to be used as the same concept. This is an unavoidable limitation in comparing two cultures through semantic analysis.
Semantic network analysis can be a useful design research means to understand the more and more complex design environment and to draw meanings. Although drawing insights through qualitative or quantitative analysis in the case of independent single subject is relatively plain and easy work, it is very difficult and fussy work to understand the whole system through one- dimensional analysis in the complex environment like multi-screen environment. In the current design environment, service and manufacturing industries are gradually fused like multi-screen, smart home and the Internet of things (IoT), and design subjects are become more complex to the extent of unimaginable level in the past. A designer should be able to handle and interpret more information, and have perspective to prospect the whole simultaneously in the future. Therefore, not only obtaining intuitive and creative insights on users through qualitative analysis, but identifying the whole through quantitative analysis such as semantic network analysis, and verifying overall direction of outcomes through qualitative analysis will be very important process in design research.
References
Brdiczka, O., Integral framework for acquiring and evolving situations in smart environments, Journal of Ambient Intell Smart Environ , 2(2), 91-108, 2008.
Chang, S.G., A structured scenario approach to multi-screen ecosystem forecasting in Korean communications market, Technological Forecasting & Social Change , 94, 1-20, 2014.
Cho, Sungsoo, A Study on the Relationship between N-Screen Service Users' Connected-Use/Simultaneous Use and Perceived Usability & Perceived Ease of Use Based on Multi Device Converged Use, Animation Studies , 9(3), 55-73, 2013.
Choi, Sekyung, Kwak, Gyutae and Lee, Wontae, A Study of Influences on Active Use of N-Screen Service: Use Motives, Perceived
Usefulness and Affinity, The Korean Society for Journalism & Communication Studies , 58(4), 371-401, 2014.
Chung, Dukho, Lee, Junki, Kim, Seoneun and Park, Kyeongjin, An Analysis on Congruency between Educational Objectives of Curriculum and Learning Objectives of Textbooks using Semantic Network Analysis: Focus on Earth Science I in the 2009 revised Curriculum, Jour. Korean Earth Science Society , 34(7), 711-726, 2013.
Cowley, E. and Mitchell, A.A., The moderating effect of product knowledge on the learning and organization of product information, Journal of Consumer Research , 30, 443-454, 2003.
Danowski, J.A., A network-based content analysis methodology for computer-mediated communication: An illustration with a computer bulletin board. In M. Burgoon (Ed.), Communication yearbook 6 (pp. 904–925), New Brunswick, NJ: Transaction, 1982.
Davis, F.D., A technology acceptance model for empirically testing new end-user information systems: theory and results, MIT, retrieved from http://hdl.handle.net/1721.1/15192, 1985.
Dees, W., Usability of nomadic user interfaces. In Proceedings HCII 2011 , 195-204, 2011.
Doerfel, M.L., What constitutes semantic network analysis? A comparison of research and methodologies, Connections , 21, 16-26, 1998.
Farrell, R. and Hooker, C., Design, science and wicked problems, Design Studies , 34, 681-705, 2013.
Friess, E., The Sword of Data: Does Human-Centered Design Fulfill Its Rhetorical Responsibility?, Design Issues , 26(3), 40-50, 2010.
Ghiani, G., Polet, J., Antila, V. and Mäntyjärvi, J., Evaluating context-aware user interface migration in multi-device environments, Journal of Ambient Intelligence and Humanized Computing , 6(2), 259-277, 2013.
Girvan, M. and Newman, M.E.J., Community Structure in Social and Biological Networks, Proceedings of the National Academy of Sciences , 99(12), 7821-7826, 2002.
Grebitus, C. and Bruhn, M., Analyzing semantic networks of pork quality by means of concept mapping, Food Quality and Preference , 19, 86-96, 2008.
Henderson, G.R., Iacobucci, D. and Calder, B.J., Brand diagnostics: Mapping branding effects using consumer associative networks, European Journal of Operational Research , 111(2), 306-327, 1998.
Howard, T.J., Culley, S.J. and Dekoninck, E., Describing the creative design process by the integration of engineering design and cognitive psychology literature, Design Studies , 29, 160-180, 2008.
Iacobucci, D., Henderson, G., Marcati, A. and Chang, J., Network analysis of brand switching behavior, International Journal of Research in Marketing , 13, 415-429, 1996.
Jameson, D.A., Implication versus inference: Analyzing writer and reader representations in business texts, Business Communication
Quarterly , 67(4), 387-411, 2004.
http://jesk.or.kr
Jonassen, D.H., Beissner, K. and Yacci, M., Structural knowledge , New Jersey: Hillsdale, 1993.
Kim, Insook, A study on attributes of user experience in the multi-screen environment, Korea Society of Basic Design & Art , 14(2), 77-87, 2013.
Kim, Sungbum, Exploring Consumer Preferences for Mobile Internet and Forecasting the Evolution of Mobile Internet Service, The Journal of Internet Electronic Commerce Research , 12(4), 23-50, 2012.
Lee, Dongil and Lee, Haejoon, Understanding the Semantic Network Structure in the Consumer Group Interview with the Subnetwork Analysis, Journal of Consumer Studies , 23(2), 249-272, 2012.
Lee, Gwanghoon, Analysis of N-screen Service Users Using Diary Data, Korea Information Society Development Institute , 21(3), 1-21, 2014.
Lee, Hyejoon, Lee, Dongil and Lee, Juhyun, Development of franchise employee education programs through semantic network analysis, Korean Business Review , 14(2), 105-128, 2010.
Lee, Sihoon and Ahn, Jua, Is possible the activation of psychophysiological measures in advertising research?: Advertising scholar's cognition about psychophysiological measures, Social Science Research Review , 25(4), 25-50, 2009.
Lee, Susang, A Content Analysis of Journal Articles Using the Language Network Analysis Methods, Journal of the Korean Society for information Management , 31(4), 49-68, 2014.
Lehmann, F., Semantic networks, International Journal of Computers and Mathematics with Applications , 23(2-5), 1-50, 1992.
Lim, Sohye and Lee, Youngjoo, N Screen Service Users' Motivations for Use and Dissatisfying Factors, The Korea Contents Association , 13(3), 99-108, 2013.
Liu, T.L., Every Sheet Matters: Design Research based on a Quantitative User-diary of Paper Towels, Design Principles and Practices , 4, 231-239, 2010.
Newman, M.E.J., Detecting community structure in networks, The European Physical Journal , 38(2), 321-330, 2004.
Newman, M.E.J. and Girvan, M., Finding and Evaluating Community Structure in Networks, Physical Review E., 69(2), 69-83, 2004.
Oh, Kyungsoo, Determinants of Intention to Use toward N Screen Service for Potential User, The Korea Contents Association , 12(9), 80-92, 2012.
Olson, J.C., Internal belief formation in the cue utilization process, Advances in Consumer Research , 5, 706-713, 1978.
Park, Chisung and Chung Jiwon, Text network analysis: focusing on the shared meanings among the policy stakeholders through socio-cognitive network analysis, Journal of Governmental Studies , 19(2), 73-108, 2013.
Plowman, T., Ethnography and critical design practice. In Design Research, Methods and Perspectives , 30-38, Brenda Laurel,
Cambridge: MIT Press, 2003.
Popping, R., Knowledge graphs and network text analysis, Social Science Information , 42(1), 91-106, 2003.
Rice, R.E. and Danowski, J.A., Is it really just like a fancy answering machine? Comparing semantic networks of different types of voice mail users, Journal of Business Communication , 30, 369-397, 1993.
Ryan, G.W. and Bernard, H.R., Data Management and Analysis Methods. In N. Denzin and Y. Lincoln, eds., Handbook of Qualitative Research , 769-802, 2nd ed. Thousand Oaks, CA: Sage Publications, 2000.
Sanders, E.B.N., Design research in 2006, Design Research Quarterly , 1(1), 1-8, 2006.
Seok, Wangmi and Pan, Younghwan, Design considerations for maintaining coherence of user experience in a multi-screen environment: focused upon YouTube contents, Korea Society of Basic Design & Art , 12(4), 213-223, 2011.
Seok, Wangmi and Pan, Younghwan, Evaluation framework for multi-screen contents UX, Journal of the HCI Society of Korea , 841-842, 2011.
Steen, M., Tensions in human-centered design, CoDesign , 7(1), 45-60, 2011.
Stewart, J. and Williams, R., The wrong trousers? Beyond the design fallacy: social learning and the user. In H. Rohracher, ed., User involvement in innovation processes: strategies and limitations from a socio-technical perspective , 39-71, Munchen/Wien:
Profil Verlag, 2005.
Tomlinson, B., Yau, M.L., Baumer, E., Ross, J., Correa, A. and Tomlinson, G.J., Richly Connected Systems and Multi-Device Worlds, MIT Presence , 18(1), 54-71, 2009.
Van Kleef, E., Van Trijp, H.C.M. and Luning, P., Consumer research in the early stages of new product development: a critical review of methods and techniques, Food Quality and Preference , 16(3), 181-201, 2005.
Wäljas, M., Segerståhl. K., Väänänen-Vainio-Mattila, K. and Oinas-Kukkonen, H., Cross-Platform Service User Experience: A Field Study and an Initial Framework, Mobile HCI , September 7-10, 2010.
Wodehouse, A.J. and Ion, W.J., Information Use in Conceptual Design: Existing Taxonomies and New Approaches, International Journal of Design , 4(3), 53-66, 2010.
Woelfel, J. and Fink, E.L., The measurement of communication processes: Galileo theory and method , New York: Academic Press, 1980.
Zhang, W., Zhang, Q., Yu, B. and Zhao, L., Knowledge map of creativity research based on keywords network and co-word analysis, 1992-2011, Quality & Quantity , 49(3), 1023-1038, 2014.
Zhang, Y., Mao, M., Rau, P.P., Choe, P., Bela, L. and Wang, F., Exploring factors influencing multitasking interaction with multiple
smart devices, Computers in Human Behavior , 29, 2579-2588, 2013.
http://jesk.or.kr
Author listings
Jaehee Chung: [email protected] Highest degree: Ph.D
Position title: Instructor, Culture & Design Management, Yonsei University Areas of interest: Design Research, Design Management, User Experience
Ken Nah: [email protected] Highest degree: Ph.D
Position title: Professor, Design Management, IDAS Hongik University Areas of interest: Human Factors, Ergonomics
Sungbum Kim: [email protected] Highest degree: Ph.D
Position title: Assistant Professor, IT Convergence, Kumoh National Institute of Technology Areas of interest: Technology Management