1. Introduction
Asphalt and concrete pavements are commonly used in road and highway construction with their high strength material properties. However, in places where high strength is not necessary, such as roads for light vehicles, walking paths, parking lots and the roads to cultural assets, soil-cement pavement may be used. Soil-cement pavement is a mixture of soil, cement, and water, and its primary advantages are economy and environment (Kim et al., 2002;
PCA, 1978). Because a pavement of soil-cement is not very attractive, artificial pigment is often added to make it appear more natural (Ju et al., 2003). Red mud is an industrial by-product material formed during production of alumina when the bauxite ore is subjected to caustic leaching. About 100,000 tons of red mud are produced per year from an aluminium factory in South Korea and its
disposal is a major problem for this industry (Jeong, 2004;
Kim, 2003). Therefore soil-cement pavement mixed with recycled red mud could be a beneficial use of this waste material. In this study, the unconfined compressive strength of soil-cement with red mud was investigated with the various ratios of red mud, cement, fly ash, and the ratio of soil replaced with sand.
2. Materials
2.1 Soil
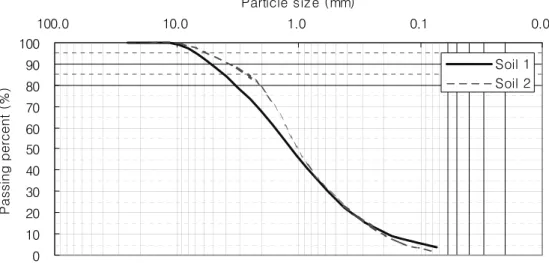
Two samples of weathered granite residual soils gathered from Andong-si, Kyungsangbuk-do, S. Korea were used to develop specimens of soil-cement with red mud. The results of sieve analysis tests on samples are shown in Fig.
1. Scanning electron microscope(SEM) photographs of the
Unconfined Compressive Strength of
Soil-Cement Pavement with Recycled Red Mud
레드머드가 첨가된 흙 시멘트 포장의 일축압축강도-
Lee, Yunkyu † ・ Baek, Seungcheol 1) ・ R. D. Holtz 2) ・ Jeong, Dongyoung 3) 이 윤 규 ・ 백 승 철 ・ R. D. Holtz ・ 정 동 영
ABSTRACT : The unconfined compressive strength of soil-cement mixed with red mud, an industrial by-product of alumina production, was investigated in the laboratory. The investigation involved laboratory tests under the various conditions such as red mud content, cement content, fly ash content and ratio of soil replacement with sands. The unconfined compressive strength tests were performed at 7, 14 and 21 days after specimen preparation. Results of the study show that the unconfined compressive strength increased as red mud and fly ash content decreased and cement content increased. Increasing the soil replacement ratio with sands had an insignificant effect on compressive strength because the soil had a similar particle size as the replacement sands.
Keywords : Unconfined compressive strength, Soil-cement, Red mud, Fly ash
요 지 : 알루미늄 제조 시 발생하는 산업부산물인 Red mud 가 첨가된 흙 시멘트 포장 재료를 개발하기 위하여 일축압축강도시험을 -
수행하였으며 Red mud 함유율 시멘트 함유율 , , Fly ash 대체 비율 및 모래의 대체 비율이 일축압축강도에 미치는 영향을 검토하기 위하여 양생기간 일 7 , 14 일 및 21 일에 대한 공시체를 제작하였다 시험결과 . , Red mud 와 Fly ash 함유량이 감소할수록 시멘트 함유량
이 증가할수록 일축압축강도는 증가하였고 화강풍화잔류토를 사용할 경우 모래의 대체 비율에 따른 일축압축강도에 미치는 영향은 ,
없는 것으로 나타났다.
주요어 : 일축압축강도 흙 시멘트 적니 , - , ( 赤泥 ), 플라이 애쉬
† 정회원 건동대학교 건설공학부 조교수, (E-mail : [email protected])
한국지반환경공학회 논문집
제 권 제 호 9 7 2008 년 12 월 pp. 37~43
soils are shown Fig. 2 and 3.
The classification properties of the two soils are shown in Table 1. According to the unified soil classification system, both soils are classified as SM, and two soils are quite similar index and compaction properties.
2.2 Red mud
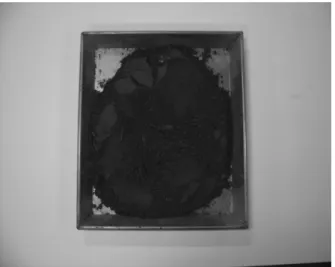
In this study, samples of red mud were gathered from the factory in S. Korea and the type of red mud used is locally known as SP(scarlet powder). The red mud is shown in Fig. 4 (a) and SEM photograph of red mud is shown in Fig. 4 (b). The chemical composition and physical properties of red mud are shown in Table 2.
3. Laboratory test procedures
3.1 Mixture condition
In this study, various percentages of red mud and the replacement ratio of sands, fly ash, and cement content were used to make soil-cement mixtures with red mud.
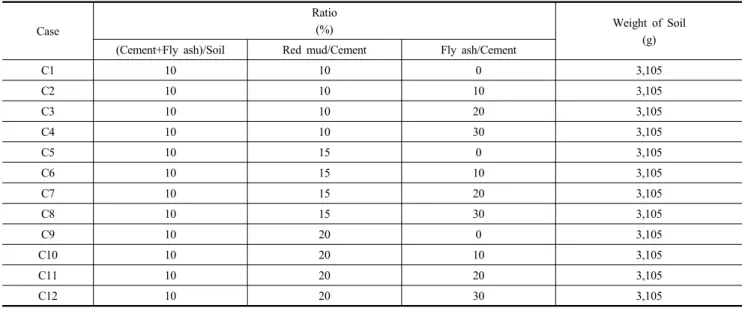
Compressive strength tests were performed on specimens having 7, 14 and 28 days curing time, respectively. Table 3 shows the mixture conditions for laboratory tests with different cement and red mud ratios. The objective was to see the effect on strength of cement and red mud content.
The mixture conditions for soil replacement with sands and cement replacement with fly ash are shown in Tables 4 and 5.
0 10 20 30 40 50 60 70 80 90 100
0.0 0.1
1.0 10.0
100.0
Particle size (mm)
Passing percent (%)
Soil 1 Soil 2
Fig. 1. Particle size distribution curve of soils
Fig. 2. SEM photograph of Soil 1 (×100) Fig. 3. SEM photograph of Soil 2 (×100)
Table 1. Properties of soils
Soil USCS Specific
gravity
LL (%)
PI (%)
#200 Passing
(%) Cu Cc γdmax
(t/m3)
OMC (%)
1 SM 2.54 20.5 2.1 3.5 7.9 1.2 1.972 9.5
2 SM 2.65 21.0 5.4 1.3 6.1 1.2 1.880 12.0
(a) Red mud (b) SEM photograph of red mud (×20,000) Fig. 4. Red mud and SEM photograph of red mud
Table 2. Chemical composition and physical properties of red mud
Type of red mud
(a) Chemical composition (%)
Fe2O3 Al2O3 SiO2 TiO2 CaO Na2O Other
SP(Scarlet Powder) 40 45~ 15 20~ 5 7~ 6 8~ 7 10~ 4 7~ 3 23~
Type of red mud
(b) Physical properties Water content
(%) pH Average particle size
SP(Scarlet Powder) 10 15~ 12 6 10~ ㎛
Table 3. Mixture conditions for laboratory tests with cement and red mud ratio
Case
Ratio
(%) Weight of Soil
W/C Cement/Soil Cement/Red mud (g)
A1 191 10 10 3,105
A2 127 15 10 2,970
A3 96 20 10 2,700
A4 191 10 15 3,105
A5 127 15 15 2,970
A6 96 20 15 2,700
A7 191 10 20 3,105
A8 127 15 20 2,970
A9 96 20 20 2,700
Table 4. Mixture conditions for soil replacement with sands
Case
Ratio
(%) Soil : Sand Weight of Soil
W/C Cement/Soil Cement/Red mud (g)
B1 191 10 10 2 : 1 2,070
B2 191 10 10 1 : 1 1,553
B3 127 15 10 2 : 1 1,980
B4 127 15 10 1 : 1 1,485
B5 96 20 10 2 : 1 1,800
B6 96 20 10 1 : 1 1,350
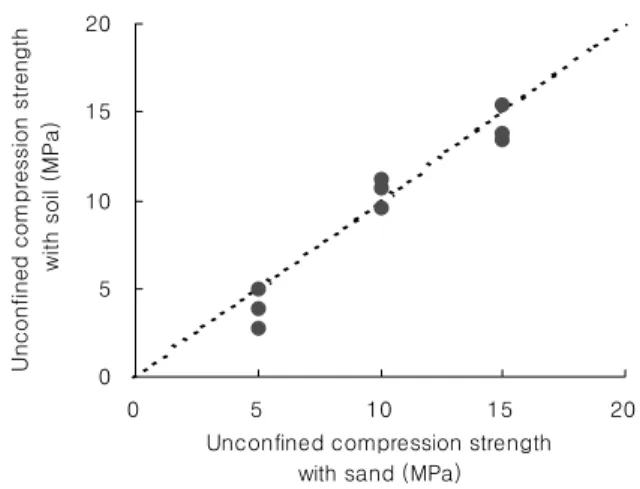
This part of the investigation was made in order to investigate the effect of soil replacement with sands and for cement replacement with fly ash on long term strength.
The ratios of soil replacement with sands were 50 and 100% and the ratios of cement replacement with fly ash were 10, 20 and 30% in the laboratory test.
3.2 Specimens
The specimens were prepared and cured in the same way soil-cement compression and flexure test specimens are prepared in the laboratory (KS F 2329). Three specimens were prepared and tested to get an average value for each mixture condition, and the specimens were cured under submerged condition with water. Diameter of samples for the unconfined compressive strength tests was 5cm and height of samples was 10cm. Compressive strength was performed using an UTM according to KS F 2328.
4. Test results and discussion
4.1 Unconfined compression strength with red mud content
Fig. 5, 6, and 7 show the relationship of unconfined compressive strength and curing time for the specimens having different red mud contents. It was found that the compressive strength increased with increased curing time.
The variation of unconfined compressive strength with red mud content is shown in Fig. 8. Note that the unconfined
compression strength slightly decreased with an increasing content of red mud.
Fig. 8 shows the relationship of unconfined compressive strength for the specimens having 28 days curing time and
0.0 5.0 10.0 15.0 20.0
0 7 14 21 28 35
Curing time (days)
Unconfined compression strength (MPa)
A1 (Red mud 10%) A4 (Red mud 15%) A7 (Red mud 20%)
Fig. 5. The relationship of unconfined compressive strength with curing time (cement 10%)
0.0 5.0 10.0 15.0 20.0
0 7 14 21 28 35
Curing time (days)
Unconfined compression strength (MPa)
A2 (Red mud 10%) A5 (Red mud 15%) A8 (Red mud 20%)
Fig. 6. The relationship of unconfined compressive strength with curing time (cement 15%)
Table 5. Mixture conditions for cement replacement with fly ash
Case
Ratio
(%) Weight of Soil
(Cement+Fly ash)/Soil Red mud/Cement Fly ash/Cement (g)
C1 10 10 0 3,105
C2 10 10 10 3,105
C3 10 10 20 3,105
C4 10 10 30 3,105
C5 10 15 0 3,105
C6 10 15 10 3,105
C7 10 15 20 3,105
C8 10 15 30 3,105
C9 10 20 0 3,105
C10 10 20 10 3,105
C11 10 20 20 3,105
C12 10 20 30 3,105
red mud content. Th slopes of compressive strength are 0.65, 2.38 and 3.16. Therefore, the decrease of compressive strength with increasing red mud content is greater with increasing cement content.
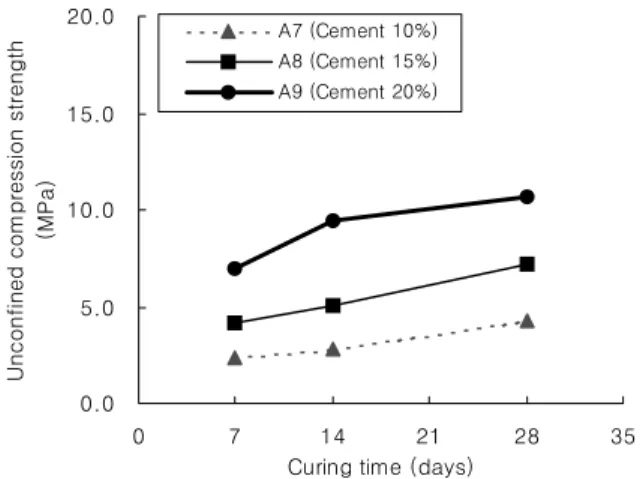
4.2 Unconfined compression strength with cement content
Fig. 9, 10, and 11 show the relationship of unconfined compressive strength and curing time with variation of red mud content. From the results, the compressive strength increases with increasing curing time. The trend of compressive strength increase with increasing cement content ratios are greater than that with red mud content ratos. Fig. 12 shows the variation of unconfined compressive strength with cement content for soil mixtures with red mud. As the content of cement increases, the unconfined compressive strength increases.
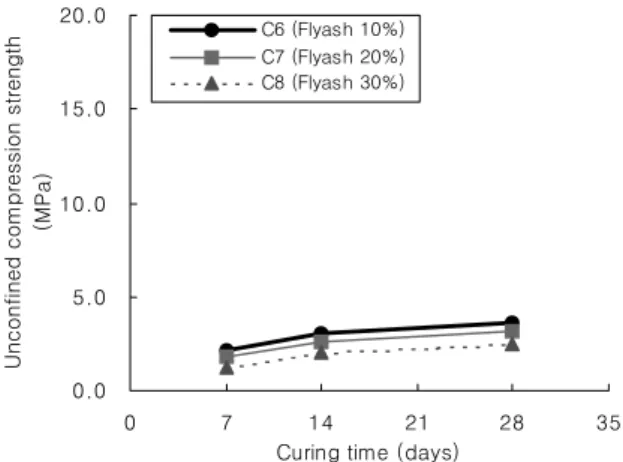
4.3 Unconfined compression strength with fly ash content
Fig. 13, 14, and 15 show the relationship of unconfined compressive strength and curing time with fly ash content.
0.0 5.0 10.0 15.0 20.0
0 7 14 21 28 35
Curing time (days)
Unconfined compression strength (MPa)
A3 (Red mud 10%) A6 (Red mud 15%) A9 (Red mud 20%)
Fig. 7. The relationship of unconfined compressive strength with curing time (cement 20%)
0.0 5.0 10.0 15.0 20.0
5 10 15 20 25
Red mud content (%)