논문 2011-6-40
U-Healthcare시스템을 위한 PPG의 피부표면의 온도변화보상
Compensation of Skin Surface Temperature Variation on the PPG for the U-Healthcare System
염호준*
Hojun Yeom
요 약 본 논문에서는 혈압과 광용적맥파
,
국부피부온도변화에 따른 심혈관 파라메터의 통계적 변화와 관계에 대해 연구하였다.
국부피부온도변화는Finometer
의 혈압,
광용적맥파 그리고 총말초저항에 영향을 주었고 오실로메트릭 혈 압,
심박수,
심박출량에는 영향을 주지 않는 결과를 얻었다.
그러므로 온도변화가 있는 환경에서 에러를 줄이기 위해 심혈관계의 상태를 광용적맥파로 평가하기위해서는 온도를 제어하거나 보상해 주어야 한다.
Abstract This study aims to investigate statistical variations and relationships of blood pressure (BP), phtotplethysmography (PPG) and cardiovascular parameters on changes in local skin surface temperature (SST) during gradual cooling and heating. Results showed that local SST changes affected the Finometer BP, the PPG waveforms and total peripheral resistance, but not oscillometric BP, heart rate, stroke volume and cardiac output.
Therefore, in order to reduce for the errors, temperatures should be controlled or compensated when components of the PPG waveform are used to evaluate cardiovascular status in temperature variation environments.
Key Words : PPG, skin surface temperature, gradual temperature variation, cardiovascular status,U-healthcare
Ⅰ. Introduction
The photoplethysmography (PPG) is an optical technique that can be used to non-invasively observe changes in blood flow in the peripheral blood vessels.
The PPG waveform is classified into the alternating current (AC) component, which can simultaneously observe heart beat and changes in blood flow, and the direct current (DC) component, which reflects ventilation, the activity of the autonomic nerve system, and the temperature control. The plethysmograph of
*종신회원, 을지대학교 의료공학과(교신저자) 접수일자 2011.12.1, 수정완료 2011.12.15 게재확정일자 2011.12.16
peripheral arteries is similar to the central pressure pulses in the aortic root and the ascending aorta
[1]. The significance of changes in the PPG waveform is not fully known, however these changes can provide information about the cardiovascular system.
This study aims to investigate statistical variations
and relationships of blood pressure (BP), PPG
waveform and cardiovascular parameters which are
heart rate (HR), stroke volume (SV), cardiac output
(CO) and total peripheral resistance (TPR) on changes
in local skin surface temperature (SST) during gradual
cooling and heating. To compare diverse changes in the
PPG waveform and cardiovascular parameters related
with the changes in SST from the measurement area,
the air temperature in the chamber was controlled.
After that, physiological changes of the subjects were induced using changes in the SST of the exposed areas. Evaluation was made by direct comparison of temperatures, PPG waveform components, and cardiovascular status induced by temperature control.
[1]-[5]Ⅱ. Methods
The experiment was conducted on 16 subjects (15 male) and all subjects were healthy individuals who were not undergoing any drug treatment and did not have Raynaud`s phenomenon. Before the experiment, all subjects underwent a training program and signed the research participation agreement.
All of the subjects were instructed to avoid smoking, alcohol consumption, and extreme exercise for 12 h and to prohibit caffeine intake for 4 h before the experiment in order to minimize factors such as exercise, nicotine, and caffeine, which can affect blood flow and blood vessel conditions, and to obtain more reliable data in accordance with the changes in SST
[2].
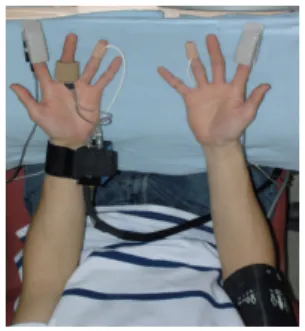
A polypropylene chamber that can heat and cool the skin of the hand and that was isolated from the outside temperature was created. Silicon was used for the front hole at the site of hand insertion. To enable observation of the fingers while performing the experiment, monitoring windows were installed in the front and rear using acrylic. Four cylinders were placed within the chamber, and a fan was installed in each cylinder to enable the smooth supply of air. Small holes on the cylinder were created so that the temperature within the chamber changes consistently as a whole and the fingers are prevented from Ⅱbeing directly heated or cooled. On the sides of the chamber, opening and closing air passages were provided for air circulation within the chamber. (Fig. 1)
The changes in finger SST in accordance with the changes in air temperature within the chamber were obtained at the fourth finger through a contact
temperature sensor (LNTG473FW, Lattron, Korea). To measure continuous SST, a PowerLab (ML880, AD Instrumentation, Australia) with a 12-bit A/D convertor was used at a sampling rate of 200 Hz. An infrared camera (TH5104, NEC, Japan) was used to show the finger SST distribution for both hands at 5-min measured intervals (0, 5, 10, 15, 20, 25 min). The SST distribution was acquired in order to observe that changing SST of five fingers per hand in the identical way.
Clip type probes (DS-100A, Nellcor, Japan) were used to minimize signal changes due to external factors, such as the contact pressure and the distance between the light-emitting diode (LED) and the photodetector, and to measure only the changes of the PPG waveform in accordance with changes in finger SST. An infrared LED with a center wavelength of 890 nm and a photodetector with a center wavelength of 900 nm were used; the signal was measured in the transmission mode.
그림 1. 온도챔버와 실험환경
Fig. 1. Temperature chamber and the experiment environment.
The DC and AC components of each PPG waveform
detected on the index fingers of both hands from the
photodetector were extracted using an analog
non-inverting low-pass filter with a cut-off frequency
of 20 Hz and an inverting high-pass filter with a
cut-off frequency of 0.15 Hz, respectively. A PowerLab
with a 12-bit A/D converter was used to acquire
signals at a sampling rate of 200 Hz per channel and
to digitize data. The current supplied to the LED drive
and the amplification ratio were kept constant.
In order to measure the changes in the PPG waveform in accordance with the local finger SST changes, a chamber enabling air temperature changes, with cooling and heating devices and a device to measure PPG waveform changes was produced. To measure cardiovascular parameters and blood pressure, the Finometer and Oscillometric sphygmomanometer were used.
Temperature changes were induced (cooling: ~13.6 ± 0.6°C, heating: ~48.6 ± 0.4°C) by supplying warm and cool air using the heating and cooling devices; in the chamber, the cooled and heated area of the subject was separated from the outside. During the experiment, the laboratory temperature was maintained at 24.9 ± 0.9°C.
One cooling experiment and one heating experiment were conducted for all subjects, and throughout the experiment, the subjects were seated in a comfortable chair and their hands were placed at heart level on the table, to help keep the finger steady. After body positioning, the left hand was put in the chamber up to the elbow and the right hand was positioned outside the chamber. For the initial 10 min of the cooling experiment and the heating experiment, PPG waveforms, cardiovascular parameters, and blood pressure were obtained in an environment identical to the temperature in the laboratory. Next, the same data were continuously obtained for 20 min while the temperature was changing inside the chamber.
Statistical analysis was performed to evaluation the changes in the PPG waveform and cardiovascular characteristics with changes in local SST. The changes in the PPG components and cardiovascular characteristics were expressed as means with standard deviations over time. Person`s correlation coefficients were evaluated via the correlation analyses of the PPG components and SST. The statistical program used in this study was SPSS 12.0 for Windows.
[6]-[8]Ⅲ. Results
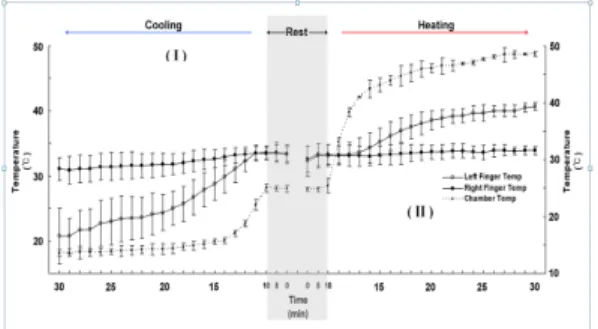
In both the cooling and heating experiments, the temperature within the chamber was not altered for the initial 10 min; in the subsequent 20 min, the temperature was raised and lowered. The results of the changes in SST of both fingers obtained from the contact temperature sensors, the periodic temperature image data (I, II) using an infrared camera, and BP, are shown as the mean and standard deviation (Fig. 2)
그림 2. 챔버에서 저온에서 고온으로 온도상승시 왼손가락과 오른손가락의 온도변화.
Fig. 2. The temperature variation of left and right finger during cooling and heating in the chamber. (Temp): Temperature
The continuous digital BP was measured using a Finometer, and the periodic central BP was measured using Model-53000.
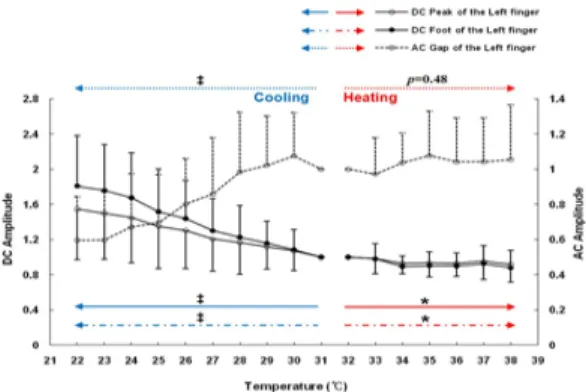
The components of the PPG waveform obtained in the rest condition for the initial 10 min in each case were averaged as 1; the values of the changed the components of the PPG waveform by a change in finger SST during the subsequent 20 min were normalized by the initial values (Fig. 3).
Correlations in relation to changes in each
component of the PPG waveforms as detected by
changes of finger SST are also shown. The
components of the PPG signal of the right hand are
similar to those of the left hand which was directly
affected by temperature changes.
그림 3. 손가락 피부온도변화에 따른 광용적파의 변화.
Fig. 3. Changes in Photoplethysmography components in accordance with changes in finger skin surface temperature.
그림 4. Finometer를 이용한 왼중지손가락으로부터 얻어지 는 심혈관의 변화.
Fig. 4. Changes in cardiovascular status obtained from the left middle finger using the Finometer. Heart rate (HR)
Ⅳ. Discussion
The results of the initial 10 min of the test in rest conditions before heating and cooling did not indicate any significant changes or effects. Although individual vasoconstrictions and vasodilatations of the subjects appeared, this occurrence results from the natural process of temperature control, so there was no occurrence of factors that affected the data trend. The method employed in this study was the application of temperature stimulation in air; this stimulation was relatively low. Changes in the finger SST of the subjects for each 20 min experiment period decreased in the cooling process and increased in the heating process along with temperature changes of the chamber.
The SST data from the fourth finger was compared with the SST data from the free finger from sensors using an infrared camera; this comparison was performed under the assumption that all fingers have similar SST distributions, because healthy subjects without cardiovascular disease were tested.
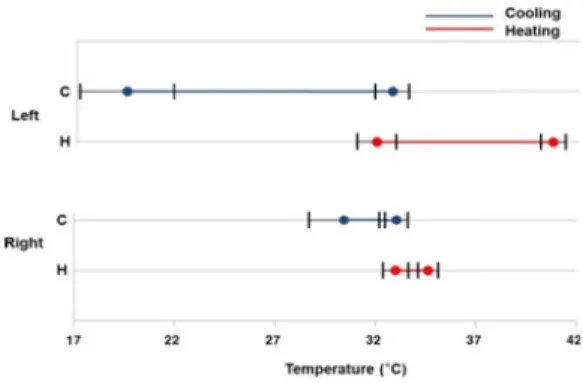
During the experiment, the left hand was placed inside the chamber while the right hand was placed outside, so the SST of the left hand, which was directly affected, showed more rapid changes in accordance with the temperature changes within the chamber than the right hand (Fig. 5 left hand 16°C~41°C, right hand 27°C~35°C). The results of the SST changes using the infrared camera can be seen to be identical to those of the contact temperature sensor (Fig. 2). After the SST reached 24°C in the chamber during the cooling experiment, the temperature change was very slight;
after the SST reached 37°C in the heating experiment, the temperature change was also very slight.
There are slight differences in the temperature change between individuals, but with surface temperatures from 23°C to 39°C, SST changes in all subjects could be observed (Fig. 5). The finger SST varied due to the physiologically proposed thermo-natural process of the limbs and gradually changed after a sudden initial change. However, the reduction among subjects was not identical, due to individual physiological differences.
In both the cooling and heating experiments, similar values of BP were obtained in both the central and finger region for the initial 10 min, when the temperature stimulation was not applied. However, the values were significantly different for the subsequent 20 min, when the temperature within the chamber was raised and lowered. The BP measured with the oscillometric method was not affected by temperature;
measurement with a Finometer, which employs a PPG waveform to measure BP, was affected by temperature (Fig. 3).
By placing the finger at the same height as the
chest, the effects of hydrostatic pressure were
eliminated. The changes in systolic and diastolic BP in the experiment showed a rising trend, different than the central BP, for which there was no change or an insignificant change. The differences in the pre- and post-experiment values were very clear, which is thought to be the result of the physiological change of the left hand induced by the heating and cooling; this physiological condition is produced by the temperature adaptation mechanism resulting from the changes in blood flow and blood vessels.
The left side of Figure 6 shows a 30 min recording of the data from both hands in the cooling experiment (Temperature, PPG DC, and PPG AC components for both hands), and the right side shows 5 s of measured data from the left hand. It also shows the components of the PPG waveform used in this study.
그림 5. 저온과 고온환경에서 대상자사이에 양손가락의 피부 온도변화의 범위
Fig. 5. The range of variation in skin surface temperature of both fingers between subjects in the cooling and heating experiment.
The PPG waveform is derived as a voltage signal generated by a photodetector for light, which detects changes in the blood volume and flow; the light passes through the skin, arterial blood, venous blood, and tissue. The waveform consists of DC and AC components. The DC component represents static blood volume in the artery, vein, and tissue and the AC component indicates pulsed blood flow in the artery, which is influenced by the contraction and relaxation of the heart
[3][4]. Accordingly, the DC component reflects
change in blood volume, and the AC component reflects vascular status. The compositions determined from PPG indicate the changes in blood volume, and when the resulting voltage value outputted from the values of the DC components rises, the blood volume decreases;
when it falls, the blood volume increases. This occurrence reflects the increase in blood flow per heart beat when the voltage value outputted from the AC component rises, and the decrease in blood flow when it falls
[5][6]. The analysis is shown separately for the left and right fingers (Fig. 3). In the results of the raised temperature in the confidence range of 22℃ to 38℃ of the left finger, a decrease in the DC components of the PPG waveform and an increase in the AC component can be seen. The same results are shown for the right finger, although the scope of variation is much smaller. These results are consistent with the physiological phenomenon where vasoconstrictions are caused by the cooling process and vasodilatations are caused by the heating process; this process is due to the effects on the vessels of a heating and cooling reaction in a local area, based on the fact that the blood vessels in the hand actively contract and expand to control heat
[7][8]. That is, the cooling of the blood vessel walls causes the loss of contractive capacity, while heating increases this capacity. However, as seen in the data, the above explanation was accurate for the cooling process, but weaker results were produced for the heating process. This phenomenon backs up the concept of stronger protection against cold than heat in that the cooling is observed to be more decisive than the heating in terms of the human body reaction.
The results demonstrate that the components of
PPG waveform changes are linked to body temperature
changes and support the theory that control of body
temperature is achieved mainly through blood flow
control; that is, the body temperature in the
environment is controlled by the contraction and
expansion of the blood vessels and the blood
distribution is controlled for the increase and decrease
of heat loss.
※ Acknowledgement :“This work (Grants No. 00048056-1) was supported by Business for Cooperative R&D between Industry, Academy, and Research Institute funded Korea Small and Medium Business Administration in 2011.”
References
[1] Q. Zhang, G. Lindberg, R. Kadefors, J. Styf, A non-invasive measure of changes in blood flow in the human anterior tibial muscle, Eur J Appl Physiol 84, 448–452 (2001).
[2] R.R. Anderson, J.A. Parrish, The optics of human skin, J Invest Dermatol 77, 13–19 (1981).
[3] A. Elvan-Taspnar, L. Uiterkamp, J.M. Sikkema, M.L. Bots, H.A. Koomans, H.W. Bruinse, A.Franx, Validation and use of the Finometer TM for blood pressure measurement in normal, hypertensive and pre-eclamptic pregnancy, J Hypertens 21, 2053–2060
[4] M.A. Stroud, Digital and brachial artery blood pressure measurements during peripheral, cold-induced vasoconstriction, Eur J Appl Physiol 68, 134–138 (1994).
[5] P.A. Kyriacou, S. Powell, R.M. Langford, D.P.
Jones, Investigation of oesophageal photoplethy- smographic signals and blood oxygen saturation measurements in cardiothoracic surgery patients, Physiol Meas 23, 533–545 (2002).
[6] M. Nitzan, J.J. Vatine, A. Babchenko, B.
Khanokh, J. Tsenter, J. Stessman, Simultaneous measurement of the photoplethysmographic signal variability in the right and left hands, Laser Med Sci 13, 189–195 (1998).
[7] C. Huizenga, A model of human physiology and comfort for assessing complex thermal environments, Build Environ 36, 691–699 (2001).
[8] C. Huizenga, Skin and core temperature response to partial- and whole-body heating and cooling, J Therm Biol 29, 549–558 (2004).
저자 소개
염 호 준(종신회원)