다양한 데침조건에서 돌산갓의 이화학적 특성 및 LC-PDA/MS/MS 분 석
손혜련1, 오선경1, Chigen Tsukamoto2, 최명락1*
Quality Characteristics of Dolsan Leaf Mustard according to Various Blanching Conditions and Liquid Chromatography with Photodiode Array and Tandem Mass Spectrometry Analysis
Hae-Reon Son1, Sun-Kyung Oh1, Chigen Tsukamoto2, and Myeong-Rak Choi1*
Received: 13 October 2015 / Revised: 7 January 2016 / Accepted: 14 January 2016
© 2016 The Korean Society for Biotechnology and Bioengineering
Abstract: This study aims to examine the optimum blanch- ing conditions as a pretreatment condition to improve the stor- age stability of Dolsan leaf mustard pickle. The effects of the blan- ching temperature and time were investigated at a tem- perature range of 80-100
oC. Sampling was done for 1 month after a 5 days interval. The L value of the Dolsan leaf mus- tard was found to be the highest at 80
oC. The cutting force increased as the blanching temperature increased. The tensile strength decreased at 95
oC and 100
oC. In addition, the sen- sory evaluation scores were the best at 80
oC. The storage sta- bility was assessed at various blanching temperatures to increase the sinigrin content during storage. Liquid chroma- tography with photodiode array and tandem mass spectrome- try (LC-PDA/MS/MS) analysis was conducted to identify and quantify the sinigrin content in the Dolsan leaf mustard. Sini- grin as an internal standard was co-injected into each sample solution. The sample was monitored by recording the ultravi- olet absorbance at 228 nm and by electrospray ionization
(ESI) positive ion mode in the m/z 50-1,500 range. Blanch- ing the sample at 80
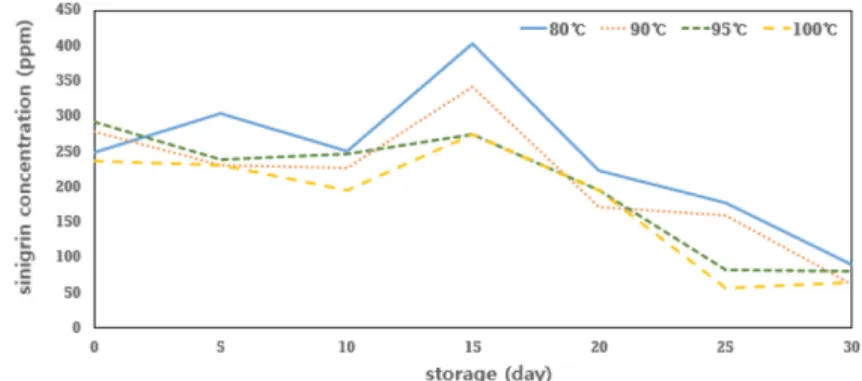
oC showed the highest sinigrin concentra- tion during storage among various temperatures and the maximum concentration was 350 ppm at 15 days storage.
Study on utilization of vegetable from food processing of leaf mustard and preservation conservation results suggest that blanching at 80
oC is expected to improve the palatability of the pickle.
Keywords: Leaf mustard, LC-PDA/MS/MS, Sinigrin, Glucos- inolates, Blanching
1. INTRODUCTION
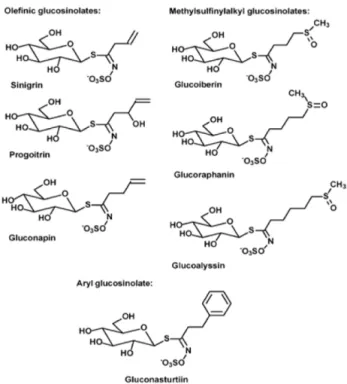
Leaf mustard (Brassica juncea) is a member of the Brassicaceae family, and mustard seeds are used as a spice. The Dolsan leaf mustard is larger in size than traditional leaf mustard, and is abundant in glucosinolate, polyphenols, and sulfur compounds [1]. Which play critical roles in the pharmacological actions of the body as physiologically active substance. Moreover, Dolsan leaf mustard strengthens the immune system and helps in pre- venting cancer [2]. Dolsan leaf mustard kimchi is abundant in vitamins, minerals, and sinigrin, a glucosinolate produced during fermentation [3]. Glucosinolates are found in Brassica
1전남대학교 바이오전자메디컬협동과정
1Department of Biomedical and Electronic Engineering, Chonnam National University, Yeosu 550-749, Korea
Tel: +82-61-659-7303, Fax: +82-61-659-7309 e-mail: [email protected]
2일본 이와테대학교 농학부 응용생물화학과정
2Department of Applied Biological Chemistry, Iwate University, Morioka 020-8550, Japan
총설
crops and are known to decrease cancer risk. Glucosinolates are characterized by a core sulfated isothiocyanate group, which is conjugated to thioglucose and a further R-group. R-group are sulfur containing side chains, aliphatic-straight chains, aliphatic- branched chain, olefins, aromatics, benzoates, indoles, glycosy- lated, benzyl glycosides, cinnamic glycosides and seleno. Both the glucose and central carbon of the isothiocyanate group are often further modified [4]. Dolsan leaf mustard is known to contain higher sinigrin content among other glucosinolate com- ponents [5]. Sinigrin, one of the glucosinolates, is a bioactive compound that has an olefinic glucosinolate structure [6]. Till date, the blanching condition of onion, Aster scaber, and dan- delion has progressed extensively, but blanching condition of the leaf mustard is yet to be explored. Hence, this study aims to examine the optimum blanching condition as a pretreatment to improve storage stability of Dolsan leaf mustard using Dolsan leaf mustard pickle. This process can also be used as a supple- mentary data for the production of Dolsan leaf mustard pickles.
2. MATERIALS AND METHODS
2.1. Materials
Dolsan leaf mustard (DLM) was produced at Yeosu-si Dolsan- eup, Korea and harvested in October 2014. Sinigrin standard was purchased from Sigma chemical Co. (St. Louis, MO, USA) for analysis.
2.2. DLM blanching sample preparation
DLM was blanched at different temperatures 80, 90, 95, and 100
oC for 10 s and were washed three times with cold water.
Excess water was removed during 3 min, and 350 g sample was packed in food grade polyethylene bags. They were stored at 0
oC for 30 days after preparation (30 DAP) were and used for the experiment after a 5 day interval.
2.3. Color measurement
Color measurement was performed using a Color Reader (JC 801S, Color Techno System Co., Japan) with an 8 mm diameter measuring area. The instrument was calibrated with a standard white plate. Measured L, a, and b values were used as indicators of lightness, greenness, and yellowness, respectively. All sam- ples were measured three times.
2.4. Hardness analysis
DLM samples size of 4×1 cm² were cut from the central part of the DLM at each stage of storage. The hardness of the DLM were measured using a rheometer (CR-500DX, Osaka, Japan).
A 10.00 kg load cell was installed at the rheometer cross-head
and chart speeds were 5 and 1.0 mm/s, respectively. Hardness analysis is a type of compression test that was used to determine the hardness of the sample. Moreover, compression elasticity test jig and cutting force test jig were used to determine the tensile strength and cutting force of the materials, respectively.
Samples were stored at room temperature for 30 min before analysis. All samples were measured in three times.
2.5. Sensory evaluation
For the sensory evaluation, stored DLM were periodically taken out (0, 5, 10, 15, 20, 25, and 30 days). The sensory evaluation was performed by 10-trained panelists, who were graduate stu- dents at the Chonnam National University, and were familiar with DLM consumption. The panelists evaluated the DLM ran- domly. The appearance, color, flavor, texture and overall accep- tability were evaluated using a 5-point scale (1 = very weak, 3
= moderate, 5 = very strong).
2.6. Sinigrin extraction
DLM sample (1 g) was subjected to a soxhlet extractor with 200 mL of 50% (v/v) acetonitrile in a round flask and extracted at 93-94
oC for 24 h. After cooling at room temperature, the extract was analyzed.
2.7. Quantification of the sinigrin concentration using HPLC analysis
Sinigrin was extracted from DLM and was analyzed by HPLC
Fig. 1. Molecular structures of glucosinolates.
using an Inertsil Ph-3 column (250 mm × 4.6 i.d.; GL Science, Tokyo, Japan). The mobile phase was consisted of water (A) and acetonitrile (B) using gradient elution according to the following program; 0-7 min 10% B; 7-16 min 35% B; 16-18 min 100% B; 18-35 min 0% B. The total flow rate was 0.94 mL/min and was monitored at an ultraviolet (UV) wavelength was of 228 nm. The oven temperature was set at 40
oC.
2.8. Analysis of sinigrin using LC-PDA/MS/MS
Liquid chromatography with photodiode array and tandem mass spectrometry (LC-PDA/MS/MS) analysis was performed by Shimadzu Prominence UPLC with a Thermo Orbitrap XL sys- tem (Thermo Fisher Scientific, Bremen, Germany). The LC column used was Inertsil 03 Ph-3 (250×4.6mm i.d.)(GL Science, Tokyo, Japan), and the mobile phase used was solvent A (water) and solvent B (acetonitrile) with a gradient of 0 -35% for 35 min, and the data acquisition time was 18 min. Total flow rate was 0.94 mL/min and oven temperature was 40
oC. Sinigrin con- centration (ppm) was quantified using a photodiode array (PDA) detector by monitoring the UV absorbance at 228 nm. Sinigrin (5% solution) as an internal standard was co-injected into each sample solution. MS and MS/MS data were obtained by electro- spray ionization (ESI) positive ion mode using the following parameters: m/z range 50-1,500, source voltage 5.40 kV, capil- lary voltage 48.00 V, capillary temperature 275
oC, sheath gas flow 50 L/min, aux gas flow 10 L/min, source current 1,000 mA, and tube lens 100 V.
2.9. Statistical analysis
All tests and analyses were repeated at least three times. The results are expressed as mean± standard deviation (SD). One way analysis of variance (ANOVA) and Duncan’s test were used
for multiple comparisons using the SPSS version 21.0 (SPSS Institute, Chicago, IL, USA). The values were considered to differ significantly if the P value was less than 0.05.
3. RESULTS AND DISSCUSSION
3.1 Color measurement
Change in color of the DLM samples caused by different blanching treatments at 10 s and of DLM samples stored at 0
oC for 30 days are presented in Table 1. The L value, which indi- cates the lightness, was highest at 80
oC in 17.69±0.51 and was the lowest at 100
oC in 13.48 ±0.38 at 30 days storage (p<0.05).
Hence, the L value result show that a tendency significantly decreased at high temperature and with longer storage period.
The a value, which indicates the greenness , was the highest at 90
oC in -4.50±0.37, and was the lowest at 80
oC in 6.52±0.35 at 30 days storage (p<0.05). This result is similar to the previous reports of Choi et al. [7], Lee at al. [8]. The b value indicates yellowness was the highest at 100
oC in 26.52 ±0.33, and was the lowest at 90
oC in 18.85±0.38 at 30 days storage (p<0.05).
Previous studies have suggested that [8,9], this phenomenon involved removal of air around the fine hairs on the surface of plant tissues as well as between the cells, which are responsible for the alteration of the reflecting properties of the surfaces.
The results show the effect of blanching temperature on the L, a and b values.
3.2. Hardness analysis
The hardness of the DLM samples of different blanching treatments at 10 and stored at 0
oC for 30 days are presented in Table 2. The tensile strength ranged from 10.81-10.73 kgf/cm
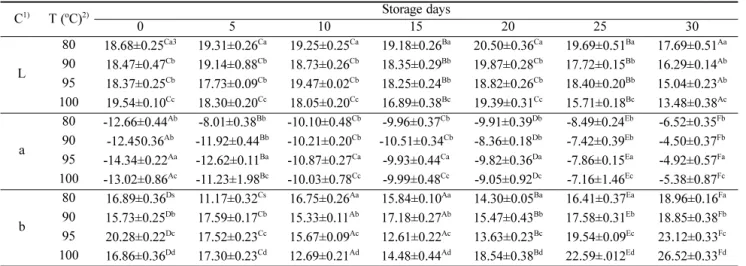
2Table 1. Changes in the color of blanched Dolsan leaf mustard in various water temperatures
C1) T (oC)2) Storage days
0 5 10 15 20 25 30
L
80 18.68±0.25Ca3 19.31±0.26Ca 19.25±0.25Ca 19.18±0.26Ba 20.50±0.36Ca 19.69±0.51Ba 17.69±0.51Aa 90 18.47±0.47Cb 19.14±0.88Cb 18.73±0.26Cb 18.35±0.29Bb 19.87±0.28Cb 17.72±0.15Bb 16.29±0.14Ab 95 18.37±0.25Cb 17.73±0.09Cb 19.47±0.02Cb 18.25±0.24Bb 18.82±0.26Cb 18.40±0.20Bb 15.04±0.23Ab 100 19.54±0.10Cc 18.30±0.20Cc 18.05±0.20Cc 16.89±0.38Bc 19.39±0.31Cc 15.71±0.18Bc 13.48±0.38Ac
a
80 -12.66±0.44Ab -8.01±0.38Bb -10.10±0.48Cb -9.96±0.37Cb -9.91±0.39Db -8.49±0.24Eb -6.52±0.35Fb 90 -12.450.36Ab -11.92±0.44Bb -10.21±0.20Cb -10.51±0.34Cb -8.36±0.18Db -7.42±0.39Eb -4.50±0.37Fb 95 -14.34±0.22Aa -12.62±0.11Ba -10.87±0.27Ca -9.93±0.44Ca -9.82±0.36Da -7.86±0.15Ea -4.92±0.57Fa 100 -13.02±0.86Ac -11.23±1.98Bc -10.03±0.78Cc -9.99±0.48Cc -9.05±0.92Dc -7.16±1.46Ec -5.38±0.87Fc
b
80 16.89±0.36Ds 11.17±0.32Cs 16.75±0.26Aa 15.84±0.10Aa 14.30±0.05Ba 16.41±0.37Ea 18.96±0.16Fa 90 15.73±0.25Db 17.59±0.17Cb 15.33±0.11Ab 17.18±0.27Ab 15.47±0.43Bb 17.58±0.31Eb 18.85±0.38Fb 95 20.28±0.22Dc 17.52±0.23Cc 15.67±0.09Ac 12.61±0.22Ac 13.63±0.23Bc 19.54±0.09Ec 23.12±0.33Fc 100 16.86±0.36Dd 17.30±0.23Cd 12.69±0.21Ad 14.48±0.44Ad 18.54±0.38Bd 22.59±.012Ed 26.52±0.33Fd
1)
Color value.
2)Blanching temperature.
3)All values are mean±SD of the triplicate determination. The mean in row (a-d) and a column (A-G)
followed by different superscripts are significantly different at p<0.05 by Duncan's range test.
at 0 days storage and then the duration of the storage was signi- ficantly decreased. Least hardness was recorded at 100
oC at 30 days storage in 9.45±0.07 kgf/cm
2. Lee at al. [8] reported that decrease the hardness of onion at a higher blanching treatment.
Cutting force ranged from 974.9~926.8 gf/cm
2at 0 days storage, and then the storage period was significantly increased. Out of
that, 100
oC at 30 days storage increased in 3,586.3±47.1 gf/cm
2( p<0.05). Thus, in the blanching process, the volume of plant tissues by heat treatment, the density and the change in weight as well as changes in the cell structure, are due to a difference in texture [11].
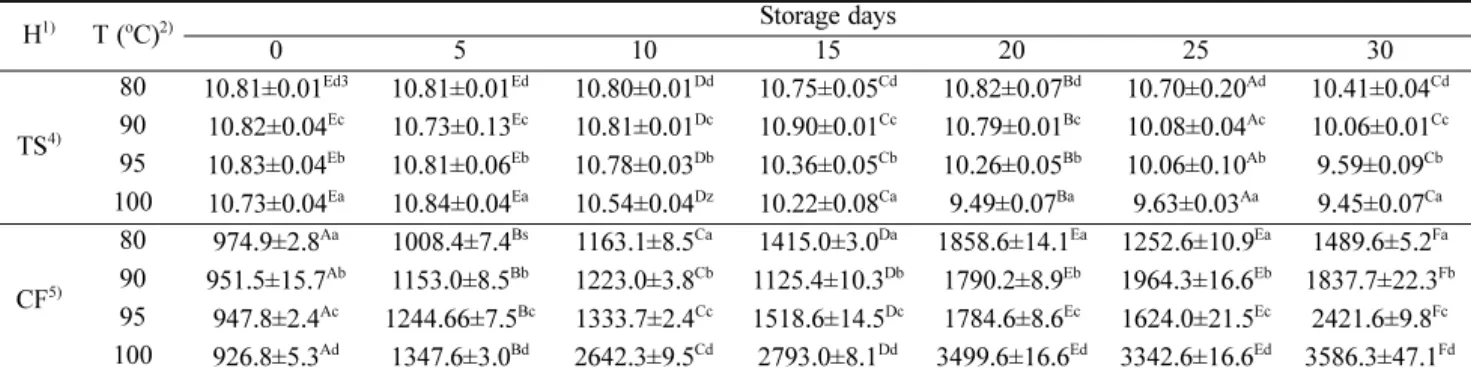
Table 2. Changes in the tensile strength at hardness of blanched Dolsan leaf mustard in various water temperatures
H1) T (oC)2) Storage days
0 5 10 15 20 25 30
TS4)
80 10.81±0.01Ed3 10.81±0.01Ed 10.80±0.01Dd 10.75±0.05Cd 10.82±0.07Bd 10.70±0.20Ad 10.41±0.04Cd 90 10.82±0.04Ec 10.73±0.13Ec 10.81±0.01Dc 10.90±0.01Cc 10.79±0.01Bc 10.08±0.04Ac 10.06±0.01Cc 95 10.83±0.04Eb 10.81±0.06Eb 10.78±0.03Db 10.36±0.05Cb 10.26±0.05Bb 10.06±0.10Ab 9.59±0.09Cb 100 10.73±0.04Ea 10.84±0.04Ea 10.54±0.04Dz 10.22±0.08Ca 9.49±0.07Ba 9.63±0.03Aa 9.45±0.07Ca
CF5)
80 974.9±2.8Aa 1008.4±7.4Bs 1163.1±8.5Ca 1415.0±3.0Da 1858.6±14.1Ea 1252.6±10.9Ea 1489.6±5.2Fa 90 951.5±15.7Ab 1153.0±8.5Bb 1223.0±3.8Cb 1125.4±10.3Db 1790.2±8.9Eb 1964.3±16.6Eb 1837.7±22.3Fb 95 947.8±2.4Ac 1244.66±7.5Bc 1333.7±2.4Cc 1518.6±14.5Dc 1784.6±8.6Ec 1624.0±21.5Ec 2421.6±9.8Fc 100 926.8±5.3Ad 1347.6±3.0Bd 2642.3±9.5Cd 2793.0±8.1Dd 3499.6±16.6Ed 3342.6±16.6Ed 3586.3±47.1Fd
1)
Hardness.
2)Blanching temperature.
3)All values are mean ±SD of the triplicate determination. The mean in row (a-d) and a column (A-G) followed by different superscripts are significantly different at p<0.05 by Duncan's range test.
4)Tensile strength(kgf/cm
2) in hardness.
5)Cutting force(gf/cm
2) in hardness.
Fig. 2. (A) Sensory characteristics of blanched Dolsan leaf mustard at 0 day, (B) Sensory characteristics of blanched Dolsan leaf mustard at 30 days.
3.3. Sensory evaluation
The sensory evaluation of DLM samples using different blan- ching treatment at 10 s stored at 0
oC in 0 days and 30 days are presented in Fig 2A and 2B. All values were significantly inc- reased or decreased (data not shown) with longer storage pe- riod. The color ranged from of 4.3 to 3.9 at 0 days storage, and 80
oC at 30 days storage increased to 3.5±0.12 (p<0.05). The
crunch texture significantly decreased with time, and 30 days storage was the lowest at 2.4±0.31 at 100
oC (p<0.05). The touch texture significantly increased with time and was the highest at 30 days to 4.2±0.41 at 100
oC and the lowest to 3.5±0.01 at 100
o
C (p<0.05). The flavor ranged from 4-4.2 at 0 days storage; 80
o
C at 30 days storage significantly to decreased to 2.3±0.07. The overall acceptability was highest at 30 days at 4.3±0.17 at 80
oC
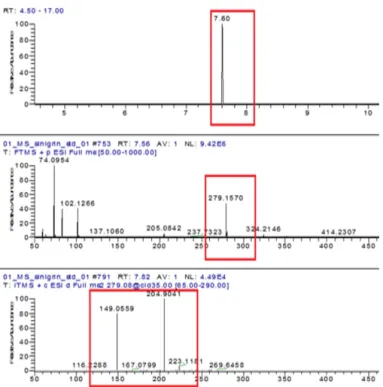
Fig. 3. MS and MS/MS analysis of standard sinigrin. Selected ion chromatography screened by m/z 279.2 (upper) and MS spectrum (middle) of 7.6 min component, and MS/MS of the m/z 279.2 component (bottom).Fig. 4. MS and MS/MS analysis of the sample extract of blanching at 80oC. MS spectrum (upper) of 7.6 min component and MS/MS of the m/z 279.2 component (bottom). These fragment patterns completely corresponded to those of standard sinigrin (desulfo-sinigrin).
and the lowest at 2.0±0.81 at 100
oC (p<0.05). These results sug- gest that the blanching at 80
oC is expected to improve the com- prehensive palatability of the pickle.
3.4 Analysis of sinigrin by LC-PDA/MS/MS
Sinigrin as a standard material eluted at 7.60 min and MS ana-
lysis of the peak component showed that the molecular mass was m/z 279.1570 and that fragment ions gave m/z 204 and 149.06 (Fig. 3). These data show that sinigrin formed desulfo- glucosinolates [M-SO
3+H]
+. Sinigrin, which was confirmed by LC-MS/MS analysis (Fig. 4), was detected from blanched DLM.
Although blanching temperature affected the sinigrin concent-
Fig. 5. Effect of blanching temperature on sinigrin concentration of DLM during storage.Fig. 6. HPLC chromatograms (UV 228 nm) of 80oC blanching and at 15 day after preparation (upper) and 30 day after preparation (bottom).
ration during storage at 0
oC (Fig. 5), sinigrin concentration inc- reased until 15 day after preparation (DAP) and decreased after 15 DAP. Blanching at 80
oC showed constantly higher sinigrin concentration than the other temperature in the whole storage period (30 days). It seems that sinigrin produced by enzyme activity remained in DLM for the first 15 days but degraded during storage. Unknown components, whose basic structure was similar to glucosinolates, were detected from 30 DAP sam- ples (Fig. 6). Decreased sinigrin concentration might have inc- reased the other components. Common blanching condition of DLM to prepare pickle is 94
oC for 13s. If blanching temperature was lower than 80
oC, the physical properties and permeability of ingredients would be drastically changed. Blanching at 80
oC must be the lowest to prepare DLM pickle, and thus. blanching at 80
oC will be the best condition for sinigrin production.
4. CONCLUSION
The color, hardness and sensory evaluation showed that DLM blanched at 80
oC for 10 s is highly preferred (p<0.05). Blanch- ing at 80
oC showed constantly higher sinigrin concentration than other temperatures during the storage period. These results suggest that blanching at 80
oC is expected to improve the pala- tability of the pickle. We were able to optimize the blanching condition for 10 s of DLM at 80
oC.
ACKNOWLEDGEMENTS
This work was supported by the BK21 program.
REFERENCES
1. Cho, Y. S., B. S. Ha, S. K. Park, and S. S. Chun (1993) Contents of carotenoids and chlorophylls in Dolsan leaf mustard (Brassica jun- cea). Korean J. Diet. Cult. 8: 153-157.
2. Lee, S. M. and S. H. Rhee (1997) Inhibitory effect of various cru- ciferous vegetables on the growth of human cancer cells. Korean J. Life Sci. 7: 234-240.
3. Diplock, T. A (1991) Antioxidants nutrient and disease prevention.
Am. J. Clin. Nutr. 53: 189-193.
4. Clarke, D. B (2010) Glucosinolates, structures and analysis in food.
Anal. Methods. 2: 310-325
5. Choi, M. R., E. J. Yoo, S. H. Song, D. S. Kang, J. C. Park, and H.
S. Lim (2001) Comparison of physiological activity in different parts of Dolsan leaf mustard. Korean J. Soc. Food Nutr. 30: 721- 725.
6. Lijiang, S., J. M. John, P. B. Nigel, and J. T. Paul (2005) Analysis of glucosinolates, isothiocyanates, and amine degradation prod- ucts in vegetable extracts and blood plasma by LC-MS/MS. Anal.
Biochem. 347: 234-243.
7. Choi, N. S., S. S. Oh, and J. M. Lee (2001) Change of biologically functional compounds and quality properties of Aster scaber (Cham- chwi) by blanching condition. Korean J. Food Sci. Technol. 33:
745-752.
8. Lee, H. O., Y. J. Lee, J. Y. Kim, D. H. Yoon, and B. S. Kim (2011) Quality characteristics of frozen welsh onion (Allium fistulosum L.) according to various blanching treatment conditions. Korean J.
Food Sci. Technol. 43: 426-431.
9. MacKinney, G. and C. A. Weast (1940) Colors changes in green vegetables frozen-pack peas and string beans. Industri. Engi. Chem.
32: 392-395.
10. Tijskens, L. M. M., E. P. H. M. Schijvens, and E. S. A. Biekman (2001) Modelling the change in colour of broccoli and green beans during blanching. Innovative Food Sci. Emerg. Technol. 2: 303- 313.
11. Arpaia, M. L., F. G. Mitchell, A. A. Kader, and G. Mayer (1986) Ethylene and temperature effects of softening and white core inclu- sion of kiwifruit stored in air or controlled atmospheres. J. Amer.
Soc. Hort. Sci. 111: 149-153.