Accelerator
Energy Calibration for Neutron Capture Resonance of Natural Sm by Using 46-MeV Electron Linear Accelerator
Jaehong Lee, Samyol Lee
Department of Radiological Science, Nambu University, Gwangju 506-824, Korea
Abstract
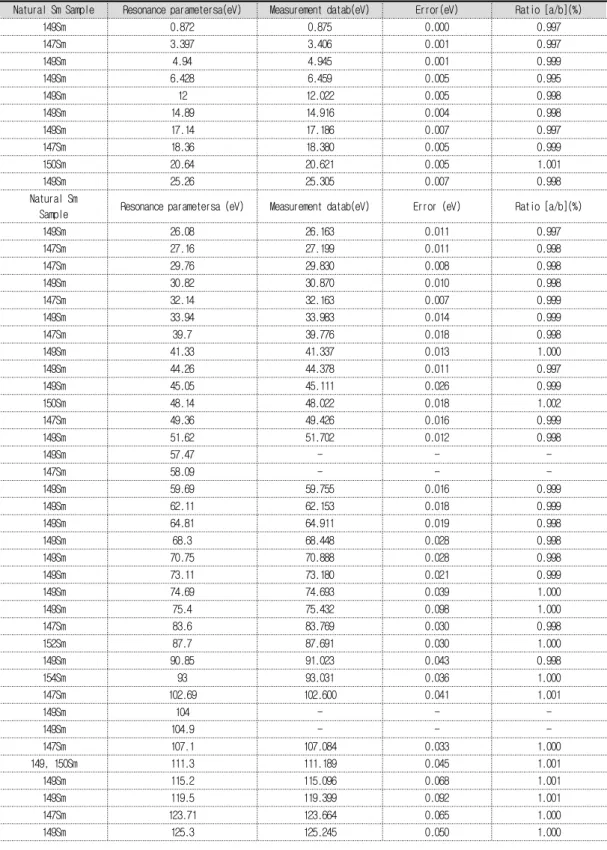
Energy calibration is important to identify accurate neutron capture resonance energy in the neutron TOF (Time-of-Flight) experiment. In present study, the accurate neutron capture resonance energies of natural Sm were measuredby using a 46-MeV electron linear accelerator (linac) at the Research Reactor Institute, Kyoto University(KURRI). The BGO spectrometer were adopted for measurement the prompt capture gamma-ray of the sample. To obtain energy calibration curve, resonance energy of a gold sample used as standard resonance energy Mughabghab’s data (From neutron resonance parameters data). Previous data (by Mughabghab) of natural Sm sample have been compared with the present result.
Key word Energy calibration, Neutron, Capture, Resonance, Natural Sm, TOF
I. INTRODUCTION
Today, data of neutron capture resonance parameters gives very useful information to a field of study of Nuclear Physics, Nuclear Engineering, Nucleosynthesis and Radiation Therapy. This kind of data information is important accurate data base. Specially, Radiation Therapy and Nuclear Physics are great important accurate data base of neutron capture resonance energy forto understand nuclear structure and to research boron neutron capture therapy. Energy calibration is important to identify accurate neutron capture resonance energy in the neutron TOF (Time-of-Flight) experiment. In present study used Sm is one of the most important standard energy calibration samples with gold. Therefore, to find accurate neutron capture resonance of Sm for energy calibration is mean to get accurate data of the neutron resonance parameters. In present study, the neutron capture resonance energies of natural Sm were identified by using a 46-MeV electron linear accelerator (linac) at the Research
Reactor Institute, Kyoto University (KURRI). The BGO spectrometer were adopted for measurement the prompt capture gamma-ray of the sample To obtain energy calibration curve, resonance energy of a gold sample used as standard resonance energy Mughabghab’s data (Neutron resonance parameters data). Previous data (by Mughabghab) of natural Sm sample have been compared with the present result.
II. EXPERIMENTS A. Experimental Arrangement
Energy calibration for neutron capture resonance of
natural Sm measurement has been carriedout by the
neutron TOF methed using the 46-MeV electron linac
and the total energy absorption detector assembled with
BGO scintillatiors at the KURRI. The experimental
arrangement is shown in Fig. 1. The flight path used in
the experiment is in the direction of 135 deg to the
KURRI linac electron beam. Bursts of pulsed neutrons
from the water-cooled tantalum target strike the capture
sample placed at a distance of 12.7±0.02m from the neutron source. The neutron and gamma-ray collimation system is mainly composed of B4C, Pd, Li2CO3, and borated paraffin and is tapered from~12 in diameter at the entrance of the flight tube to
㎝
1.8×1.8 ㎝ at the BGO assembly. The capture sample, which was put on the sample holder, was placed at the
center of the BGO assembly. A Pd shadow shielding bar (5×5 ㎝ and 10 ㎝ long) was put in front of the photoneutron target to reduce the intense gamma-flash produced at the Ta target. The neutron beam intensity during the experiment was monitored with a BF3 proportional counter inserted into the TOF neutron beam, as seen in Fig. 1.
KURRI LINAC (pulsed electron beam)
Sample e
-
Ta-target
135 o n
Pb-Shadow
2.0 m
Concrete wall
Pb Paraffin-Li CO
2 3Flight tube
B C+H BO
4 3 3BF Counter
312.7+0.02 m bar
BGO Detector
Water Tank
B C
4Pb
Pb sheet
_
Figure 1. Experimental arrangement for the energy calibration for neutron capture resonance of natural Sm
B. Pulsed Neutron Source
A photoneutron target of Ta has been adopted as an intense pulsed neutron source for the neutron TOF measurement. The water-cooled Ta target is made of 12 sheets of Ta plate, 5 ㎝ in diameter, and the effective thickness is ~3 . The housing of the target is made of ㎝ titanium. This target was set at the center of a water tank, 30 ㎝ in diameter and 35 ㎝ high and having a wall thickness of 0.8 , as a fast neutron moderator. The ㎝ water tank has a re-entrant hole of 10 ㎝ in depth and 10 ㎝ in diameter to extract low-energy neutron.
C. BGO Assembly for Prompt Capture Gamma-Ray Measurement
Prompt capture gamma rays were detected with the BGO assembly as a total energy absorption detector in the TOF measurement. The BGO assembly consists of
12 scintillation bricks 5×5×7.5 ㎤ each. The total volume of the BGO scintillators is 2.25l. Each BGO scintillator was arranged to have the utmost absorption of the capture gamma ray form the sample. A through-hole of 1.8×1.8 ㎠ in section is made in the BGO assembly. A collimated neutron beamis led through the hole to the captures sample, which is placed at the center of the BGO assembly. Moreover, the BGO assembly is installed in a house made of lead bricks of 5 to 10㎝
thickness to shield against background radiation from the surroundings. The inside of the though hole was covered with 6LiF tiles 3 ㎜ thickness to absorb neutrons scattered by the capture sample.
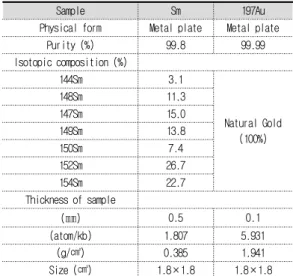
D. Sample
Two kinds of samples were used in the energy
calibration for neutron capture resonance of natural Sm.
Accelerator The parameters of the samples are summarized in table 1.
Sample Sm 197Au
Physical form Metal plate Metal plate
Purity (%) 99.8 99.99
Isotopic composition (%)
144Sm 3.1
Natural Gold (100%)
148Sm 11.3
147Sm 15.0
149Sm 13.8
150Sm 7.4
152Sm 26.7
154Sm 22.7
Thickness of sample
( ㎜ ) 0.5 0.1
(atom/kb) 1.807 5.931
(g/ ) ㎠ 0.385 1.941
Size ( ) ㎠ 1.8×1.8 1.8×1.8
Table 1. Physical of the Samples used in the Energy calibration
E. Data analysis
a) Time of flight Method
The kinetic energy of a neutron is given by, in non relativistic case,
2 2
2 1 2
1
=
=
T M L M
E
n nν
n(1)
Where is the rest mass of neutron, the flight path, and the TOF of the neutron. A more practical equation is given as
2