Journal of Internet Computing and Services(JICS) 2018. Dec.: 19(6): 101-112 101
Development and Comparison of Data Mining-based Prediction Models of Building Fire Probability
홍 성 관1 정 승 렬1*
Sung-gwan Hong Seung Ryul Jeong
ABSTRACT
A lot of manpower and budgets are being used to prevent fires, and only a small portion of the data generated during this process is used for disaster prevention activities. This study develops a prediction model of fire occurrence probability based on data mining in order to more actively use these data for disaster prevention activities. For this purpose, variables for predicting fire occurrence probability of various buildings were selected and data of construction administrative system, national fire information system, and Korea Fire Insurance Association were collected and integrated data set was constructed. After appropriate data cleansing and preprocessing, various data mining methodologies such as artificial neural network, decision trees, SVM, and Naive Bayesian were used to develop a prediction model of the fire occurrence probability of buildings. The most accurate model among the derived models is Linear SVM model which shows 68.42% as experimental data and 63.54% as verification data and it is the best model to predict fire occurrence probability of buildings. As this study develops the prediction model which uses only the set values of the specific ranges, future studies may explore more opportunites to use various setting values not shown in this study.
☞ keyword :Fire probability prediction, fire risk, data mining
1. Introduction
Various disasters such as fire, earthquake, collapse of building, ship sinking are appearing in media every day.
Especially, fire is frequent regardless of whether it is large or small, causing great damage to people and property.
According to the National Fire Information Center operated by the National Fire Agency, the number of fires in 2016 was 43,413, 306 people were killed, 1,718 were wounded, and property damage exceeded 369.7 billion won. In particular, the number of deaths increased by 20.9% from 253 in 2015. The property damage is also increasing every year from 256.5 billion won in 2011. The major cause of the increase in property damage is known as a large fire in buildings and factories. The property damage caused by a major fire is 96 billion won in 2015 and 631 billion won in
1The Graduate School of Business IT, Kookmin University, Seoul, South Korea
* Corresponding author ([email protected])
[Received 22 May 2018, Reviewed 24 May 2018,(R2 13 August 2018), Accepted 27 September 2018]
☆ A preliminary version of this paper was presented at ICONI 2017 and was selected as an outstanding paper.
2016, accounting for 22.16% and 17.06% of total property damage[1].
In order to prevent fire, the front line fire station inspects 320,000 fire prevention facilities every year. Administrative orders such as corrective measures are issued for the buildings where insufficient results have been checked. In addition, fire-fighting administrative force is put into various ways such as investigation of dangerous materials, special investigation of fire-fighting, acceptance of 119 calls, and so on. As a result of these activities, many fire-related data are being produced. Some of these data are used through the national fire information system, but the rest of the data are not being actively used due to various constraints.
Recently, as data science has matured, various academic efforts for the prevention of fire have been actively carried out. One study uses artificial neural networks to predict fire risk in manufacturing facilities[2], while another study analyzes the fire risk of a building using fire statistics[3].
However, most of the existing studies are limited to the use of fire statistics or weather information rather than actively using various accumulated fire data. Other studies are mostly related to fire risk assessment and measurement in the form ISSN 1598-0170 (Print) / ISSN 2287-1136 (Online)
http://www.jics.or.kr Copyright ⓒ 2018 KSII
of direct human investigation.
In this study, we try to predict the probability of building fire by using data mining method instead of evaluating or measuring the fire risk and fire occurrence probability of building by visiting person directly to the building.
In other words, in this study, fire occurrence probability of buildings is predicted based on information of buildings rather than using fire occurrence statistics or weather information as in previous studies.Therefore, in terms of fire occurrence, various variables related to building such as building structure and purpose of use are applied, and human errors that occur when people visit and investigate can be reduced.
Through the prediction of fire occurrence probability of buildings, it is expected that more effective fire prevention activities can be expected by injecting manpower and expenses for various checks carried out for fire prevention into high-risk buildings.
To do this, we review the literatures and collect the existing accumulated fire and building related data. We, then, use various data mining techniques such as artificial neural network, decision tree, SVM (Support Vector Machine) to propose the most suitable data mining method for predicting the probability of building fire.
2. Literature Review
2.1 Fire risk
Studies related to fire have been carried out in various forms for a long time, predominantly predicting the fire risk of a specific area, fire risk evaluation method using statistical data, and fire occurrence factors.
There are various methods for evaluating fire risk.
According to a study on the development of the fire risk index for multi-use premises in 2009 by the National Fire Agency, Domestic fire risk assessment is carried out in the fields of nuclear power, industrial facilities, railways, roads and buildings. Currently, fire risk assessment methods for buildings developed in Korea are mainly in the form of qualitative checklists[4]. The U.S. National Fire Protection Association (NFPA) classifies fire risk assessment methods
into five categories: qualitative method, semi-quantitative probabilistic method, semi-quantitative methodological method, quantitative method, and cost effective risk analysis method. In the risk assessment engineering guide presented by the US fire-fighting technical society, fire risk is measured by the probability of fire occurrence and the result of fire occurrence[4]. In other words, the fire risk should be divided into the fire intensity, which is the probability of occurrence of fire, and the intensity of fire intensity, how much of life and property damage occurs. This discussion suggests that predicting the probability of building fire is a prerequisite before measuring the fire risk of a building.
The NY City Fire Department (FDNY) in the United States is a representative agency that has shown interest in the probability of building fires. The New York Fire Department has developed and operates a Risk Based Inspection System (RBIS) and FireCast 2.0, an algorithm for analyzing building fires. New York City has about 330,000 buildings to be inspected, requiring a systematic and effective management system. As a result, FDNY has started to use RBIS system for analyzing building information, fire factors, weather information, and fines imposed by government agencies in March 2013. FireCast 2.0 is an algorithm that compares the difference between fire-generated buildings and non-fire-generated buildings using 60 key variables of this data and calculates the fire risk to derive a list of buildings most vulnerable to fire[5].
A study on the fire risk prediction model developed jointly by Hansung University and Seoul City University presents a model for predicting death, property damage, and the number of fires using the national fire information system and external variables and additionally, the fire risk index is derived on a regional basis[3]. In particular, this study develops a 5th grade risk matrix based on the probability of disaster and disaster damage and presents the fire risk for each building type[6].
The Korea Fire Protection Association (KFPA) is almost the only one that evaluates fire risk for real buildings, not fire risk studies. It develops KFPA-Fire Risk Index by quantitatively evaluating and quantifying major fire risk factors derived from existing fire risk studies. The index is used to estimate premiums.
The K-fire risk index compares the risk score reflecting only the risk factors that increase the fire risk of the building and the countermeasure score consisting of the elements installed or prepared to reduce the fire risk of the building.
The fire risk index is a relatively simple model in which it is judged to be high risk if it is higher than 100 points and safe from fire if it is lower than 100 points.
In particular, the risk score is calculated by multiplying the basic risk including the basic structure of the building and the use of the building, the fire risk associated with the fire facility, and the process risk if in factory.
In this way, the prediction model of the probability of building fire in Korea is still in its early stage. While the RBIS and FireCast 2.0 of the New York Fire Department is a building risk prediction model that is applied to real buildings, it does not disclose detailed algorithms and it is impossible to test the models if they are applicable in Korea.
Considering that the structure of the building, the type of use, policies and regulations, and the safety check factors of buildings in U.S. do not match those in Korea, it seems that a prediction model suitable for domestic situation is needed to predict the probability of fire in domestic buildings.
2.2 Data mining method for fire prediction probability model
The prediction of fire occurrence probability of buildings can be seen as a binary classification prediction of fire occurrence or not. Various data mining methods such as decision tree, SVM, artificial neural network, and Naive Bayesian can be applied to such binary classification prediction.
2.2.1 Artificial neural network
The artificial neural network is a nonlinear algorithm developed by mimicking the human brain's operation principle. It can extract knowledge or pattern from complex nonlinear data. Since it performs decision without statistical analysis on data as it is input output mapping technique, it is relatively stable and adaptable[7]. An artificial neural network consists of an input layer, an output layer, and a hidden layer. There are several nodes in each layer. When
data is transferred from one layer node to another layer node, the data is multiplied by the connection weight to derive the output value. In conclusion, learning in artificial neural networks is a process of optimizing the connection weights so that the output value can reach an approximation of the desired value [2].
(Figure 1) ANN Architecture
These artificial neural networks are used in various fields such as predicting construction safety accident, predicting colon cancer, and predicting the probability of fire in manufacturing facilities[8][9]. A study proposing a fire risk prediction model using artificial neural network used the result of risk assessment and fire accident data at manufacturing facilities. The predictions of fire occurrence probability were evaluated using four evaluation methods such as prediction accuracy, predicted hit rate, detection rate, and relative prediction accuracy (KuSS Skill Score (KSS)), which ranged from 47% to 73%[7].
2.2.2 Decision Tree
A decision tree is a classification model that shows patterns existing between data as a combination of attributes.
It is an intuitive representation of decision rules in a tree structure, so that researchers can easily understand and explain them. In addition, it is possible to analyze qualitative and quantitative variables and easier to use as it does not have to consider basic assumptions of multivariate analysis such as linearity, normal distribution and equal variances.
However, the results of the analysis are likely to be influenced by the size of the sample. The more the use of the continuous variables is, the less the predictive power of the model decreases. Another drawback is that the problem
of overfitting may arise.
Decision trees are largely generated through four steps, which are the formation of decision tree, the pruning step, the feasibility evaluation step, and the interpretation and prediction step. Decision trees designate appropriate segregation criteria and stopping criteria according to the structure of data and analysis purpose, and use them to form decision trees. Segregation criteria are the criteria for dividing branches, while stopping criterion is used to stop without dividing more branches. In the pruning step, the removal or merging is carried out for branches with high risk of classification errors or branches with inappropriate rules.
In the feasibility evaluation step, the decision tree is evaluated through cross validation, and interpretation and prediction are carried out accordingly.
Although there are no studies on the probability of fire occurrence in buildings using decision trees, we fine some studies in other fields such as film field and traffic field.
Kwon et al. try to predict a box-office record in movie industry using decision trees[10]. There is also a study on characteristics of bus traffic accidents that examined the characteristics of major factors affecting bus traffic accidents[11]. In addition, we find a study which predicts juvenile delinquent behaviors and provides a basis for interventions appropriate to various situations and characteristics[12].
2.2.3 SVM (Support Vector Machine) SVM is the theory which provides an optimal separation boundary to solve the classification problem. SVM is easy to interpret the results as they are based on a clear theoretical basis. SVM has many advantages of achieving high performance of artificial neural network in practical application and performing quick classification learning with a small amount of data[7]. SVM is used to solve various classification and pattern recognition problems in many fields such as marketing field, in which customer purchase prediction model is developed to predict customers’
intentions[13] and telecommunication field, which needs a model for classifying video data in different formats[13].
2.2.4 Naive Bayesian Model
The Naive Bayesian model is a classification algorithm using Bayes' theory that assumes the independence of variables in the data. It is a conditional probability model that assumes that all variables are independent and that there is no association between the variables. The Naive Bayes classifier is one of the simplest techniques using map learning of machine learning. The model is simple and has a simple calculation process, but has the advantage of excellent classification performance. It is also possible to mitigate the curse of dimension, which is a problem that requires a large amount of data in an exponentially larger number than the number of independent variables[14]. The Naive Bayesian model is used in various fields such as research on malicious codes[15], gender discrimination[16], and systematic classification management on posts[17].
3. Research method
3.1 Development process of prediction model of building fire probability
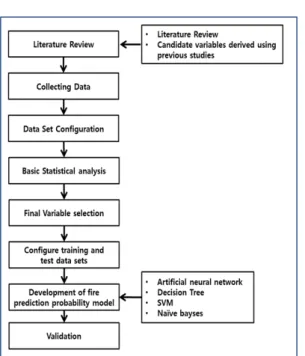
In order to predict the fire occurrence probability using the building data, the existing prior research is analyzed to identify the candidate variables necessary for predicting the probability of building fire occurrence and to identify the system for collecting data. After collecting the basic information of the building and the results of the inspection of the fire-fighting facilities in the identified system, the integrated data set is constructed through the data cleansing process such as the elimination of redundant data. By analyzing the dataset, candidate parameters that can not be collected are excluded and basic statistical analysis is performed to compress the candidate variable list. Then, through the preprocessing such as addition of derivation variables and conversion of variable types, a complete data set composed of variables necessary for the prediction of the probability of occurrence of fire is determined. We use the completed dataset to develop the fire probability prediction model, and finally verify the completed models.
Candidate variables derived using previous studies : 55 Year of construction
Fire History Location (address)
building structure Building Status Place classification Total number of floors number of Ground floor number of Underground floors Specific fire fighting object classification
Road classification (street, back road) Building architectural style
Building pillar form Building Roof Type Total area of the building
Area classification (Downtown, residential area, industrial complex)
Distance to fire station Illegal remodeling Fines payable history Total number of stores Number of restaurants Number of Karaoke / Tavern
Number of other stores Total store area (multiple use area)
Area of restaurant Area of Karaoke / tavern / Other store area (office, etc.)
Total electricity usage Electricity usage per unit area
Number of nursing home Area of nursing home Number of Social welfare facility
Number of medical facilities Number of accommodation
Accommodation Area Possibility of smoking in buildings
Residential population A floating population
Total number of dangerous goods facilities Number of fire facilities
Number of gas facilities Number of electrical facilities Heating Type (Central / Individual)
Auxiliary Heating Status
Air Conditioning Type (Central / Individual) Sprinkler
Fire Alarm System Gas leak detector
Fire extinguisher Number of cooking facilities
weather Temperature
Humidity Air volume
rainfall (Figure 2) Development process of fire probability
prediction model
3.2 Candidate variable selection and data set configuration
Table 1 shows the results of the candidate variables required to predict the probability of building fire occurrence by comparing and analyzing the variables used in the fire risk studies.
(Table 1) Candidate variables derived using previous studies
List of dataset variables : 31 Total number of floors number of Ground floor number of Underground floors
architectural style Building pillar form Building Roof Type Total area of the building Combustion expansion prevention
(fire protection compartment) Year of construction
Fire History Building main use
Apartment Number of fire facilities Number of gas facilities A total of 55 candidate variables were derived. The
variables used to analyze the fire risk in each of the previous studies were combined into one, and the variables of the same nature were excluded. The data for predicting the probability of fire was collected from EAIS (Electronic Architectural administration Information System), KFPA (Korea Fire Protection Association), and NFDS (National Fire Data System). The data collected from EAIS are shown in the table 2 below.
(Table 2) EAIS Data EAIS
term Total Data
2009.03.07~2016.10.25 564,929
The data of the NFDS are fire occurrence information of the building. They are shown in the table 3.
(Table 3) NFDS Collection Data NFDS Collection Data
term Total Data Gyeonggi-do Data 2011.01.01.~
2015.12.31 214,627 49,235
The data collected by KFPA is the facility safety inspection data on the buildings that meet the standards of the fire insurance association annually. However, there are newly added buildings and some buildings are excluded from the facilities inspection because they do not meet the standards. These situations require duplicate removal works since some buildings exist as duplicates of collected data. For redundant buildings, the data of 2016, which is the latest year of the collected data, is maintained and past data is removed to complete the data of the facility safety check results.
Since EAIS, NFDS, and KFPA are different systems, a join key is needed to create a single data set. The join key was created by using the address of the basic information of the buildings collected from the three systems and the data of the three systems collected by using the join key were integrated to form a single structure data set.
Because of difficulty in making every address of all data
(Table 4) KFPA Collection Data KFPA Collection ata
term Total Data Gyeonggi-do Data 20014.01.01~
2014.12.31 29,658 6,973
20015.01.01~
2015.12.31 29,425 6,880
20016.01.01~
2016.09.30 25,560 6,045
as address-based keys, this study uses the data of Gyeonggi Province, which has the most building data. Join is conducted based on about 7,000 data of KFPA, which has the least data on buildings in Gyeonggi Province. Therefore, final data set for fire risk analysis is about 7,000 pieces of building data.
The final data set includes the basic information of the building, the result of safety inspection of the facility, the occurrence of the fire, the loss of life of the fire-causing building, and the property damage amount.
Finally, a total of 31 variables were derived from 55 candidate variables in the 7000 integrated data sets collected from the EAIS, KFPA, and NFDS except for the variables that were not collected. For each variable, a preliminary statistical analysis is conducted to show box plot, frequencies, and mean values.
(Table 5) List of variables in Data
number of dangerous goods facilities Number of electrical facilities
Fire extinguisher
Water-based extinguishing equipment _ Manual Water-based extinguishing equipment_ Automatic
Gas system fire extinguishing equipment Automatic fire detection system
Automatic fire alarm system Emergency alarm system Emergency broadcasting facility
Other digestion facilities _ Connection water pipe facility
Other digestion facilities _ Connection sprinkling facilities
Other digestion facilities _ Emergency outlet facilities
Other fire fighting equipment _ Wireless communication auxiliary equipment Other digestion facilities _ Fire hydrants
Evacuation facility Affiliate ventilation
3.3 Selection of final parameters for predicting fire occurrence probability In most studies on fire prevention research and fire risk studies, fire risk is defined by fire frequency and fire intensity. The frequency of fire indicates the possibility of real fire, and the fire intensity means the degree of damage to life and property in case of fire. As a result, the fire risk is assessed together with the probability of occurrence and the scale of the damage caused by each fire. This is a somewhat different concept from the focus of this study, which is the disaster prevention. Once a fire occurs, it will involve considerable human and property damage, both large and small, and thus preventing fire is the most important goal. If we consider that predicting the probability of fire occurrence using our data and taking preventive activities according to this information are the most important works in disaster prevention, it can be understood that predicting fire occurrence probability of buildings is a prior task.
Thus, in order to develop a prediction model of fire occurrence probability, the variables were selected from the collected data and the pre - processing was performed on the variables.
First, we use the results of the preliminary statistical
analysis to see the ratio of the missing values (NA) of each variable and remove the variables with high NA value from the dataset. We then exclude the case where the building is an apartment. After the data removal process, the missing value of variables that are not excluded due to the low ratio of NA value are replaced with the value of NA with high ratio. We then proceeded to add new variables using existing variables. For example, there are only ground floor and basement data but the total number of floors, so we make it by adding ground floor and basement data. Besides, we convert the type of variables to fit the direction of analysis.
The fire occurrence probability prediction model is a classification prediction model using the data of the buildings where the fire occurred and the buildings that did not occur, using the variables of fire occurrence in the data. Therefore, we have performed preprocessing to convert metric variables into categorical variables.
Through this preprocessing, a data set consisting of a total of 16 variables including the occurrence of fire was finally created.
(Table 6) List of final variables for predicting fire occurrence probability
List of final variables for predicting fire occurrence probability : 16
Total number of floors number of Ground floor number of Underground floors
architectural style Building pillar form Building Roof Type Total area of the building
Building main use Number of fire facilities
Combustion expansion prevention (fire protection compartment)
Evacuation facility Fire extinguisher
Water-based extinguishing equipment _ Manual Automatic fire detection system Emergency broadcasting facility
Fire History
3.4 Configure training and test data sets The pre-processed finalized data set has about 7,000
Train Data Test Data
party 59.67% 61.19%
rpart 64.64% 62.15%
tree 58.10% 58.43%
buildings information, but 905 of them are data for buildings that were in fire. In order to match the size of the building data with the ratio of 1: 1, 905 cases of non-fire building data were extracted by random sampling. A total 1810 data was constructed for the prediction model development. The data set was then divided into training and test data sets at a ratio of 6: 4. In this case, the data of fire occurrence and non-occurrence building are maintained in 1: 1 ratio in the training and test data sets.
3.5 Development and prediction of fire probability model
As the prediction model of this study is a classification prediction model using fire and non-fire occurrence building data, it predicts and verifies fire occurrence probability using decision tree, SVM, Naive Bayesian and artificial neural network model.
All analyses were performed using a statistical analysis tool, R. In decision trees, three decision tree models such as the party package, the rpart package, and the tree package were developed and compared with each other. For SVM, we developed the kernel using SVM model of linear kernel and SVM model using RBF kernel. In this case, the cost values
were developed as 1, 10, 30, 60, and 100, respectively, and the accuracy of each model was compared. For the fire risk forecasting model using artificial neural network, the number of hidden layers is 2, 3, and 5, respectively.
3.5.1 Prediction Model of Fire Occurrence Using Artificial Neural Network An artificial neural network based fire probability prediction model was developed using nnet package in R.
The structure of this model is set to one hidden layer, and the number of hidden layer nodes is set to four, totaling 1/2n, n, 3/2n, and 2n when the number of input variables is n.
With these, four models were developed and compared. In the case of the nnet package in R, if the input variable is a categorical variable, the value of that category is generated as a variable number and viewed as an input node. Therefore, when generating an artificial neural network model using experimental data set consisting of categorical variables, the
category values of remaining 15 variables except a dependent variable, fire occurrence, are generated as one node resulting in a total of 106 initial input layer nodes. Based on this, the number of hidden layer nodes was structured as 53, 106, 159, and 212 respectively, and each model was set to 100 times repetition as learning stop condition.
(Table 7) Neural Networks Model Result No. of Node Train Data Test Data
53 96.13% 57.04%
106 96.13% 60.91%
159 96.13% 59.53%
212 96.13% 57.18%
As a result of experiment, the model with the highest prediction accuracy is one with the number of nodes set to 106. The accuracy is 96.13% in the training data set, 60.91%
in the verification data set, Respectively.
3.5.2 Prediction Model of Fire Occurrence Using Decision Trees
The decision tree model based fire prediction probability model was developed and tested by three decision tree model development packages provided by R.
The decision tree model package uses the party package, the rpart package and the tree package. The tree package creates the decision tree model using the binary iteration division methodology while the rpart package makes decision tree models using the classification and regression trees (CART) methodology.
The above two packages require optimization through pruning process, and the party package uses unused recursive partitioning based on permutation tests. This method has the advantage of not needing separate pruning.
(Table 8) Decision Model Result
Linear SVM
C Train Data Test Data
1 68.42% 63.54%
10 67.96% 62.71%
30 67.86% 62.57%
60 67.77% 62.43%
100 67.96% 62.57%
RBF SVM
gamma cost error dispersion
1 1 0.414356 0.037827
10 1 0.492678 0.036695
30 1 0.492678 0.036695
60 1 0.492678 0.036695
100 1 0.492678 0.036695
1 10 0.413447 0.023151
10 10 0.492678 0.036695
30 10 0.492678 0.036695
60 10 0.492678 0.036695
100 10 0.492678 0.036695
1 30 0.413447 0.023151
RBF SVM
gamma cost error dispersion
10 30 0.492678 0.036695
30 30 0.492678 0.036695
60 30 0.492678 0.036695
100 30 0.492678 0.036695
1 60 0.413447 0.023151
10 60 0.492678 0.036695
30 60 0.492678 0.036695
60 60 0.492678 0.036695
100 60 0.492678 0.036695
1 100 0.413447 0.023151
10 100 0.492678 0.036695
30 100 0.492678 0.036695
60 100 0.492678 0.036695
100 100 0.492678 0.036695
As a result of experiment for decision tree models developed by R, the model using rpart package showed the highest accuracy of about 64% in training data and 62% in test data.
3.5.3 Prediction Model of Fire Occurrence Using SVM
The SVM-based fire probability prediction model was developed using the linear kernel SVM model and the nonlinear RBF kernel SVM model. These two models have cost values of 1, 10, 30, 60, and 100, respectively. In the case of RBF SVM model, gamma value is also defined as 1, 10, 30, 60, and 100 as cost.
(Table 9) Linear SVM Model Result
For the linear SVM model, the model with the highest accuracy in the training data and the test data set was the SVM model with cost = 1. For the RBF SVM model, optimal cost and gamma values are calculated using the tune function to calculate the optimal cost of the SVM model.
(Table 10) RBF SVM Tune Result
As a result of calculating the tune function of the RBF SVM model, the optimal cost and gamma values are 10 and 1, and the results of creating the RBF SVM as the corresponding values are as follows.
(Table 11) RBF SVM Model Result RBF SVM
C gamma Train Data Test Data
10 1 96.13% 59.12%
The prediction accuracy of the linear SVM model was higher than that of the RBF SVM model. The prediction accuracy in the training and test data set was 68.42% and 63.54% respectively when the cost was 1 in the linear SVM model.
3.5.4 A prediction model of fire occurrence using Naive Bayesian Model
Since the Naïve Bayesian model does not require the adjustment value to be set when generating the model, only a single model of the fire probability prediction model has been developed. The results are as follows.
(Table 12) Nive Bayes Model Result Nive Bayes
Train Data Test Data
61.97% 63.26%
The fire prediction probability model developed using Naive Bayesian has accuracy of 61.97% in training data set and 63.26% in verification data set.
4. Conclusions
In this study, the probability of fire occurrence in buildings was estimated by using decision tree, SVM, artificial neural network, and Naive Bayesian model, which are typical data mining techniques.
(Table 13) Fire Risk Prediction Result
Model Train Data Test Data
Linear SVM 68.42% 63.54%
Nive Bayes 61.97% 63.26%
Decision Tree 64.64% 62.15%
Artificial neural
network 96.13% 60.91%
Since model development process and the values to be set for each data mining method are vary from model to model, decision trees, SVMs, artificial neural networks, and Naive Bayesian models were created using appropriate development methods for each model. And we compare the prediction results of the models with the highest accuracy among the models. In the case of the manufacturing facility, there was a result of 73% accuracy when the prediction was made using the artificial neural network. However, when the probability of fire occurrence was predicted using the artificial neural network for general buildings, the accuracy of the test data is about 60.91%. The model with the highest accuracy in predicting the fire occurrence probability of general buildings is 63.54% with the linear SVM model. In the training data, artificial neural network shows about 96%
accuracy and appeared as the best model, but it can be suspected that the overfitting problem occurs. However, since all of the prediction models exceed 60% of the accuracy of both training and test data, the prediction of the probability of occurrence of fire using data mining techniques is meaningful.
The purpose of this study is to propose a fire prediction probability prediction model for buildings which have not
been studied in Korea using various data mining techniques.
But it also has some limitations and problems. As this study emphasizes only the aspects of fire frequency, we should pay more attention to the fire than to judge that the fire risk is high because the fire probability is high. Thus, it should be interpreted with caution.
In addition, the linear SVM model is the most accurate among the various data mining techniques. However, in the case of the prediction using the RBF SVM, the accuracy of prediction in training data was 96.13%, and in test data was 59.12%. Therefore, the difference in accuracy between training data and test data was excessive, resulting in an overfitting.
In this study, only the development of the prediction model using the set values of the specific range of each model has been done. Therefore, further study may be needed to present a more optimal model than the present model through various setting values. Lastly, if future studies consider the damage of the people and the property, it is possible to predict more complex fire risk using both fire intensity and fire frequency.
Reference
[1] Ministry of Public Safety and Security ,”Analysis results of fire occurrence in 2015”,2016.
http://www.nfds.go.kr/sb2_bord_0005.jsf?p_surl=http%3 A%2F%2Fwww.nfds.go.kr%2Fsb2_bord_0001.jsf%3Ftp
%3Df%5E%5EiPage%3D2&iPage=&tp=f&docno=5337 5&pGubun=0&pSearch= >
[2] W. I. Choi, Y. S. Kim, D. W. Jang, G. H. Kim, Y. S.
Jung “A Study on Development of Fire Risk Prediction Model in Manufacturing Facilities Using Artificial Neural Network” Journal of Korean Society of Hazard Mitigation Vol. 17 No. 1 2017.02.
http://dx.doi.org/10.9798/KOSHAM.2017.17.1.161 [3] J. Y. Jang, H. J. Kim, S. K. Lee “A Study on
Development of Fire Risk Prediction Model” , Hansung University 2008.
http://prism.go.kr/homepage/entire/retrieveEntireDetail.d o;jsessionid=E5970982E059827F7FC6B8AAAE4FDAE 7.node02?cond_research_name=&cond_research_start_d ate=&cond_research_end_date=&research_id=1660000-2
00800012&pageIndex=2510&leftMenuLevel=160 [4] W. G. Kim, etc, “Assessment of fire risk index of
multi-use facilities, National Security Agency, 2009.08 [5] Jesse Roman, “Data driven information and the brave
new world of smart firefighing”, NFPA Journal, 2014.Dec.
https://www.nfpa.org/-/media/Files/News-and-Research/
Resources/Research-Foundation/Current-projects/Smart- FF/SmartFFNFPAJournalDataDriven.ashx?la=en [6] J. D. Shin, S. H. Jeong, M. S. Kim, H. J. Kim
“Analysis of Fire Risk with Building Use Type Using Statistical Data”, Journal of Korean Society of Hazard Mitigation Vol. 12 No. 4 2012.08.
http://dx.doi.org/10.9798/KOSHAM.2012.12.4.107 [7] H. C. Ahn, K. J. Kim, I. G. Han “Purchase Prediction
Model using the Support Vector Machine” Journal of Intelligence and Information Systems Vol. 11 No. 3 2005.12. http://hdl.handle.net/10203/22396
[8] Y. C. Kim, W. S. Yoo, Y. S. Shin “Application of Artificial Neural Networks to Prediction of Construction Safety Accidents” Journal of Korean Society of Hazard Mitigation Vol. 17 No. 1 2017.02. https://dx.
doi.org/10.9798/KOSHAM.2017.17.1.7
[9] D. Y. Kwon, Nasim Sobhani, S. Y. Park, J. S. Park, M.
Lee “Colorectal cancer recurrence prediction using artificial neural network" The Institute of Electronics and Information Engineers pp. 95-97 2017.11.
http://www.dbpia.co.kr/Article/NODE07276224 [10] S. H. Kwon, K. W. Park, B. H. Chang “A Comparison
of Predicting Movie Success between Artificial Neural Network and Decision Tree” Asia-pacific Journal of Multimedia Services Convergent with Art, Humanities, and Sociology Vol. 7 No. 4 pp. 593-601 2017.04.
http://dx.doi.org/10.14257/AJMAHS.2017.04.37 [11] W. I. Park, K. H. Kim, E. Han, S. M Park, I. S. Yun
“Study on the Characteristics of Bus Traffic Accidents
by Types Using the Decision Tree” Int. J. Highw. Eng Vol. 18 No. 5 pp. 105-115 2016.10.
http://dx.doi.org/10.7855/IJHE.2016.18.5.105
[12] D. W. Lee, J. H. Son, K. W. Gwon “An Analysis on the Prediction Factor of School-Violence: Focused on Datamining Decision Tree Model” Journal of Policy Evaluation & Management Vol. 26 No. 2 pp. 95-125 2016.
http://www.kapae.kr/bbs/board.php?bo_table=search_pap er&wr_id=1144
[13] H. S. Kang, Y. S. Lee, “Support Vector Machines-based classification of video data”. Korea Academy Industrial Cooperation Society Academic Conference Materials, pp. 482-485, Korea Academy Industrial Cooperation Society, 2014.11.
http://dx.doi.org/10.5762/KAIS.2015.16.1.652
[14] H. R. Jung, H. H. Kim, S. M. Park, E. Han, K. H. Kim, I. S. Yun “Prediction of Severities of Rental Car Traffic Accidents using Naive Bayes Big Data Classifier” J.
Korea Inst. Intell. Transp. Syst Vol. 16 No.4 pp.01-12 2017.08. http://dx.doi.org/10.12815/kits.2017.16.4.01 [15] Y. J. Ju, B. S. Kim, J. H. Shin, “Detection of Malicious
Code using Association Rule Mining and Naive Bayes classification” Journal of Korea Multimedia Society Vol. 20 No. 11 pp. 1759-1767 2017.11
http://dx.doi.org/10.9717/kmms.2017.20.11.1759 [16] M. J. Lim, J. P. Jung, M. G. Kim, “A Study on Sex
Classification of a Name using Naive Bayesian” The Journal of The Institute of Internet, Broadcasting and Communication Vol. 13 No. 6 2013.12.
http://dx.doi.org/10.7236/JIIBC.2013.13.6.155
[17] J. M. Choi, B. S. Lee, “eCRM Agent System for Articles Automatic Classification System based on Naive Bayesian Classifier” Journal of IKEEE Vol. 8 No. 2 pp. 216-223 2004.12.
http://www.dbpia.co.kr/Article/NODE07015300
◐ 저 자 소 개 ◑
홍 성 관
2015년 강원대학교 컴퓨터정보통신공학전공 졸업(학사) 2018년 국민대학교 비즈니스IT전문대학원 졸업(석사) 관심분야 : 텍스트 마이닝, 빅데이터 분석 및 활용 etc E-mail : [email protected]
정 승 렬
1985년 서강대학교 경제학과 졸업(학사)
1989년 미국 위스컨신 대학교 대학원 경영정보학과 졸업(석사) 1995년 미국 사우스케롤라이나 대학교 대학원 경영정보학과 졸업(박사) 1997년~현재 국민대학교 비즈니스IT전문대학원 교수
관심분야 : 텍스트 마이닝, 오피니언 마이닝, 빅데이터 분석, 정보시스템 구현, 프로세스 관리 etc.
E-mail : [email protected]