• 검색 결과가 없습니다.

A Study on Fatigue Crack Growth Model Considering High Mean Loading Effects Based on Structural Stress

N/A
N/A
Protected

Academic year: 2021

Share "A Study on Fatigue Crack Growth Model Considering High Mean Loading Effects Based on Structural Stress"

Copied!
6
0
0

로드 중.... (전체 텍스트 보기)

전체 글

(1)

1. Introduction

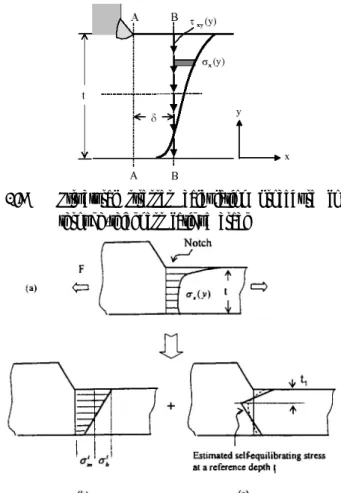
In nuclear power plant components and structures, almost all pressure boundary fatigue cracks can be initiated at welded joints. The mesh-insensitive structural stress procedure by Dong is modified to apply to the welded joints with local thickness variation and inignorable shear/normal stresses along local discontinuity surface. In order to make use of the structural stress based K solution for fatigue correlation of welded joints, a proper crack growth model needs to be identified.

By a recent review of a large amount of crack growth rate data collected from notched fracture mechanics specimens, there exist some significant † KOPEC, Structural Integrity & Material Dept.

E-mail : [email protected]

TEL : (031)289-4278 FAX : (031)289-3189 * KOPEC, Structural Integrity & Material Dept.

** Battelle, Center for Welded Structure Research

discrepancies in inferring the slope or crack growth exponent in the conventional Paris law regime.

Some of the discrepancies can be attributed to specimen types and notch geometries used in testing and some can be attributed to so-called short crack anomalous growth effects observed in highly controlled testing conditions.

Conceivably, all these factors may affect the stress intensity behavior when crack size is small at notch, which may in turn contribute to the anomalous growth behaviors observed. It is well recognized that crack closure arguments were successful in explaining the discrepancies and so-called anomalous growth phenomenon in some data and not so successful on others. In the two- stage crack growth model was not considered since its applications are focused upon the fatigue behavior in welded joints in which the load ratio effects are considered negligible. However, in highly controlled crack growth rate tests using

A Study on Fatigue Crack Growth Model Considering High Mean Loading Effects Based on Structural Stress

Jong-Sung Kim Cheol Kim

*

Tae-Eun Jin

*

and P. Dong

**

고평균하중을 고려한 구조응력 기반의 피로균열성장 모델에 관한 연구

김종성

김 철

*

진태은

*

P. Dong

**

Key Words : Mean Load(평균하중), Fatigue Crack Growth(피로균열성장), Welded Joint(용접연결), S-N Curve(S-N 선도), Structural Stress(구조응력), Stress Intensity Factor(응력확대계수)

Abstract

The mesh-insensitive structural stress procedure by Dong is modified to apply to the welded joints

with local thickness variation and inignorable shear/normal stresses along local discontinuity surface. In

order to make use of the structural stress based K solution for fatigue correlation of welded joints, a

proper crack growth model needs to be developed. There exist some significant discrepancies in

inferring the slope or crack growth exponent in the conventional Paris law regime. Two-stage crack

growth model was not considered since its applications are focused upon the fatigue behavior in

welded joints in which the load ratio effects are considered negligible. In this paper, a two-stage crack

growth law considering high mean loading is proposed and proven to be effective in unifying the

so-called anomalous short crack growth data.

(2)

typical fracture mechanics specimens without welds, the effect of R-ratio on crack growth rate have been investigated by many researchers [1,2]. It has been demonstrated that the effects of R become more pronounced when R becomes negative, particularly near the threshold regime.

In this paper, a two-stage crack growth law considering high mean loading is proposed and proven to be effective in unifying the so-called anomalous short crack growth data. Then, the effectiveness of the proposed two-stage growth law is demonstrated with some of well-known data.

2. Characterization of Far-field Stresses

As shown in Fig. 1, a typical through-thickness stress distribution at a notch root exhibits a monotonic through-thickness distribution with the peak stress occurring at the root of notch. It should be noted that in typical finite element based stress analysis, the stress values within some distance from the notch root can change significantly as different element sizes or element types are used in a finite element model, referred to as mesh-size sensitivity in those publications [3,4]. The corresponding statically equivalent structural stress distribution is illustrated in Fig. 2, in the form of a membrane component and bending component , consistent with elementary structural mechanics definition:

(1)

The super script signifies the definition of the structural stress is with respect to ligament length in Fig. 2(a) from the notch root. The normal structural stress is defined at a location of interest such as at Section A-A from the notch root as shown in Fig. 1. A second reference plane can be defined along Section B-B in Fig. 1, along which both local normal and shear stresses can be directly obtained from finite elements solution. The distance , represents the distance between Section

Fig. 1 Structural stresses calculation procedure for through-thickness fatigue crack

Fig. 2 Through-thickness structural stresses definition:

(a) Local stress from FE model at a notch (b) Equilibrium equivalent structural stress of far-field stress (c) Approximation of self-equilibrating stresses (notch stress) with respect to a reference depth

A-A and B-B (in local x direction) at the notch root. For convenience, a row of elements with same length of can be used in a finite element model. By imposing equilibrium conditions between Sections A-A and B-B, the structural stress components and must satisfy Eqs. (2) and (3), if there is no loading between Section A-A and B-B:

(2) (3)

The above two equations represent the line force

and line moment relationships per unit thickness in

(3)

z direction. Since the stresses along Section A-A are influenced by the singularity at the notch root, the integrals in Eqs. (2) and (3) are performed along B-B.

In the present procedure, the mesh-insensitivity of the structural stresses calculated is ensured if the stress states two planes (A-A and B-B) can be related to each other in an equilibrium sense. As a result, the mesh size at the notch area (A-A) can be rather large, e.g., only one or two elements for the entire ligament for most of the fracture specimens. Note that as becomes small (i.e.

element size becomes infinitesimally small), the shear term drops out from Eq. (4), as:

(4)

However, for notched geometries, Eq. (4) was proven to be effective [5] for calculating the far field or structural stress when shear locking is negligible in element formulations, such as using parabolic elements with reduced integration. Then, Eq. (4) becomes more convenient use than Eqs. (2) and (3)

3. Fatigue Crack Growth Model Using Far-field Stresses

3.1 Stress Intensity Factor Estimation

Most cases in analyzing welded joints belong to lap fillet weld similar to the notch configuration show in Fig. 1. The stress intensity factor represents only the far-field stress combination to the stress intensity factor as described by Eq. (5) for a single edge cracked specimen.

(5)

The and in the Eq. (5) are

(a) K versus - T joint

(b) Derivative K versus K

Fig. 3 Stress intensity changes as a function of crack size

dimensionless functions of relative crack size for the membrane and bending components of the far-field stress state, given in handbook such as [6]:

As discussed earlier, and signify far-field structural stress components that are defined with respect to the entire thickness. Once the structural stresses are available, the stress intensity factor can be readily calculated from the Eq. (5)

3.2 Fatigue Crack Growth Estimation

The notch-induced stress intensity behaviors can

(4)

be conveniently characterized by defining a notch- induced stress intensity magnification factor are:

(6)

In the Eq. (6), represents the total due to both the far-field stress and the local notch stress effects. The term represents only the far-field stress combination to the stress intensity factor.

Furthermore, the elevated in terms of dies out at a relative crack size of approximately

(see Fig. 3). It can then be postulated that the short crack growth process can be characterized by the two distinct stages of the behavior as a crack propagates from to

. Alone this line, it can be argued that two stages of stress intensity solutions in the form of the notch-stress dominated and far-field stress dominated can be separated to characterize the full range crack growth behavior from (small crack) to

(long crack). Here, the term refers the stress intensity factor range corresponding to remote stress range. It then follows:

(7)

Taking advantage of the definition of the stress intensity magnification factor in dimensionless form and assuming power-law forms for both

and , Eq. (7) can be

re-written as:

(8)

The terms and have been discussed in Eq. (6). The exponents and are to be determined based on crack growth data covering both typical short crack and long crack regimes.

(a)

(b)

Fig. 4 Stress range and stress ratio definition in cyclic loading

4. Fatigue Crack Growth Model Considering R Ratio

There are various empirical ways to modify either conventional Paris law or two-stage growth law in Eq. (8) for treating the R-ratio effects.

Recently, a parameter has gained an increasing popularity in fatigue research community [7,8], defined as:

(9)

refers the positive range of the stress intensity factor K corresponding th in Fig. 4 and corresponding to . As shown in Fig. 4, two situations need to be considered, depending upon the load ratio ( ) is positive or negative.

4.1 Positive Stress Ratio

If , Fig. 4 shows that = and

= . Again, for an edge crack

according to Eq. (5), it can be shown that:

(5)

(10) (11)

Substituting and in the above Eq.

(9), one obtains:

(12)

Note that represents the structural stress calculated with respect to . In view of the two-stage growth model in Eq. (8), the R-effects on the stress intensity factor range as described on Eq.

(12) can be included either in the first stage of the crack growth of the second stage of crack growth:

(13)

According to a detailed examination of the existing literature involved with a large amount of experimental data including both short crack and long crack growth, the effects of the loading ratio R is more dominant when a crack is very small, or dominated by the first stage of the crack growth governed by exponent in the present two-stage growth model Eq. (13). Indeed, this was also confirmed by this investigation. Therefore Eq. (13) will be used to incorporate the R ratio effects.

Note that as a function of remains the same as before. To validate the modified two-stage growth model as described in Eq. (5), a subset of data from Fig. 5 with different R ratio from Shin and Smith[**] were re-analyzed using Eq. (13), as shown in Fig. 6. The regression correlation parameter for the four sets of the data are noticeably improved ( versus ) once Eq. (13) is used, as shown in Fig. 5.

4.2 Negative R Ratio

If , it can be seen from Fig. 4 that

= and = . Then,

Fig. 5 Consolidated results of short crack growth data without high mean loading

Fig. 6 Validation of the modified two-stage crack growth model with high mean loading

Eq. (9) becomes:

(14)

With the identical procedure as section 3.2 above, the two stage crack growth model becomes:

(15)

Comparing Eq. (13) with Eq. (15), the load ratio R

effects on crack growth rate are much stronger if R

is negative than if R is positive.

(6)

5. Conclusion

The major findings are as follows:

(1) Although short crack anomalous crack growth phenomenon was clearly shown by Wire and Mill (2002) the two-stage crack growth law considering high mean loading has been proven to be capable of correlating both the short crack data with long crack data with a unified slope.

(2) A two-stage crack growth law considering high mean loading is proposed and proven to be effective in unifying the so-called anomalous short crack growth data with those for long cracks, resulting in the regression correlation parameter

=0.98

(3) The load ratio R effects on crack growth rate are much stronger if R is negative than if R is positive.

References

(1) Tanaka, K, and Nakai, Y., 1983, "Propagation and Non-Propagation of Short Fatigue Cracks at a Sharp Nothc," Fatigue of Engineering Materials and Structures, Vol. 6, No. 4, pp. 315-327.

(2) Shin, C.S., and Smith, R.A., 1988, "Fatigue Crack Growth at Stress Concentrations-the Role

of Notch Plasticity and Crack Closure,"

Engineering Fracture Mechanics, Vol. 29, No. 3, pp. 301-315.

(3) Dong, P., Hong, J.K. and Cao, Z., 2003,

"Stresses and Stress Intensities at Notches:

Anomalous Crack Growth," International Journal of Fatigue, Vol. 25, pp. 811-825.

(4) Dong, P. and Hong, J.K., 2004, "A Two-stage Crack Growth Model Incorporating Environmental Effects," ASME PVP, Vol. 482, pp. 104-113.

(5) Dong, P., Hong, J.K., Osage, D., and Prager, M., 2002, "Master S-N Curve Approach for Fatigue Evaluation of Welded Components," WRC Bulletin, No. 474, Welding Research Council, New York.

(6) Tada, H., Paris, P.C., and Irwin, G.R., 2000,

"The Stress Analysis of Cracks Handbook," The Third Edition, ASME, New York, NY10006.

(7) Sadananda, K and Vasudevan, A.K., 1997

"Short Crack growth Behavior," Fatigue and Fracture Mechanics: 27

th

Volume, ASTM STP 1296, R.S. Piascik, J.C. Newman, and N.E.

Dowling, eds, pp. 301-316.

(8) Kujawski, D., 2001, "A New ( )0.5

Driving Forve Parameter fo Crack Growth in

Aluminum Alloys," International Journal of

Fatigue, Vol. 23, pp. 733-740.

수치

Fig. 1 Structural stresses calculation procedure for  through-thickness fatigue crack
Fig. 3 Stress intensity changes as a function of  crack size
Fig. 4 Stress range and stress ratio definition in  cyclic loading
Fig. 6 Validation of the modified two-stage crack  growth model with high mean loading

참조

관련 문서