1. Introduction
Disruptions on network components in trans- portation systems, whether being accidental or intended, can cause severe socio-economic problems as well as operational degradation of
system performance (D’Este et al., 2003). As highlighted by the accident, Daegu subway fire in 2003, the consequences resulting from a network a failure were not limited to the operational halt of a single station. More importantly, it brought cascading failures, including the entire network’s malfunction, significant congestions to the other
* Instructor, Department of Geography, University of South Florida, [email protected]
Geographical Analysis on Network Reliability of Public Transportation Systems:
A Case Study of Subway Network System in Seoul
Hyun Kim*
대중 교통망의 네트워크 신뢰도에 관한 지리학적 분석 -서울시 지하철망을 대상으로-
김현*
Abstract:Failures on network components of a public transportation system can give rise to the severe degradation of entire system functionality. This paper aims at exploring how potential failures can affect the system flows and reliability of subway network systems in Metropolitan Seoul. To evaluate the range of impacts of disruptions, this research employs a probabilistic approach, network reliability. Network reliability measures the network resiliency and probability of flow loss under a variety of simulated disruptions of critical network components, transfer stations in subway system. By identifying the best and worst scenarios associated with geographical impact, as well as evaluating the criticality of transfer stations, this research presents some insights for protecting current subways systems.
Key Words : critical network infrastructure, subway network system, hub, network reliability, simulation based approach
요약:최근 지리학 및 교통 관련 분야에서는 교통 네크워크의 잠재적 손실이 지리 공간상에서 어떠한 영향을 주는가를 살피는 연구 가 중요한 주제로 등장하고 있다. 서울의 지하철망은 대규모의 도심 통행을 지지하는 중요한 기반시설이며, 특히 환승역은 그 기능을 상실할 경우 전체 교통망의 신뢰도에 큰 영향을 줄 수 있는 중요한 교통 입지시설이다. 이 논문은 지하철 환승역의 기능 손실이 지하 철망의 신뢰도과 대응력에 어떠한 영향을 주는지를 네트워크의 위상학적인 차원, 전체 지리 공간, 그리고 개별 환승역 차원에서 살펴 본다. 시뮬레이션을 통한 분석 결과, 서울 지하철망은 상당히 높은 수준의 네트워크 신뢰도를 보였으나 환승역 간에는 지리적으로 유 의미한 변이가 있음을 확인하였다.
주요어 : 중요기반시설, 지하철망, 허브, 네트워크 신뢰도, 시뮬레이션 접근법
transportation modes, and the potential social cost by hindering people’s interactions (Nicholson and Dalziell, 2003; Delfino et al., 2005). In particular, if the malfunction results from a tragic terror attack such as the Madrid train bombing (2004) and the London bombing (2005), protecting public transportation systems becomes a much more critical concern in terms of national security since it may cause tremendous economic costs for recovery (White House, 2003; Wrobel and Wrobel, 2009).
The main function of a network in urban transportation systems is to facilitate the flows of people and goods among a set of origins and destinations (O-D) across the network. In such transportation networks as airline networks, express delivery systems, and subway systems,
‘hub’ refers a special node where interacting flows among O-D pairs are switched or transshipped from one path to another to complete their journeys (O’Kelly, 1986; 2008). In particular, the importance of hubs in transportation systems has been highlighted as a significant operational as well as defense strategy as the efficiency of current transportation systems is extremely reliant upon these facilities (Moteff and Parfomak, 2004; Kim and O’Kelly, 2009).
As an urban public transportation mode, the subway system in Metropolitan Seoul is a critical network-based infrastructure as the system the serves more than two-third of passengers’ daily movements, including urban commuting. In a subway system, a ‘transfer station’ is recognized as hub because passengers’ movements are collected and re-routed via these facilities. One of the advantages of operating hubs in subway systems is that they can provide passengers with more alternative options to reach their destinations, although they might not be the shortest or least travel time paths. Note that more than a half of the subway passengers’ journeys are completed via these transfer stations (Lee et
al., 2007; SMRT, 2009; Seoul Metro, 2009), implying that any possible malfunction of these hubs would greatly impact system flows with severe delays for their interactions. Considering this situation, it is important to maintain current subway systems as reliable as possible against any disruptive events such as natural disasters, electric outage, or even intended attacks that would affect a part of the network (Lewis, 2006).
Clearly, the first impact resulting from such failure is inaccessibility to the transfer stations, followed by serious degradation of the entire network’s capability to transfer flows (NSTAC, 2003). Impact of negative events manifests differently with spatial variation of vulnerability since there should exist a geographical inequality according to locations of transfer stations, spatial organizations of the network, and flow distributions on the network. Thus, exploring the impact and resiliency of networks to respond to various levels of possible disruptions has been an important research topic in geography and other fields such as mathematics, computer science and operations research.
In recent years, various methodologies have been developed to measure the impact of the possible damage on node and links within networks. The main focus of all these efforts is to assess network vulnerabilities. For example, survivability measures focus more on the minimum number of connectivity of links that can lead to total malfunction of the entire networks (Grubesic et al., 2003; Fortz and Labbé, 2006). As a probabilistic approach, reliability theory is employed to examine the resiliency of networks to the potential links or nodal failures (O’Kelly and Kim, 2007; Lam et al., 2007).
Applying mathematical models to identify availability of critical facilities in a given network is another popular approach (Synder and Daskin, 2007; Matisziw and Murray, 2009).
It is common that these applications are
targeted to network-based infrastructures such as road network systems, electric power systems, and hubs in telecommunications networks (see Murray and Grubesic 2007 in detail). However, there is little work found to examine the vulnerability of subway systems due to unavailability of data (for instance, O-D flows) and its complexity in topological structures. In a broad sense, analyzing network accessibility of network systems would fall under critical infrastructure studies (Lee and Lee, 1998; Huh and Kim, 2003). One of the challenging issues in network vulnerability research is that the methodologies should take into account unique characteristics of the network and reflect geographical properties in the model (Murray et al., 2007; Kim and O’Kelly, 2009). For example, in the current Internet, peering arrangement at hubs among Internet backbone providers is crucial to analyzing the system reliability. In subway system, as well documented in previous literature (Pas and Koppleman, 1987; Huh, 1991;
Park and Lee, 2007), passengers’ travel behavior in subway networks is an important factor, which can influence the criticality of transfer stations.
Thus, the geographical pattern of O-D flows should be considered in vulnerability measures.
Further, exploring the vulnerability of networks according to changes in travel behaviors can improve preparedness for the emergency system and people’s responses to find alternative paths.
In this context, this research aims at exploring how potential failures on transfer station(s) can affect system flows and network reliability based on subway network systems in Metropolitan Seoul. Of interest in this paper is to analyze the criticality of each hub (i.e. transfer station) in terms of system flow loss and network reliability.
Geographical variations of network reliabilities for selected disruption scenarios are also examined using a geographical perspective. Several contributions are made in this paper. First,
network reliability measures addressed in the paper are conceived to reflect a geographical properties’ flow distribution (i.e. O-D flows) among subway transfer stations. Second, an efficient algorithm to compute network reliability is developed. A conceptual framework to analyze the simulation results, reliability envelope is also introduced. The remainder of this paper is organized as follows. A brief overview of approaches to critical infrastructure research is provided in the next section, including a detail of network reliability measures. Section 3 presents analytical frameworks which are applied in the analysis. Section 4 presents application results followed by the implications and concluding remarks on the final section.
2. Background
1) Approaches for network vulnerability studies
The main issue raised in network vulnerability studies can be summarized in two questions: (1) what would be the outcome of a network in the face of unexpected disruptions? and (2) what measures are effective to uncover network vulnerabilities for given networks considering its characteristics? In general, to tackle these questions, different types of approaches and methodologies are considered. As summarized in Table 1, a strategy-based approach is focused on exploring the criticality of a network structure by strategically removing some targeted network components (nodes or arcs). The basic assumption behind of this approach is that the negative impact on the network would come from the different topological structures and the types of attacks (i.e. random or targeted disruption). Thus, the capability of network
structure to withstand the negative impacts is of interest, and the network performance is generally compared with the before/after settings in terms of the network tolerance. For large instances, statistical physics measures are employed (Baran, 1964; Callaway et al., 2000;
Albert et al., 2000; Pastor-Satorras and Vespignani, 2004).
Second, a simulation-based approach considers the range of possible impacts which can influence the performance of entire network systems. Of concern is to examine the resiliency of networks to a series of failures on the network disruptions. Based on enumerated possible cases, a network’s performance is defined as the best and worst scenarios, and its resiliency is tested by increasing the level of disruptions. In particular, this approach is very useful when drawing plausible scenarios that are the most important, as
it aims to find crucial components (i.e. node, hub, and links) to be protected from a planning perspective. Due to the simple analytical nature, various deterministic measures such as graph- theoretic indexes, connectivity, and probabilistic methods (reliability/survivability) are frequently employed according to the characteristics of the problem. However, the challenging issue in this approach is that most simulation plans often require intensive computing.
Finally, a network design approach is regarded as a more preventive approach when it is compared with the former approaches. It assumes the networks’ performance can be optimized in order to minimize the negative impacts, or the ideal network form for survivable from the network failures can be designed. Under this assumption, this approach aims at finding the optimal solutions to construct robust networks
Table 1. Approaches in vulnerability studies of critical infrastructure
Types of approach Interests Methodology Representative works
Strategy-based · Structural resiliency · Graph theory · Baran (1964) approach · Network tolerance · Statistical physics · Callaway et al. (2000)
· Strategy to protect · Probability theory · Albert et al. (2000; 2002)
networks · Cohen et al. (2001)
· Grubesic et al. (2003)
· Pastor-Satorras and Vespignani (2004)
· Lee et al. (2008) Simulation-based · Plausible scenarios · Deterministic measures : · Gorman et al. (2004) approach · Network resiliency connectivity, accessibility · Grubesic et al. (2008)
· Preparedness in · Graph theory-based index · O’Kelly et al. (2006) planning · Probabilistic graph theory: · O’Kelly and Kim (2007)
survivability/reliability · Matisziw et al. (2009a) Design-based · Less-disruptive network · Spatial optimization · Wood (1993)
approach structure techniques · Ball et al. (1989)
· Back-up network design · Probabilistic graph theory · Church et al. (2004) and facility location · Mathematical programming · Snyder and Daskin (2007)
· Chen et al. (2007)
· Murray et al. (2007)
· Matisziw and Murray (2009)
· Kim and O’Kelly (2009)
under given constraints. Many optimization models using mathematical programming are addressed. Such topics as finding critical paths, fortifying network structure from possible facility removal, and designing a hub network to minimize the system flow loss are of this category (Wood, 1993; Church et al., 2004; Kim and O’Kelly, 2009; Matisziw and Murray, 2009). In general, this approach is very practical in that it can provide a snapshot for optimized network systems for planning purposes. However, the complexity of the problems is often problematic to find optimal solution. Thus, developing efficient heuristic algorithms is entailed if the model suffers from finding exact solutions or meeting optimality conditions. Among these approaches, this paper uses a probabilistic measure, network reliability, to evaluate subway network systems on the basis of the disruption of transfer stations.
2) Network reliability measures
In general, the interpretation of network reliability is open but can be broadly defined as a network’s capability to deliver flows or availability of paths between pairs of nodes in the network. In transportation systems, reliability refers to the probability of successful delivery of origin-destination flows without delay or loss in the network (Bell and Iida, 1997). For example, if reliability between i and j (hereafter Rij) is computed as 0.98, it indicates 98% of the traffic flows is expected to be delivered from i to j without encountering any delay or flow loss (Medhi, 1999). Note that this theory assumes that the operational probability of a link is empirically known or simply given as parameter. In general, it is known that reliability of a path is a function of physical distance or the number of links which consists of that path (AT&T, 2005).
Mathematically, the computation of network
reliability Rijfor i-j pair is as follows.
Rij(G, p)= p{Dk} (1)
Where
Rij(G, p): the reliability between origin i and destination j on the network G where probability p is calculated for a disjoint path Dk.
p{Dk}: the probability of the disjoint events Dk
(k=1 to n) which is calculated from the enumerated paths k between i and j.
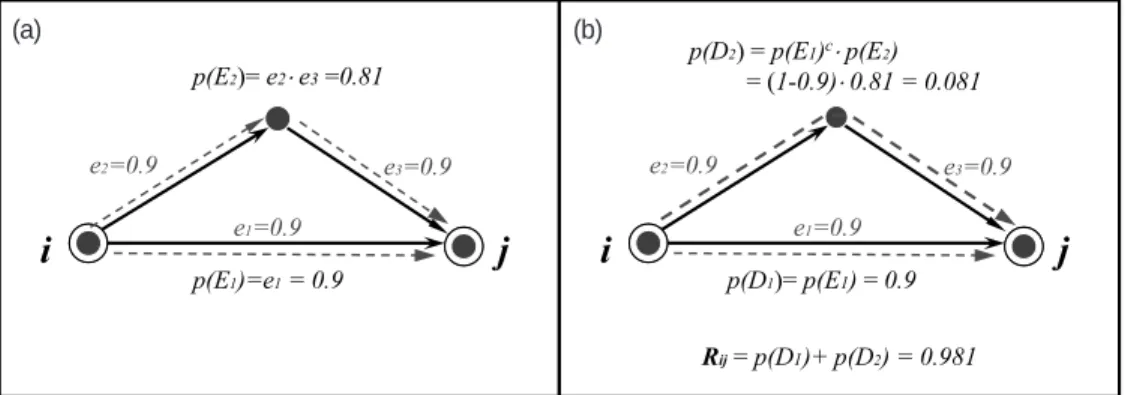
As exemplified in Figure 1, in the first step, the calculation of Rij is to find the set Sij where all paths Ekconnecting i and j are identified (E1, E2
in Figure 1 (a)), and each path’s reliability is computed as p(E1)=0.9 and p(E2)=0.81, respectively. In this phase, the reliability of each path Ek should be computed by multiplying the operational probabilities of each links (ek), which constitute each path. For example, the reliability of a path E2is calculated by multiplying two link probabilitie, (i.e. 0.81=0.9×0.9). In general, the probability of ek is arbitrarily given (e.g. 0.9) in the literatures but some empirical parameter can be used if it can be estimated or known. The second step is to generate disjoint probabilities Dk
from p(Ek). As shown in Figure 1 (b), the probability of each Dk is calculated using the logic of Boolean Algebra (BA), which is the rule of complement set theory (for example, p(E1)cin Figure 1 (b)). The fundamental property of the BA is to make all paths Ekmutually independent.
Thus, summing up disjoint events probabilities p{Dk} produces the probability of deliverability of flows for i-j pair throughout all enumerated paths simultaneously (see Dotson and Gobien, 1979;
O’Kelly et al., 2006 for the details).
Not surprisingly, the more routes are ensured, the better reliability is generally expected. From this basic computation, the average network
∑n k=1
reliability (AVRsys) from origin i to all the other destinations j can be extended as below.
AVRsys= Rij (2)
Where
AVRsys: the average reliability from i to destinations j (i≠j) on the network G.
nC2: the total number of i-j pairs
Note that original reliability measures, (1) and (2), reflect only the topological structures. Now, these basic measures can be extended to reflect geographical properties. If we want to reflect and calculate the total amount of flows among the ODs to be delivered on the network, the equation (2) is extended by adding the term Wij, the amount of flow to be delivered for i-j pair, in the formulation as below (Kim and O’Kelly, 2009).
TFLOWsys= WijRij (3)
Where
TFLOWsys: the total amount of O-D flows to be delivered among i-j pairs on the network G.
Wij: the amount of flows to be delivered for i-j pair.
For measuring the system flow loss, we can newly define the loss probability p{Lij}, which is simply the complement probability of Rij (i.e.
p{Lij}=1-Rij), and then the expected system flow loss Lsysis expressed as follows.
Lsys= Wijp{Lij} (4)
Where
Lsys: the amount of expected flow loss for all i-j pairs on the network G.
p{Lij}: the loss probability, the complement probability of Rij.
If we define L´ as the amount of the expected flow loss when nodes are disrupted from the original network G, the nodal removal impact to the network system flow (LFLOW) is simply measured by calculating the gap (L-L´). In the section 4, a series of measures addressed above, R, AVR, TFLOW and LFLOW will be used to examinee network vulnerability.
∑n (ij=1≠j)
∑n i=1
∑n (ij=1≠j)
1
nC2
∑n (ij=1≠j)
1
nC2
Figure 1. Reliability computation (a) (b)
3. Application details and data
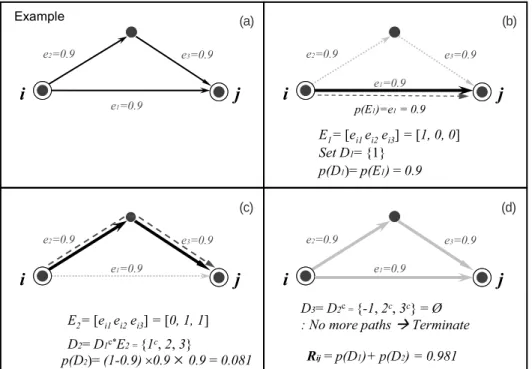
1) Boolean-algebra based Algorithm
For a large network involved, computing network reliability becomes difficult task due to the complexity for enumerating paths available between nodes. While there are a couple of ways to tackle the procedure, algorithmic approach based on the BA has been well used to solve this problem due to its efficiency to search paths. As shown in Figure 1, the BA approach performs well to compute the exact reliability due to its mathematical soundness (Shier, 1991). However, enumerating paths within a reasonable time is a challenge. Further, generating disjoint events from identified paths is often a concern (Colbourn, 1987; Wakabayashi and Iida, 1992).
For this reason, an efficient algorithm is generally
required, which can calculate the exact value of reliability. This paper develops an efficient BA algorithm based on implicit enumeration, which is known as the exact solution method for a large network. The basic logic of the algorithm is illustrated in Figure 2.
To a given network, the first step (Figure 2 (b)) is to find the shortest path between i and j pair and record this event with a set of vector. The next is to identify other disjoint events Dk by comparing the set of vectors of previous path with other kthpath sets (Figure 2 (c)). The disjoint relationship can be examined effectively by employing implicit enumeration, and the BA operation is continued until no more complement sets are found (Figure 2 (c) and (d)). Note that the operational probability of each link (ek) is given as parameter (=0.9), which is generally accepted by model if empirical probability is not available (Yoo and Deo, 1988).1)In this research,
Figure 2. Reliability computation using BA-based algorithm
(a) (b)
(c) (d)
the BA-based algorithm and all of the measures were coded with FORTRAN and ArcGIS 9.3. The analysis was carried out on a XP server with Intel Core2 Duo 2.66 GHz processor and 3.25 GB RAM.
2) Data
To measure network reliability, two data, 1) the matrix representing topology of the subway networks and 2) the O-D flow matrix for the set of nodes on the network, are prepared. In this research, a total of 53 hubs’ transfer stations and two inter-nodes (i.e. ‘Yeouido’ and ‘Kimpo- Airport’) in the subway system in Seoul are considered.2)Two inter-nodes are selected for the analytical purpose for network reliability at individual level (see section 4-3). Note that it is very difficult to figure out an exact volume of O- D traffics among stations, particularly in subway systems. Although there are various types of
estimation methods, this research uses a simple location-allocation model to generate an estimated O-D flow matrix. The method relaxes O-D flows by considering the volume of the in- bound/out-bound flows of each station (Taaffe et al., 1996). The daily volume of transfer passengers as of 2007 is used (Seoul Metropolitan Government, 2002; www.smrt.co.kr;
www.seoulmetro.co.kr).3) Figure 3 illustrates the subway line networks and the locations of transfer stations used in the paper, and the geographical pattern of the volume of transfer flows at each station.
3) Resiliency of hubs in subway systems
Compared with other ground transportation systems, subway networks can be regarded as a multiple layers system where planar and non- planar networks are mixed. As illustrated in the inset of Figure 3, each subway line is a planar
Figure 3. Subway networks in Seoul and geographical distribution of flows at transfer stations.
type network but the entire subway system looks like a non-planar type network when they are overlaid. However, notice that the subway system becomes a mixed system due to transfer stations because they allow the passengers to switch their routes. In topological structure, inter-link arrangements among subway lines at each transfer station (for example, the inter-link between subway line 2 and 4 at Sadang station) are specifically modeled as a set of sub-networks in connectivity matrix. Note that the inter-links arrangements at hubs enhance the resilience of a network system.
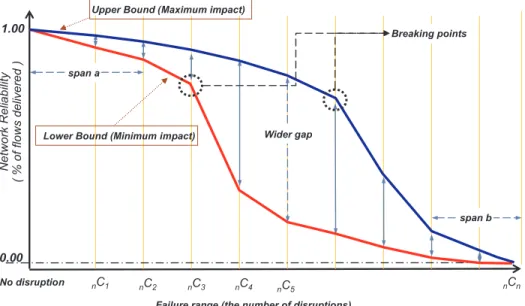
In simulation-based approach, it is necessary to draw plausible scenarios with a different level of network disruptions. Reliability envelope illustrated in Figure 4 is a conceptual tool to examine the network resiliency with increase of network failures (Kim and O’Kelly, 2004). In the diagram, Y-axis represents the network reliability or the percentage of flows on the networks, which are not indicted by network disruption. X- axis shows the stages with the level of
disruptions.
In reliability envelope, three analytical points can be stressed for our simulation. First, for many possible instances according to all (or partially selected) combinations of nodal removal on the given network, the impact ranges from the least and the greatest negative impact. Two bounds, the upper and lower bounds, indicate the best and worst scenarios for a certain level of hub(s) failure, respectively. Interpretation can be given by looking over the gap between them and the shape of the envelope. The narrow gap between upper and lower bound with high reliability at specific failure level (span a) means that the network is very stable across various possible scenarios. In contrast, the narrow gap with low reliability (span b) indicates that nearly most of the network nodes are under malfunction. Thus, the higher lower bound and the narrow gap along the increase of disruptions would be the best scenario for network resiliency. Second, note that the stages with a very wide gap between the upper and lower bounds may indicate that the
Figure 4. Reliability envelope
network is resilient to random failures in most scenario cases but is susceptible for some target disruptions. Finally, if a breaking point is found in either the upper or the lower bound (circles in Figure 4), it implies that there exists a particular hubs set, which can bring severe network malfunction when they are damaged together.
4. Empirical analysis
1) Network reliability of subway system in Seoul
The first analysis is focused on evaluating network reliability at individual transfer station in terms of average reliability measure (AVR). We begin to measure the AVR under normal condition that no disruptions are assumed at all transfer stations. Based on the computation, the average system reliability (AVRsys) for all 2,970 i-j pairs (54×55) is 0.98235, which implies that traffic flows among 55 transfer stations are expected to be delivered successfully without delay with a 0.9823 probability. The highest reliabilities (AVR > 0.999 (99.9%)) are found in 5 i-j pairs, Dongdaemun Stadium - Wangsimni, Dongdaemun Stadium - Seoul National University of Education, Sindorim - Wangsimni, Sindorim - Seokgye, and Singil - Seokgye, while the lowest reliable i-j pair is Kimpo-Airport - Gandong, which is the farthest pair in the network with low connectivity.
Recall that the important condition to get a higher reliability is related to how many disjoint paths are identified in i-j pair. According to the nature of network reliability in computation, geographical closeness would be a sufficient condition, rather than a necessary condition itself.
For example, if only one path is available (i.e. no alternative routes) between two nodes, it might
not be reliable although the linked node is its neighborhood. However, as provided in Table 2, geographical location of station appears to influence the reliability of other stations. Given the AVR rankings of the top and bottom 15 transfer stations, the most highly ranked stations are centrally located but the low-ranked ones are in the outskirts of Seoul.
Two observations need to be noted. First, topologically, the result implies that the current subway network in Seoul is a well structured system since a very small geographical difference among most of transfer stations are observed in terms of AVR. In detail, over 72% of transfer stations (40 out of 55 stations) present the higher AVR than the entire system reliability (AVRsys). In contrast, only three stations (Geumjeong, Kimpo- Airport, and Gangdong) are identified as relatively the lower reliability (AVR < 0.90).
Second, as mentioned, the AVR is an important measure to see the nodal criticality in terms of topological structure. However, criticality can be evaluated by taking into account of the pattern of O-D flows among transfer stations. As summarized in TFLOW in Table 2, there are some changes in the rankings. Interestingly, such highly reliable stations as Euljiro4-ga (2nd), Chungjeongro (3rd), and Seokgye (4th) in AVR ranking are evaluated less-critical as the amount of O-D flow is embedded in the measure. Note that Sindorim, Chungmuro, Yeouido, Guro and Cheonho, which are relatively ranked low against their AVR ranking, are identified as very critical transfer station in terms of TFLOW ranking, highlighting their vital role in transferring passengers’ movements on the subway system.
Another implication of the result is that geographical variance on the space would influence nodal criticality which might not be captured just based on topology of the network.
2) Geographical impacts of nodal disruptions: entire network
Another venue to evaluate nodal criticality is to apply potential disruption scenarios and look into
the sensitivity of network reliabilities and traffic loss rate for each station. For example, if a highly reliable node is expected to cause just a minor impact of system flow loss, then such node cannot be regarded as a critical node. In contrast, Table 2. Reliability ranking for the top and bottom 15 transfer stations
(a) The top 15 transfer stations
Rank Transfer station AVR TFLOW*
1 Jongro3-ga 0.990928 231,832 (3)**
2 Euljiro4-ga 0.990920 32,048 (34)
3 Chungjeongro 0.990891 29,933 (35)
4 Seokgye 0.990887 29,456 (36)
5 City Hall 0.990881 82,946 (18)
6 Dongdaemun 0.990810 76,561 (21)
7 Euljiro3-ga 0.990805 88,141 (17)
8 Dongdaemun Stadium 0.990801 286,215 (2)
9 Sindang 0.990793 52,787 (29)
10 Dongmyo 0.990768 55,588 (26)
11 Sindorim 0.990756 320,165 (1)
12 Wangsimni 0.990752 99,565 (13)
13 Hapjeong 0.990730 103,799 (12)
14 Cheonggu 0.990712 15,185 (52)
15 Chungmuro 0.990687 166,500 (6)
(b) The bottom 15 transfer stations
Rank Transfer station AVR TFLOW*
41 Yeouido 0.981916 57,845 (25)
42 Kkachisan 0.981728 53,282 (28)
43 Eungam 0.981369 26,394 (41)
44 Guro 0.981328 69,847 (22)
45 Cheonho 0.981315 77,971 (19)
46 Bulgwang 0.981131 19,512 (49)
47 Gasan Digital Complex 0.981092 46,084 (30)
48 Dobongsan 0.980082 18,359 (50)
49 Yeonsinnae 0.972835 27,641 (40)
50 Suseo 0.972630 27,873 (38)
51 Onsu 0.972417 13,770 (53)
52 Bokjeong 0.972222 9,598 (54)
53 Geumjeong 0.894339 21,885 (45)
54 Kimpo Airport 0.889666 19,686 (48)
55 Gangdong 0.888137 28,040 (37)
Note: * TFLOW: Total amount of O-D flows expected to be delivered from a station (i) to other stations (j).
** The number in parenthesis indicates the rankings based on TFLOW.
a node with low level of reliability in normal condition but brings a significant traffic loss in a disruption scenario, then it would be the critical node to be protected. Based upon the measures introduced in section 2.2, two indexes, AVRgap
and LFLOWgap are used. AVRgapcalculates the degradation rate of system reliability between the AVR at normal condition and the AVR to the disruptions of a specific node. LFLOWgappresents the rate of degradation in terms of system flow losses (L-L´) between before/after disruption of a node. For instance, the ‘-1% of AVRgap to the disruption of station A’ is translated as the 1% of system reliability is expected to be degraded.
Likewise, the ‘-8%’ of LFLOWgap indicates 8% of system O-D flows will be lost due to the failure of node A.
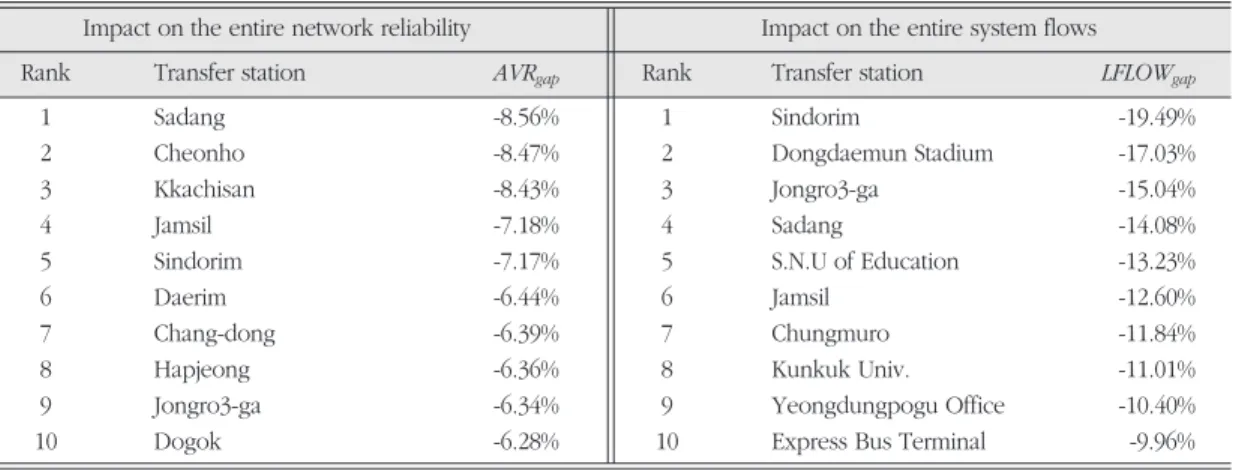
The top 10 transfer stations are reported in terms of both criteria in Table 3. It should be noted that the results may vary based on the data input, especially the estimation O-D flows, because the computation is highly dependent on the structure of O-D flow matrix and the network topology. As presented, ‘Sadang’ station is identified as the critical hub which would give the greatest impact on the entire network reliability. Interestingly, Cheonho and Kkachisan,
both of which were low-ranked in terms of AVR from Table 2, are regarded as important nodes on the networks. Considering O-D flows of the entire system, ‘Sindorim’ is the most critical transfer station, causing the greatest impact on passengers’ flows. The result also implies that the stations, highly ranked in both criteria, would be the most important nodes in network management.
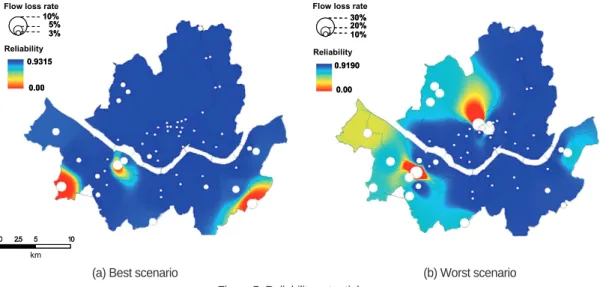
From a different analytical perspective, the best and worst case scenarios would be identified among the particular set of disruptions of transfer stations. The reliability potential map in Figure 5 illustrates the best and worst disruption scenarios of the geographic impact on network flows for three nodal disruptions. The blue area represents the area with higher reliability, while the red indicates the lower reliable area. In the case of the best scenario (Figure 5 (a)), the impacts of three nodal disruptions on network reliability cover only some local areas while the area impacted area is much larger in the worst scenario (Figure 5 (b)). The network reliability in the eastern part of Seoul is much reliable compared with the west, indicating that the subway system of the east area is much well structured in maintaining its entire network
Table 3. Nodal criticality ranking for network reliability (AVR) and system flows
Impact on the entire network reliability Impact on the entire system flows
Rank Transfer station AVRgap Rank Transfer station LFLOWgap
1 Sadang -8.56% 1 Sindorim -19.49%
2 Cheonho -8.47% 2 Dongdaemun Stadium -17.03%
3 Kkachisan -8.43% 3 Jongro3-ga -15.04%
4 Jamsil -7.18% 4 Sadang -14.08%
5 Sindorim -7.17% 5 S.N.U of Education -13.23%
6 Daerim -6.44% 6 Jamsil -12.60%
7 Chang-dong -6.39% 7 Chungmuro -11.84%
8 Hapjeong -6.36% 8 Kunkuk Univ. -11.01%
9 Jongro3-ga -6.34% 9 Yeongdungpogu Office -10.40%
10 Dogok -6.28% 10 Express Bus Terminal -9.96%
reliability. In terms of system flow loss rate, the geographical impact is highly dependent on the geographical pattern of flows. Intuitively, the criticality of a node in subway network may be a function of the amount of flows which pass or transfer at stations. Based on the result in Figure 5 (b), the worst case scenario may look critical, especially of the central area of Seoul. However, note that only 0.3% of scenarios out of the total of 26,235 combinatoric nodal disruption scenarios (55C3=26,235) would cause these worst events.
From a geographical perspective, more evenly distributed flows in a given space, whether it is archived with the help of other ground transport- ation modes or topological intensification for ensuring more routes, can improve network resiliency and keep a better tolerance level to the negative impacts from potential network failures.
3) Geographical impacts of nodal
disruptions at individual transfer stations At the individual level, disruption(s) of other
stations influences a particular station’s capability to distribute its O-D flows. In this context, it is important to see how a transfer station’s network reliability is impacted and how its system flow to be delivered varies as other stations fail. Based on the results in Table 2, three contrasting stations are selected for simulation: Jongro3-ga, Yeouido, and Kimpo-Airport. Station Jongro3-ga performed as one of the most reliable transfer stations and presented the highest degree of nodes (dn=6).
The second example, station Yeouido, is one of the busiest stations for daily commuting (Park and Lee, 2007) but is only connected with two linkages (dn=2). The last case, Kimpo-Airport, is chosen among the least reliable station group (AVR < 0.90 in Table 2).
As discussed, it is impossible for a station to avoid performance degradation with increases in other stations’ failures, thus, comparing resiliencies for 3 cases is our concern at individual level analysis. The simulation is conducted from the stage of no disruption to the stage of 15 other station’s nodal failures. To (a) Best scenario (b) Worst scenario
Figure 5. Reliability potential maps
In this paper, the flow loss rate is used to represent the degree of impact, instead of the actual amount of flows loss at each station.
Figure 6. Comparison of resiliencies for selected stations
(a) Jongro3-ga (network reliability) (b) Jongro3-ga (system flow)
(c) Yeouido (network reliability) (d) Yeouido (system flow)
(e) Kimpo Airport (network reliability) (f) Kimpo Airport (system flow)
explore the resiliencies, reliability envelopes are made to depict the variation of network reliabilities as well as the expected amount of flows which can be distributed from the origin station to other destinations. As shown in Figure 6, the Jongro3-ga station shows a very strong resiliency in the best scenario, also keeps the high lower bound until losing its connectivity to other nodes (i.e. the dn becomes 0). Note that keeping a narrow gap between the upper and lower bounds implies strong nodal reliability as well as resiliency. In contrast, the reliabilities of Yeouido station and Kimpo-Airport station (Figure 6 (c) and (e)) are significantly degraded as other stations’ failures increase. For example, the AVR of the Yeouido station is well kept by 6th stage at over 0.80, but at the 15thstage the AVR is degraded below 0.50. In terms of system flows, as shown in Figure 6 (d) and (f), observed break points at the 12thand 2ndin the envelope of each station’s upper bound indicate that abrupt system flow loss can occur for particular sets of transfer station disruptions.
Different resiliency among the three stations can be explained using a geographical perspective. First of all, the capability, ensuring alternative routes to face the loss of nodes on the network, determines the nodal resiliency of each station, and this resiliency is influenced by their geographical locations on the network. In our example, the Jongro3-ga station may enjoy its greater comparative advantage in location by placing it in the central part of the subway system in Seoul. Such a location may provide more connections to other highly reliable nodes (for example, Euljiro3-ga and 4-ga), which can improve its overall reliability. In contrast, stations located in peripheral areas, like Kimpo-Airport, have a tendency of low connectivity, which can result in a susceptible condition once malfunctions occur at nearby stations.
5. Conclusions
A subway system in Metropolitan Seoul is regarded as a crucial network system, serving a mass of people’s daily movements. In particular, transfer stations are critical assets to be protected from any disruptions due to their vital role in transferring flows among origins and destinations.
From a geographic perspective, exploring network reliability of subway systems is important since it can provide valuable information for a better preparedness in terms of network protection.
This study highlights several important findings.
First, according to the results presented in the paper, the subway network system in Seoul maintains strong network reliability under normal condition. The reliability potential maps document very small geographical variation of reliabilities across Seoul and show that the current subway network system is densely structured. Second, the criticality of hubs (i.e.
transfer stations) can be clearly captured when such geographical properties as the geographical pattern of O-D flows are used in the analysis.
While single disruption may not be a significant impact on the entire system flow, it is also possible that a severe interruption of system flow may occur for some areas to a particular set of transfer station failures. Third, actual network resiliency of the current subway system in Seoul may be better than the simulation results, since the network used in the simulation only considers eight subway lines. As more subway lines are added, the increased routes will enhance reliabilities among subway stations.
Finally, network reliability at an individual station is highly dependent upon its connectivity level, as well as the reliabilities of adjacent nodes. This is because a better connectivity with other nodes could ensure more alternative routes to reach
destinations. In addition, as shown in Jongro3- ga’s case, a node’s resiliency can be improved if it is connected with highly reliable nodes as neighbors. In summary, network reliability and resiliencies of nodes to possible failures are influenced by several factors, such as topological structure, geographical pattern of flows, and their spatial associations on the network.
Given that the paper focuses on evaluating network reliability, further research could be extended by considering other variables in the analysis. First of all, the simulation can be more realistic by taking into account other factors such as travel time, station capacity, schedule of operation, and interconnections with other transportation modes. Second, more accurate network reliability measure can be achieved by reflecting empirical link reliability. The reliability measures addressed in this paper basically assume that the operational probability of each linkage is equal and constant. Third, this research only considers 55 stations within Seoul to explore network reliability. In reality, however, current subway system is not a closed system so that spatial analysis can be extended to the entire metropolitan area. If other transfer stations in the metropolitan area are considered, different network reliability can be observed with a more detailed reliability potential map. Due to the less- dense connectivity of stations and the population in suburb regions, a geographical differentiation in reliability can be identified. Finally, the model should be more sophisticated by considering the geographical variance of O-D flows with different times. Clearly, travel patterns (or behaviors) of people using the subway networks are significantly different between morning, afternoon, and evening. It is highly probable that the criticality of nodes with varies to the span of time. For instance, the criticality of ‘Yeouido’
would be the highest in early morning because a large volume of inter - and intra - urban
commuting happens at this time. In this context, analysis of each station’s criticality based upon different times can provide subway passengers with important information for their efficient routings in the face of a disruptive event. In addition, the impact of a new subway line can be evaluated from a perspective of network management and planning. For example, how would the subway line 9 improve the entire network system, and what stations will benefit from that new line? What is the optimal place to establish a new transfer station to enhance network resiliency? Answers to these questions can give better insights for constructing more robust and efficient subway network system.
Notes
1) In our performance tests, the BA algorithm employed in the paper performs well in identifying the exact reliability value due to the algorithmic soundness of implicit enumeration. However, it is necessary to develop a better paths-searching strategy to reduce the computation time for a large and complicated network. To ensure the exact value to given large instance, a sufficient memory to support intensive computations is required. There are several approximation techniques (heuristics) but not recommended for this research since there exists a sensitivity in comparing network reliabilities, which may impact the results (i.e. reliability rankings).
2) In simulating disruption scenarios, applying disruptions only to the selective but critical nodes is often reasonable idea for exploring the variations of network reliability. In subway systems, the impact of hub disruption causes directly the inter-nodes’ total malfunction while the inter- nodal malfunction might not be significant to the other movement of flows on the network. In other words, the resilience of inter-node is highly dependent upon whether the transfer stations directly associated with it in terms of topology is damaged or not (O’Kelly and Kim, 2007).
3) If passengers’ travels on the subway network can be traced in detail using transaction database, more accurate
estimation would be possible (Park and Lee, 2007).
However, as being a priori, this paper more focuses on providing insight in terms of analytical frameworks for vulnerability research. The both data set can be availabe to the author based upon request.
References
Albert, R., Jeong, H., and Barabási, A. L., 2000, Error and attack tolerance of complex networks, Nature, 406, 378-382.
Albert, R. and Barabási, A. L., 2002, Statistical mechanics of complex networks, Reviews of Modern Physics, 74, 47-97.
AT&T, 2005, The quality of internet service: AT&T’s Global IP network performance measurements, AT&T (http://ipnetwork.bgtmo.ip.att.net/pws/
method.html).
Ball, M. O., Golden, B. L., and Vohra, R.V., 1989, Finding the most vital arcs in a network, Operations Research Letter, 8, 73-76.
Baran, P., 1964, On distributed communication networks, IEEE Transactions on Communications, 12, 1-9.
Bell, M. G. H. and Iida, Y., 1997, Transportation Network Analysis, New York, John Wiley.
Callaway, D. S., Newman, M. E. J., Strogatz, S. H., and Watts, D. J., 2000, Network robustness and fragility: percolation on random graphs, Physical Review Letters, 86, 5468-5471.
Chen, Y., Bell, M. G. H., and Kaparias, J., 2007, Reliability analysis of road networks and preplanning of emergency rescue paths, in Murray, A. and Grubesic, T. H. (eds.), Critical Infrastructure, Springer-Verlag, Berlin.
Church, R. L., Scaparra, M. P., and Middleton, R., 2004, The r-interdiction median problem and the r- interdiction covering problem, Annals of the Association of American Geographers, 94, 491- 502.
Cohen, R., Erez, K., ben-Avraham, D., and Havlin, S., 2001, Breakdown of the internet under intentional attack, Physical Review Letters, 86(16), 3682-3685.
Colbourn, C. J., 1987, The Combinatorics of Network
Reliability, New York, Oxford University Press.
Delfino, G., Rindone, C., Russo, F., and Vitetta, A., 2005, Risk analysis in road safety: a model and an experimental application for pedestrians, European Transport Conference 2005: Seminars (online: http://etcproceedings.org/paper/risk- analysis-in-road-safety-a-model-and-an- experimental-application-for-pedes).
D’Este, G. M. and Taylor, M. A. P., 2003, Network vulnerability: an approach to reliability analysis at the level of national strategic transport networks, in Iida, Y. and Bell, M. G. H. (eds.), The Network Reliability of Transport, Pergamon- Elsevier, Oxford.
Dotson, W. P. and Gobien, J. O., 1979, A new analysis technique for probabilistic graphs, IEEE Transactions on Circuits and Systems, 26, 855- 865.
Fortz, B. and Labbé, M., 2006, Design of survivable networks, in Resende, M. G. C. and Pardalos, P.
M. (eds.), Handbook of Optimization in Telecommunications, New York, Springer.
Gorman, S. P., Schintler, L., Kulkarni, R., and Stough, R., 2004, The revenge of distance: vulnerability analysis of critical information infrastructure, Journal of Contingencies and Crisis Management, 12, 48-63.
Grubesic, T. H., O’Kelly, M. E., and Murray, A. T., 2003, A geographic perspective on commercial Internet survivability, Telematics and Informatics, 20, 51-69.
Grubesic, T. H., Matisziw, T. C., Murray, A. T., and Snedicker, D., 2008, Comparative approaches for assessing network vulnerability, International Regional Science Review, 31(1), 88-112.
Huh, W., 1991, The journey-to-work and residential location choice in Seoul, Journal of the Korean Geographical Society, 26(1), 46-61 (in Korean).
Huh, W. and Kim, H., 2003, Information flows on the internet of Korea, Journal of Urban Technology, 10, 61-87.
Kim, H. and O’Kelly, M. E., 2004, Survivability of commercial backbones with peering, in 51st Annual North American Meetings of the Regional Science Association International, Seattle, WA,
11-13 November.
Kim, H. and O’Kelly, M. E., 2009, Reliable p-hub location problems in telecommunication networks, Geographical Analysis, in press.
Lam, W. H. K., Zhang, N., and Lo, H. K., 2007, A reliability-based user equilibrium model for traffic assignment, in Murray, A. and Grubesic, T.H. (eds.), Critical Infrastructure, Springer- Verlag, Berlin.
Lee, K. and Lee, H., 1998, A new algorithm for graph- theoretic nodal accessibility measurement, Geographical Analysis, 30(1), 1-14.
Lee, K., Hong, J., Min, H., and Park, J., 2007, Relationships between topological structures of traffic flows on the subway networks and land use patterns in the metropolitan, Journal of the Economic Geographical Society of Korea, 10(4), 427-443.
Lee, K., Jung, W., Park, J., and Choi, M., 2008, Statistical analysis of the metropolitan Seoul subway system: network structure and passenger flows, Physica A, 387(24), 6231-6234.
Lewis, T. G., 2006, Critical Infrastructure Protection in Homeland Security: Defending a Networked Nation, New York, John Wiley & Sons.
Matisziw, T. C., Murray, A. T., and Grubesic, T. H., 2009, Exploring the vulnerability of network infrastructure to interdiction, The Annals of Regional Science, 43(2), 307-321.
Matisziw, T. C. and Murray, A. T., 2009, Modeling s-t path availability to support disaster vulnerability assessment of network infrastructure, Computers
& Operations Research, 36(1), 16-26.
Medhi, D., 1999, Network reliability and fault tolerance, in Webster, J., Wiley Encyclopedia of Electrical and Electronics Engineering (ed.), New York, John Wiley and Sons.
Moteff, J. and Parfomak, P., 2004, Critical infrastructure and key assets: definition and identification, CRS Report for Congress, The Library of Congress.
Murray, A. T., Matisziw, T. C., and Grubesic, T. H., 2007, Critical network infrastructure analysis:
interdiction and system flow, Journal of Geographical Systems, 9(2), 103-117.
Murray, A. T. and Grubesic, T. H., 2007, Critical
Infrastructure: Reliability and Vulnerability, Springer-Verlag Press, Berlin.
National Security Telecommunications Advisory Committee (NSTAC), 2003, Internet Peering Security/Vulnerabilities Task Force Report, The president’s national security telecommunications advisory committee, Washington D.C.
Nicholson, A. J. and Dalziell, E., 2003, Risk evaluation and management: a road network reliability study. in Iida, Y. and Bell, M.G.H. (eds.), The Network Reliability of Transport, Pergamon- Elsevier, Oxford.
O’Kelly, M. E., 1986, Activity levels at hub facilities in interacting networks, Geographical Analysis, 18(4), 343-356.
O’Kelly, M. E., Kim, H., and Kim, C., 2006, Internet reliability with realistic peering, Environment and Planning B, 33, 325-343.
O’Kelly, M. E., and Kim, H., 2007, Survivability of commercial backbones with peering: a case study of Korean networks, in Murray, A. and Grubesic, T. (eds.), Critical Infrastructure, Springer-Verlag, Berlin.
O’Kelly, M. E., 2008, Routing traffic at hub facilities, Networks and Spatial Economics [online: DOI 10.1007/s11067-008-9061-z], 1-19.
Park, J. and Lee, K., 2007, Mining trip patterns in the large trip-transaction database and analysis of travel behavior, Journal of the Economic Geographical Society of Korea, 9(1), 44-63.
Pastor-Satorras, R. and Vespignani, A., 2004, Evolution and Structure of the Internet: A Statistical Physics Approach, Cambridge, UK, Cambridge University Press.
Pas, E. and Kopplelman, F., 1987, An examination of the determinants day-to-day variability in individuals’ urban travel behavior, Transportation, 13, 183-200.
Seoul Metropolitan Government, 2002, 2002 Household Survey for Commuting in Seoul Metropolitan Area, (2), Seoul Metropolitan Government (http://www.sdi.re.kr/od/od_2.pdf).
Shier, D. R., 1991, Network Reliability and Algebraic Structures, Oxford University Press, New York.
Snyder, L. V. and Daskin, M. S., 2007, Models for reliable
supply chain network design, in Murray, A. and Grubesic, T. H. (eds.), Critical Infrastructure, Springer-Verlag, Berlin.
Taaffe, E. J., Gauthier, H. L., and O’Kelly, M. E., 1996, Geography of Transportation, Prentice Hall, New Jersey.
Wakabayashi, H. and Iida, Y., 1992, Upper and lower bounds of terminal reliability of road networks:
an efficient method with Boolean algebra, Journal of Natural Disaster Science, 14, 29-44.
White House, 2003, The national strategy for the physical protection of critical infrastructures and key assets (online: http://www.whitehouse.gov/
pcipb/physical_strategy.pdf).
Wood, R. K., 1993, Deterministic network interdiction, Mathematical and Computer Modeling, 17(2), 1- 18.
Wrobel, L. and Wrobel, S. M., 2009, Disaster Recovery
Planning for Communications and Critical Infrastructure, Artech House, London.
Yoo, Y. B. and Deo, N., 1988, A comparison of algorithms for terminal-pair reliability, IEEE Transactions on Reliability, 37, 210-215.
http://www.seoulmetro.co.kr/
http://www.smrt.co.kr/Intro/General/General_income_st ation.jsp.
Correspondence: Hyun Kim, Department of Geography, University of South Florida, 4202 E Fowler Ave, NES 107, Tampa, FL 33620 USA (e-mail: [email protected].
edu, phone: +1-813-974-9490)
교신: 김현, 33620 사우스 플로리다 주립대학교 지리학과 (이메 일: [email protected], 전화: +1-813-974-9490)
Recieved Jun 11, 2009 Revised Jun 18, 2009 Accepted Jun 20, 2009