I. Introduction
Clinical decision-support models are designed to provide
expert support for health professionals making clinical deci- sions. The models use embedded clinical knowledge to help clinicians analyze patient data and make decisions regard- ing diagnosis, prevention, and treatment [1]. In this study, we focused on developing a clinical decision support model to predict occlusal force in bruxism patients. Bruxism is a parafunctional activity including jaw clenching and grind- ing of teeth during the day and/or night. Twenty percent of the adult population, mostly females, suffers from bruxism.
The etiology of bruxism has a multifactorial nature; tics, life stress or parafunction is believed to be associated with bruxism [2,3]. The consequences of bruxism include loss of tooth structure, cracked teeth, tooth pain and hypersen- sitivity, facial pain, and masticatory muscle and joint pain.
The diagnosis of bruxism should be done using multiple dimensions, including an oral history and questionnaires,
Clinical Decision Support Model to Predict Occlusal Force in Bruxism Patients
Bhornsawan Thanathornwong, DDS, PhD1, Siriwan Suebnukarn, DDS, PhD2
1Department of General Dentistry, Faculty of Dentistry, Srinakharinwirot University, Bangkok, Thailand; 2Faculty of Dentistry, Thammasat University, Bangkok, Thailand
Objectives: The aim of this study was to develop a decision support model for the prediction of occlusal force from the size and color of articulating paper markings in bruxism patients. Methods: We used the information from the datasets of 30 bruxism patients in which digital measurements of the size and color of articulating paper markings (12-μm Hanel; Coltene/
Whaledent GmbH, Langenau, Germany) on canine protected hard stabilization splints were measured in pixels (P) and in red (R), green (G), and blue (B) values using Adobe Photoshop software (Adobe Systems, San Jose, CA, USA). The occlusal force (F) was measured using T-Scan III (Tekscan Inc., South Boston, MA, USA). The multiple regression equation was applied to predict F from the P and RGB. Model evaluation was performed using the datasets from 10 new patients. The patient's oc- clusal force measured by T-Scan III was used as a ‘gold standard’ to compare with the occlusal force predicted by the multiple regression model. Results: The results demonstrate that the correlation between the occlusal force and the pixels and RGB of the articulating paper markings was positive (F = 1.62×P + 0.07×R –0.08×G + 0.08×B + 4.74; R2 = 0.34). There was a high de- gree of agreement between the occlusal force of the patient measured using T-Scan III and the occlusal force predicted by the model (kappa value = 0.82). Conclusions: The results obtained demonstrate that the multiple regression model can predict the occlusal force using the digital values for the size and color of the articulating paper markings in bruxism patients.
Keywords: Bite Force, Occlusal Splints, Bruxism, Decision Making, Logistic Models
Healthc Inform Res. 2017 October;23(4):255-261.
https://doi.org/10.4258/hir.2017.23.4.255 pISSN 2093-3681 • eISSN 2093-369X
Submitted: August 16, 2017
Revised: 1st, October 14, 2017; 2nd, October 20, 2017 Accepted: October 21, 2017
Corresponding Author
Bhornsawan Thanathornwong, DDS, PhD
Department of General Dentistry, Faculty of Dentistry, Srinakharin- wirot University, Bangkok 10110, Thailand. Tel: +66-2649-5000, E- mail: [email protected]
This is an Open Access article distributed under the terms of the Creative Com- mons Attribution Non-Commercial License (http://creativecommons.org/licenses/by- nc/4.0/) which permits unrestricted non-commercial use, distribution, and reproduc- tion in any medium, provided the original work is properly cited.
ⓒ 2017 The Korean Society of Medical Informatics
an extra-oral and intra-oral inspection for clinical signs of bruxism, and, in some cases, an electromyographic (EMG) recording of the activity of the masticatory muscles or even a polysomnographic (PSG) recording of the sleeping patient [4]. Although there is no definitive evidence for the treat- ment, bruxism can be managed using occlusal splints along with counselling to address the patient’s awareness of the parafunctional habits, stress reduction and sleep hygiene instructions, and in some cases, short-term pharmacological interventions in close collaboration with medical specialists [5].
The occlusal splint has been frequently used as an effective treatment for bruxism to protect teeth from damage caused by forceful jaw muscle contractions or to reduce orofacial pain, if present [6]. However, little is known regarding the mechanism of action for occlusal splints. Most studies have examined the changes in the masticatory muscle activity be- fore and after the application of an occlusal splint, and they showed that occlusal splint treatment resulted in a decrease in nocturnal masticatory muscle activities in patients with bruxism [7]. Furthermore, Kurita et al. [8] suggested that the use of a stabilization splint has an effect of reducing the hyperactivity and asymmetry in the activity of the jaw eleva- tor muscles and consequently elicits a stable and physiologi- cally optimal occlusal force from the muscles. In addition, Holmgren et al. [9] showed that splints redistribute the load borne by the teeth and the masticatory system. It has been suggested that the relief of bruxism symptoms with splint treatment may be a result of the redistribution of overload- ing [10]. According to these suggestions, the redistribution of forces and the reduction of bruxism symptoms with the use of occlusal splints may change the maximum occlusal force that has often been studied as an indicator of the func- tional state of the masticatory system [11].
Articulating paper is used to identify contact points be- tween the maxillary and mandibular teeth [12]. Occlusal adjustments are made by selectively grinding the paper marks to obtain occlusal stability, to establish multiple con- tacts throughout the arches that exhibit simultaneity, and to reduce stresses on the teeth and the periodontium. The use of articulation paper is the most commonly used method to determine excessive force in differing occlusal contacts.
Patients occlude upon strips of articulation paper that leave behind various ink markings on the tooth surface. The sub- jective interpretation of articulating paper markings is the most commonly employed method that clinicians use to select tooth contacts for occlusal treatment. However, mark size is indicative of contact location and surface area only
and does not quantify the occlusal force between the maxil- lary and mandibular teeth [13]. Digital occlusal analysis has been shown to consistently measure relative occlusal forces in a highly repeatable fashion. The recording sensor is placed intraorally between the dental arches to capture real- time occlusal force and time-sequence data when a patient bites or makes movements across the recording surface. The recorded occlusal force data offers the operator information about the occlusal contact locations that have excessive oc- clusal force when compared to the highly subjective method of judging the size, appearance and characteristics of ar- ticulating paper marks. The aim of the present study was to develop a clinical decision support model that helps general practitioners to predict the occlusal force from the articu- lating paper mark size and color on the occlusal splint in bruxism patients. We developed a prediction model for the occlusal force using a multiple regression equation for the articulating paper mark size in pixels and the color intensity including red, green, and blue.
II. Methods
1. Occlusal Splint Application Procedure
A total of 30 participants with ages ranging from 20 to 30 years old were enrolled with corresponding approval by the Ethical Committee of Human Investigation. All partici- pants gave their written informed consent as approved by the Institutional Ethical Review Board (No. DENTSWU- EC03/2560). The data collection procedure was carried out in the out-patient department of the dental clinic of the university hospital where the first author was a staff member from January to December 2015. A dentist who is an expert in the masticatory field was the consultant for the program and responsible for the diagnosis and management of brux- ism. All the participants were identified as having sleep bruxism and had all maxillary teeth from the right second molar to the left second molar. The exclusion criteria includ- ed participants who had a history of orthodontic treatment or were currently under orthodontic treatment, those who were pregnant or breast feeding, and those with an allergy to acrylic resin. Additionally, participants were excluded from this study upon showing signs and symptoms of an acrylic allergy, such as redness of the oral cavity tissue, inflamma- tion or a wound caused by the occlusal splints, or a desire to quit the study.
Canine-protected hard stabilization splints were personally constructed for each participant. Articulating paper (12-μm, Hanel; Coltene/Whaledent GmbH, Langenau, Germany) was
used for occlusal adjustment on the flat surface of the splint on the eccentric position. The flat surface of the occlusal splint was adjusted first until all mandibular teeth were con- sistently attached to the flat surface of the splint. Then, the incline of the canine rise was adjusted to align with both the forward and lateral condyle movement. The final adjustment was performed to facilitate the speaking, swallowing and lip closing of the participant.
2. Articulating Paper Marking Analysis
We used the information from the datasets of 30 bruxism pa- tients. The photos of the articulating paper marks were taken using a digital single-lens reflex camera (Pentax; manual mode setting, focal length = 105 mm, aperture area = F10, and shutter speed = 1/60 s). The camera height was 210 cm from the floor. The occlusal splints were placed on a table that was 70 cm high. A total of 250 articulating paper mark areas were manually identified by the dentist from 30 splints.
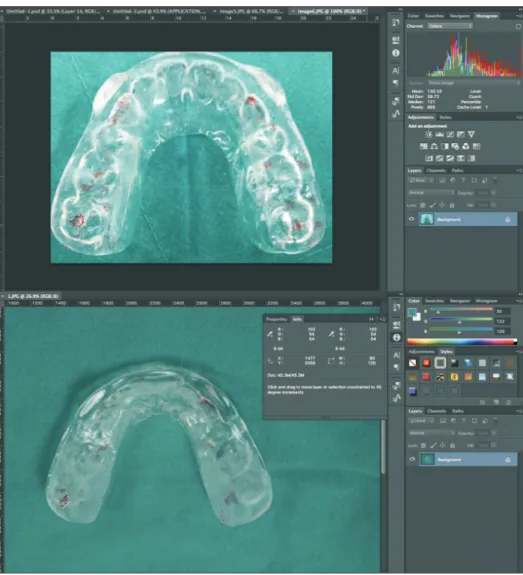
The digital measurements of the size and color (Figure 1) of the articulating paper markings on the canine-protected hard
stabilization splints were recognized by the pixels (P) and the red (R), green (G), blue (B) values, respectively, using Adobe Photoshop software (Adobe Systems, San Jose, CA, USA).
The pixel data were normalized prior to the calculation us- ing the following equation:
normalized_pixels = (pixels – mean) / standard deviation.
According to our experiment, the mean and standard de- viation for the pixels were 6785.49 and 3252.12. If the pixel data were 6000, the normalized pixel data were (6000 – 6785.49) / 3252.12 = 0.24.
Photoshop RGB color mode uses the RGB model assigning an intensity value to each pixel. In 8 bits per channel images, the intensity values range from 0 (black) to 255 (white) for each of the RGB (red, green, blue) components in a color image. When the values of all three components are equal, the result is a shade of neutral gray. When the values of all the components are 255, the result is a pure white; when the values are 0, the result is pure black.
Figure 1. The digital measurements of the size in pixels and the colors in red (R), green (G), and blue (B) of the ar- ticulating paper markings on canine-protected hard stabilization splints were recognized using Adobe Photo shop software (Adobe Systems, San Jose, CA, USA).
3. Computerized Occlusal Force Analysis
The computerized occlusal analysis technology used in this study was the T-Scan III system (Tekscan Inc., South Bos- ton, MA, USA). It has been shown to be capable of repeat- edly measuring the relative occlusal force [14]. The sensor is an electronically charged, Mylar-encased recording thin- film sensor, which can acquire 256 levels of relative occlusal contact force as a patient intercuspates, or makes excursive movements across its recording surface. The electronic digi- tal output of the sensor is proportional to the applied occlu- sal load at each contact point, is color-coded for its relative occlusal force content, and is positioned within a dental arch by the location on the sensor surface where the occlusal con- tact occurs. The software processes and displays the occlusal force data of recorded occlusal events in two and three di- mensions to be used in the diagnosis and treatment of excess occlusal force.
This study used ‘multi-bite recordings’ to record the oc- clusal force as explained by Qadeer et al. [13]. To initialize the software for each individual, the width of the maxillary first incisors of each participant was measured using a digital caliper as well as the missing maxillary third molars. Each participant was asked to wear the occlusal splint firmly oc- cluding into and through the recording sensor and to hold their teeth firmly intercuspated together for 1–2 seconds be- fore repeating that same firm intercuspation twice more fol- lowed by a 1- to 2-second intercuspated hold. This 3-closure recording technique ensures that at least one maximum force closure was obtained from each subject. Figure 2 shows the occlusal force distribution of one participant. We took all oc- clusal force data that corresponded to the articulating paper mark area on the same participant for the multi-regression analysis.
4. Prediction Model
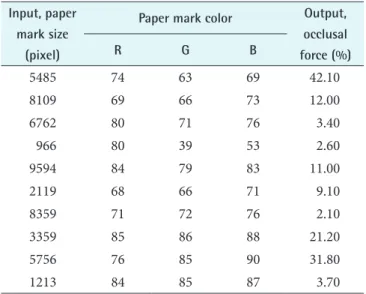
We chose to use multiple regression analysis [15] as the un- derlying model for the prediction of occlusal force. Multiple regression implements a general linear regression model and is especially appropriate for incorporation into software applications. Multiple independent variables are used to ex- plain the variation in a dependent variable. In this study, we used the information from the datasets of patients (Table 1) and applied the multiple regression equation to these datas- ets to develop a model for predicting occlusal force from the articulating paper mark size in pixels and the color intensity of red, green, and blue. Finally, we evaluated the accuracy of the multiple regression model for predicting the occlusal force in bruxism patients wearing occlusal splints.
We implemented the occlusal force prediction model using
Figure 2. Occlusal force distribution of one participant from the T-Scan III system (Tekscan Inc., South Boston, MA, USA).
Table 1. Part of the input and output data used in the study Input, paper
mark size (pixel)
Paper mark color Output, occlusal force (%)
R G B
5485 74 63 69 42.10
8109 69 66 73 12.00
6762 80 71 76 3.40
966 80 39 53 2.60
9594 84 79 83 11.00
2119 68 66 71 9.10
8359 71 72 76 2.10
3359 85 86 88 21.20
5756 76 85 90 31.80
1213 84 85 87 3.70
multiple regression. The model computed the occlusal force using four input variables (P = paper mark size in pixels, R = paper mark color in red, G = paper mark color in green, and B = paper mark color in blue) from the digital analysis of the articulating paper markings. The output occlusal force was taken from the T-Scan occlusal force data.
III. Results
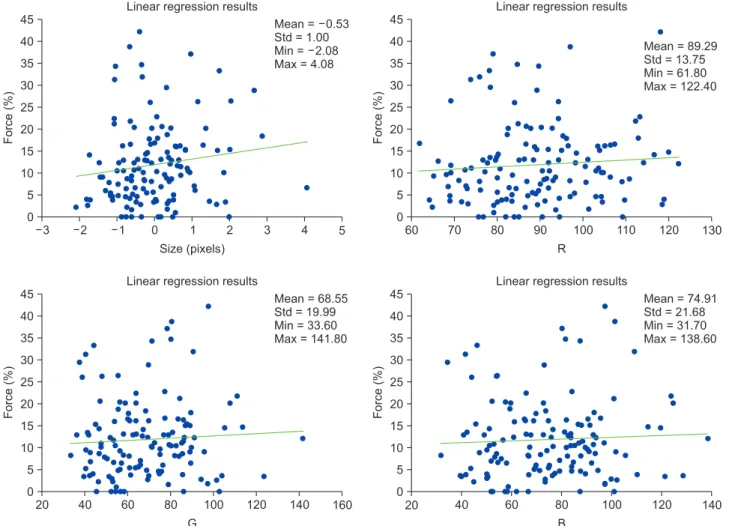
Thirty Thai participants (23 females and 7 males) with an average age of 25 years were recruited. Multiple regression analysis used the data for articulating paper mark sizes (in pixels) and colors (in red, green, and blue) as independent variables and the data on the computerized occlusal force (in %) as dependent variables. We analyzed the correlation between the occlusal force and the articulating paper mark data using a simple linear regression analysis. The results show that the correlations between force and sizes, force and red, force and green, and force and blue were positive. Fig-
ure 3 shows the regression lines from the equations between force and sizes (force = 1.26P + 11.71; R2 = 0.20) and force and RGB (force = 0.04R + 0.02G - 0.01B + 7.27; R2 = 0.07), respectively. Based on the results above, we then created a multiple regression model using four independent variables sizes and red, green and blue values from the articulating paper marks as follows: occlusal force = 1.62×P + 0.07×R – 0.08×G + 0.08×B + 4.74; R2 = 0.34. With only 30 cases in the training dataset, our experiments showed that the changes in the predictor variables were associated with changes in the response variable.
To evaluate the occlusal prediction model, we randomly recruited 10 new participants from the university clinic. All participants gave their written informed consent as approved by the institutional ethical review board. The age range, in- clusion and exclusion criteria, occlusal splint procedure, and articulating paper recordings of the new participants were the same as those for the participants used in the develop- ment of the prediction model. The occlusal force of the new
Force (%)
3 45 40 35 30 25 20 15 10 5
5 Size (pixels)
0
Mean = 0.53 Std = 1.00 Min = 2.08 Max = 4.08
4 3 2 1 0 1 2
Linear regression results
Force (%)
60 45 40 35 30 25 20 15 10 5
130 R
0
Mean = 89.29 Std = 13.75 Min = 61.80 Max = 122.40
120 110 100 90 80 70
Linear regression results
Force (%)
20 45 40 35 30 25 20 15 10 5
160 G
0
Mean = 68.55 Std = 19.99 Min = 33.60 Max = 141.80
140 120 100 80 60 40
Linear regression results
Force (%)
20 45 40 35 30 25 20 15 10 5
140 B
0
Mean = 74.91 Std = 21.68 Min = 31.70 Max = 138.60
120 100
80 60 40
Linear regression results
Figure 3. The regression lines between the occlusal force values (%) measured using the T-Scan III system (Tekscan Inc., South Boston, MA, USA) and the size values in pixels, the color values in red (R), the color values in green (G), and the color values in blue (B) for the articulating paper marks using Adobe Photoshop software (Adobe Systems, San Jose, CA, USA).
participants measured by T-Scan was used as the ‘gold stan- dard’ for comparison with the occlusal force predicted by the model (Figure 4). There was a high degree of agreement be- tween the occlusal force of a participant measured by T-Scan and the occlusal force predicted by the multiple regression model (kappa value = 0.82).
IV. Discussion
Bruxism is commonly considered to be the main contributor to dental attrition, periodontal disease and temporoman- dibular joint disorders [16]. This nocturnal behavior is com- prised of rhythmic, yet forceful, mandibular grinding as well as prolonged muscular clenching of the dentition. One of the primary areas of concern with respect to the bruxing behav- ior is the creation of a high bite force between the upper and lower dentitions. A study [17] reported that the nocturnal bite force during bruxism can exceed the amplitude of the maximum voluntary bite force during the day.
Occlusal splints have been used for many years as an ef- fective treatment for bruxism. Identification of the occlusal force is essential to adjust the occlusal splint to obtain force redistribution and a reduction of the bruxism symptoms [9-11]. Subjective interpretation is an ineffective clinical method for determining the relative occlusal force content of tooth contacts. The reported low scores obtained from a large group of participating dentists suggest that clinicians are unable to reliably differentiate high and low occlusal force from looking at articulating paper marks. This long-
standing method of visually observing articulating paper marks for occlusal contact force content should be replaced with a measurement-based, objective method [18].
This current study proposed a model for the prediction of the occlusal force using the size and color of articulating paper marks in bruxism patients using multiple regression analysis. This study established a correlation between the oc- clusal force on the occlusal splint expressed by the size (pix- els) and color (RGB) of the articulating paper marks. The weak correlation (force = 1.26P + 11.71; R2 = 0.20) found between the occlusal force and the pixels shows that the bite force is poorly predicted solely by the size of the articulat- ing paper marks. The result is in agreement with [13], which indicates that the size of the articulating paper marks is an unreliable indicator of the applied occlusal force. However, a strong correlation was found between the bite force and the size of the eccentric on the articulating paper (pixel) and the color (RGB) using the multiple linear regression equation (force = 0.04R + 0.018G – 0.01B + 7.27; R2 = 0.07). The mul- tiple regression model was incorporated into the decision support system. By evaluating the accuracy of the system us- ing new patient data, the system was shown to be highly ac- curate in predicting the occlusal force on the occlusal splint of bruxism patients.
The current study was limited by focusing on an objective aspect of the variable contributing to the occlusal force in bruxism patients. The limited amount of literature on the causal relationships between articulating paper markings and other factors and the occlusal force makes it difficult to estimate the influence of multiple factors and how they may interact with biomechanical as well as individual factors.
The prediction model used in this study does not permit the addition of new data, which can be used to update, or retrain and validate the model. An iterative modelling methodology that can be dynamically modified and optimized should be explored in the future. The data used in this study was cross- sectional and derived from a limited number of bruxism patients. Further studies should be carried out to monitor the occlusal force during and at the end of the treatment. In conclusion, this study demonstrated that the multiple regres- sion model can predict the occlusal force using the digital values of the size and color of articulating paper markings in bruxism patients.
Conflict of Interest
No potential conflict of interest relevant to this article was reported.
Normalize pixels : Red color : Green color : Blue color :
18 102 61 24
Force : 43.741 Output
Figure 4. The occlusal force prediction of one articulation paper marking using the digital values of size in pixels and color in the RGB mode.
Acknowledgments
This study was supported by the National Research Coun- cil of Thailand and the Thailand Research Fund (No.
RDG6050029).
References
1. Chae YM, Yoo KB, Kim ES, Chae H. The adoption of electronic medical records and decision support systems in Korea. Healthc Inform Res 2011;17(3):172-7.
2. Lavigne GJ, Manzini C, Kato T. Sleep bruxism: princi- ples and practice of sleep medicine. 4th ed. Philadelphia (PA): Elsevier/Saunders; 2005.
3. Kato T, Thie NM, Huynh N, Miyawaki S, Lavigne GJ.
Topical review: sleep bruxism and the role of peripheral sensory influences. J Orofac Pain 2003;17(3):191-213.
4. Castrillon EE, Ou KL, Wang K, Zhang J, Zhou X, Svens- son P. Sleep bruxism: an updated review of an old prob- lem. Acta Odontol Scand 2016;74(5):328-34.
5. Lobbezoo F, Van Der Zaag J, Naeije M. Bruxism: its multiple causes and its effects on dental implants: an updated review. J Oral Rehabil 2006;33(4):293-300.
6. Harada T, Ichiki R, Tsukiyama Y, Koyano K. The effect of oral splint devices on sleep bruxism: a 6-week obser- vation with an ambulatory electromyographic recording device. J Oral Rehabil 2006;33(7):482-8.
7. Okeson JP. The effects of hard and soft occlusal splints on nocturnal bruxism. J Am Dent Assoc 1987;114(6):
788-91.
8. Kurita H, Ikeda K, Kurashina K. Evaluation of the ef- fect of a stabilization splint on occlusal force in patients with masticatory muscle disorders. J Oral Rehabil 2000;
27(1):79-82.
9. Holmgren K, Sheikholeslam A, Riise C. Effect of a full- arch maxillary occlusal splint on parafunctional activity during sleep in patients with nocturnal bruxism and signs and symptoms of cranio-mandibular disorders. J Prosthet Dent 1993;69(3):293-7.
10. Dylina TJ. A common-sense approach to splint therapy.
J Prosthet Dent 2001;86(5):539-45.
11. Braun S, Bantleon HP, Hnat WP, Freudenthaler JW, Marcotte MR, Johnson BE. A study of bite force. Part 1:
Relationship to various physical characteristics. Angle Orthod 1995;65(5):367-72.
12. Dawson PE. Functional occlusion: from TMJ to smile design. St Louis (MO): Mosby; 2007. p. 347, 610.
13. Qadeer S, Kerstein R, Kim RJ, Huh JB, Shin SW. Rela- tionship between articulation paper mark size and per- centage of force measured with computerized occlusal analysis. J Adv Prosthodont 2012;4(1):7-12.
14. Kerstein RB, Lowe M, Harty M, Radke J. A force repro- duction analysis of two recording sensors of a comput- erized occlusal analysis system. Cranio 2006;24(1):15- 24.
15. Keith TZ. Multiple regression, beyond: an introduction to multiple regression and structural equation model- ing. New York (NY): Taylor & Francis; 2015.
16. Attanasio, R. Nocturnal bruxism and its clinical man- agement. Dent Clin North Am 1991;35(1):245-52.
17. Nishigawa K, Bando E, Nakano M. Quantitative study of bite force during sleep associated bruxism. J Oral Re- habil 2001;28(5):485-91.
18. Kerstein RB, Radke J. Clinician accuracy when subjec- tively interpreting articulating paper markings. Cranio 2014;32(1):13-23.