Endocrinol Metab 2016;31:64-71
http://dx.doi.org/10.3803/EnM.2016.31.1.64 pISSN 2093-596X · eISSN 2093-5978
Original Article
Serum γ-Glutamyl Transferase Is Inversely Associated with Bone Mineral Density Independently of Alcohol
Consumption
Han Seok Choi1, Kwang Joon Kim2,3,4, Yumie Rhee2, Sung-Kil Lim2
1Division of Endocrinology and Metabolism, Department of Internal Medicine, Dongguk University Ilsan Hospital, Dongguk University College of Medicine, Goyang; 2Division of Endocrinology, Department of Internal Medicine, Yonsei University College of Medicine; 3Severance Check-up, 4Severance Executive Healthcare Clinic, Severance Hospital, Yonsei University Health System, Seoul, Korea
Background: γ-Glutamyl transferase (GGT) is a well-known marker of chronic alcohol consumption or hepatobiliary diseases. A number of studies have demonstrated that serum levels of GGT are independently associated with cardiovascular and metabolic disorders. The purpose of this study was to test if serum GGT levels are associated with bone mineral density (BMD) in Korean adults.
Methods: A total of 462 subjects (289 men and 173 women), who visited Severance Hospital for medical checkup, were included in this study. BMD was measured using dual energy X-ray absorptiometry. Cross-sectional association between serum GGT and BMD was evaluated.
Results: As serum GGT levels increased from the lowest tertile (tertile 1) to the highest tertile (tertile 3), BMD decreased after adjusting for confounders such as age, body mass index, amount of alcohol consumed, smoking, regular exercise, postmenopaus- al state (in women), hypertension, diabetes mellitus, and hypercholesterolemia. A multiple linear regression analysis showed a negative association between log-transformed serum GGT levels and BMD. In a multiple logistic regression analysis, tertile 3 of serum GGT level was associated with an increased risk for low bone mass compared to tertile 1 (odds ratio, 2.271; 95% confi- dence interval, 1.340 to 3.850; P=0.002).
Conclusion: Serum GGT level was inversely associated with BMD in Korean adults. Further study is necessary to fully elucidate the mechanism of the inverse relationship.
Keywords: Gamma-glutamyltransferase; Metabolic disorders; Bone density
INTRODUCTION
γ-Glutamyl transferase (GGT), a well-known marker of chronic alcohol consumption and hepatobiliary disease, is abundantly
expressed in several tissues, particularly those with secretory or absorptive functions, such as the kidneys, pancreas, seminal vesicles, small intestine, and bile duct [1,2]. A number of studies have demonstrated that serum levels of GGT are independently
Received: 28 April 2015, Revised: 7 September 2015, Accepted: 13 October 2015 Corresponding author: Sung-Kil Lim
Department of Internal Medicine, Yonsei University College of Medicine, 50-1 Yonsei-ro, Seodaemun-gu, Seoul 03722, Korea
Tel: +82-2-2228-1948, Fax: +82-2-393-6884, E-mail: lsk@yuhs.ac
Copyright © 2016 Korean Endocrine Society
This is an Open Access article distributed under the terms of the Creative Com- mons Attribution Non-Commercial License (http://creativecommons.org/
licenses/by-nc/4.0/) which permits unrestricted non-commercial use, distribu- tion, and reproduction in any medium, provided the original work is properly cited.
associated with cardiovascular and metabolic disorders such as obesity, metabolic syndrome, type 2 diabetes mellitus, coronary heart disease, and stroke [3-14], although the mechanism of these associations has not been fully elucidated. GGT plays a key role in glutathione homeostasis. GGT is located on the outer surface of the plasma membrane with its active site exposed to the extracellular space [1,2]. As an ectopeptidase, it catalyzes degradation of extracellular glutathione to generate its constitu- ent amino acids including cysteine. These amino acids are taken up by the cells and reutilized for de novo synthesis of glutathi- one, which participates in many biological functions, including antioxidant defense, maintenance of intracellular redox status, signal transduction, and nutrient metabolism [1,2,15].
Bone is an active metabolizing tissue, as both bone forma- tion and resorption occur throughout life. This bone remodel- ing process, which determines bone mass, is regulated by many systemic and local factors such as estrogens, vitamin D, para- thyroid hormone, bone morphogenetic proteins, receptor acti- vator for NF-κB-ligand (RANKL), and osteoprotegerin [16].
Several in vitro and in vivo studies have demonstrated that GGT affects bone metabolism through systemic and local mechanisms [17-20]. Both deficiency and excess GGT are in- volved in the abnormal bone remodeling processes, which re- sult in decreased bone mass. However, only a few clinical stud- ies have demonstrated a significant relationship between GGT and bone [20]. In the present study, we performed a cross-sec- tional analysis to investigate whether serum levels of GGT are associated with bone mineral density (BMD) in Korean adults.
METHODS
Subjects and data collection
A total of 462 subjects (289 men and 173 women) aged 21 to 83 years were recruited from the Healthcare Center at the Sev- erance Hospital, Yonsei University College of Medicine in Seoul, Korea, and were included in analyses. All adult Koreans were included if they did not meet any of the exclusion criteria, including a history of a medical condition known to be associ- ated with abnormal bone metabolism or to alter bone mass such as hyperparathyroidism, rheumatoid arthritis, and chronic renal failure; history of hepatobiliary diseases such as liver cir- rhosis, primary biliary cirrhosis, or viral hepatitis (including positivity for serum hepatitis B surface antigen or serum hepa- titis C antibody); and current use of medications capable of af- fecting bone and mineral metabolism such as glucocorticoste- roid, thyroid hormones, sex hormones, selective estrogen re-
ceptor modulators, or bisphosphonates. All subjects completed standardized questionnaires about their medical history, includ- ing past illnesses, family history, current medication, smoking, alcohol consumption, exercise, and menopausal status (in women). Height, weight, and waist and hip circumference were measured while subjects wore light clothing and no shoes.
Waist circumference was measured midway between the low- est rib and the iliac crest, and hip circumference was taken over the widest part of the gluteal region. Body mass index (BMI) was calculated as weight divided by height squared (kg/m2).
Smokers were defined as those who smoked at the time of the study or who had smoked within 5 years. Those who had stopped smoking in the last 5 years or more were regarded as nonsmokers. Questions about alcohol intake included the type of alcoholic beverage and the frequency and amount of alcohol consumed on a weekly basis. Based on their answers, amount of alcohol consumed per day was calculated in g/day. Regular exercisers were defined as those who exercised at least three times per week. Women who had not had a menstrual cycle for 1 year were considered postmenopausal. Hypertension was de- fined as systolic blood pressure (BP) ≥140 mm Hg or diastolic BP ≥90 mm Hg or current use of BP lowering agent. Diabetes mellitus was defined as fasting glucose ≥126 mg/dL or hemo- globin A1c ≥6.5% or current use of a glucose lowering agent.
Hypercholesterolemia was defined as total cholesterol ≥200 mg/dL or use of a cholesterol lowering agent. The study proto- col was approved by the Institutional Review Board of Sever- ance Hospital, Yonsei University College of Medicine.
BMD measurement
BMD (g/cm2) measures of the lumbar spine (L1 to L4), femo- ral neck, and total hip were assessed using dual energy X-ray absorptiometry (QDR-4500W, Hologic, Bedford, MA, USA).
Three subjects (two males, one female) could not be assessed for lumbar spine BMD due to prior vertebroplasty. In these subjects, only the femoral neck and total hip BMD were used as data. The coefficients of variation for these measurements were <1.1%. Osteoporosis was defined as BMD of the lumbar spine, total hip, or femoral neck that was 2.5 standard devia- tions (SDs) or more below the mean of a young Korean refer- ence population (T-score <−2.5), and osteopenia was defined as a T-score between −1 and −2.5.
Biochemical values
Blood samples were collected from each subject after an over- night fast. The concentrations of plasma glucose, serum calci-
um, phosphorus, creatinine, aspartate aminotransferase (AST), alanine aminotransferase (ALT), alkaline phosphatase, total cholesterol, triglycerides, high density lipoprotein cholesterol, and low density lipoprotein cholesterol were measured using standard laboratory techniques. Serum GGT levels were mea- sured by an enzymatic method using a Hitachi 7600-110 auto- mated chemistry analyzer (Hitachi, Tokyo, Japan).
Statistical analyses
Statistical analyses were carried out using SPSS version 20.0 (IBM Co., Armonk, NY, USA). Male and female participants were divided into tertiles based on serum GGT level. The GGT levels in men were higher than those in women. Thus, sex-spe- cific tertiles of serum GGT were used for analyses. In men, the cut-off points were <24 IU/L (tertile 1), 25 to 38 IU/L (tertile 2), and >39 IU/L (tertile 3). In women, the cut-off points were
<13 IU/L (tertile 1), 14 to 20 IU/L (tertile 2), and >21 IU/L (tertile 3). Demographic and clinical characteristics were ana- lyzed according to tertiles of serum GGT levels (Table 1). A general linear model for a linear trend analysis was used in continuous data analyses. The chi-square test for a linear trend was used for the categorical data analyses. BMD at the lumbar spine, femoral neck, total hip, and BMD T-scores were ana- lyzed according to tertiles of serum GGT levels (Table 2).
Analysis of covariance was used to adjust for confounding variables. Variables for adjustment included age (years), BMI (kg/m2), amount of alcohol consumed (g/day), smoking (yes or no), regular exercise (yes or no), hypertension (yes or no), dia- betes mellitus (yes or no), hypercholesterolemia (yes or no), and postmenopausal state (in women; yes or no). Multiple lin- ear regression analyses for BMD were performed after adjust- ing for confounding variables (Table 3). The distribution of Table 1. Demographic and Clinical Characteristics of Participants according to Tertiles of Serum GGT Levels
Variable
Men Women
Tertile 1
(n=100) Tertile 2
(n=93) Tertile 3
(n=96) P for trend Tertile 1
(n=57) Tertile 2
(n=58) Tertile 3
(n=58) P for trend
Age, yr 57.2±8.3 55.5±9.0 54.7±7.9 0.037 51.1±10.1 55.7±9.4 58.0±8.8 <0.001
BMI, kg/m2 24.4±2.3 25.4±2.7 25.6±2.9 0.002 21.9±2.7 22.4±3.0 23.6±3.7 0.005
Waist, cm 87.9±7.1 89.6±11.1 91.1±6.9 0.017 77.4±8.4 79.8±8.9 82.8±10.4 0.004
Alcohol, g/day 15.4±21.6 22.2±27.9 38.5±53.5 <0.001 0.2±0.8 1.6±5.6 2.0±8.7 0.122
Smoking 23 (23.0) 45 (48.4) 51 (53.1) <0.001 2 (3.5) 3 (5.2) 5 (8.6) 0.241
Regular exercise 47 (47.0) 28 (30.1) 35 (36.5) 0.124 19 (33.3) 23 (39.7) 13 (22.4) 0.207
Hypertension 40 (40.0) 43 (46.2) 53 (55.2) 0.033 11 (19.3) 18 (31.0) 23 (39.7) 0.018
Diabetes mellitus 22 (22.0) 17 (18.3) 22 (22.9) 0.883 4 (7.0) 5 (8.6) 6 (10.3) 0.527
Hypercholesterolemia 41 (41.0) 43 (46.2) 64 (66.7) <0.001 22 (38.6) 19 (32.8) 34 (58.6) 0.030
SBP, mm Hg 127±14 126±13 128±14 0.557 115±15 118±15 124±15 0.003
DBP, mm Hg 77±10 77±9 80±10 0.056 71±9 73±10 73±8 0.166
FPG, mg/dL 103±22 106±27 107±20 0.296 95±27 94±13 99±22 0.404
HbA1c, % 5.9±0.8 5.8±0.7 5.9±0.5 0.987 5.5±0.4 5.7±0.6 5.8±0.8 0.009
Triglyceride, mg/dL 119±56 142±58 180±95 <0.001 95±49 104±49 146±78 <0.001
HDL-C, mg/dL 47±9 46±11 49±12 0.282 57±12 56±13 55±14 0.410
LDL-C, mg/dL 119±35 114±28 122±37 0.628 115±25 124±23 128±35 0.017
TC, mg/dL 179±33 179±30 193±37 0.004 186±32 191±29 203±39 0.007
AST, mg/dL 22.8±19.0 22.1±6.4 25.6±11.9 0.147 19.4±6.2 21.2±4.8 26.5±9.5 <0.001
ALT, mg/dL 22.2±15.6 26.8±13.7 33.5±20.2 <0.001 15.7±5.6 18.6±6.5 27.8±14.6 <0.001
Creatinine, mg/dL 1.0±0.1 1.0±0.2 1.0±0.2 0.672 0.8±0.1 0.8±0.1 0.8±0.2 0.053
Values are expressed as mean±SD or number (%). Tertiles of serum GGT levels in men: tertile 1, ≤24 IU/L; tertile 2, 25–38 IU/L; tertile 3, ≥39 IU/
L. Tertiles of serum GGT levels in women: tertile 1, ≤13 IU/L; tertile 2, 14–20 IU/L; tertile 3 ≥21 IU/L.
GGT, γ-glutamyl transferase; BMI, body mass index; SBP, systolic blood pressure; DBP, diastolic blood pressure; FPG, fasting plasma glucose;
HbA1c, hemoglobin A1c; HDL-C, high density lipoprotein cholesterol; LDL-C, low density lipoprotein cholesterol; TC, total cholesterol; AST, as- partate aminotransferase; ALT, alanine aminotransferase.
GGT values was right-skewed; therefore, natural log-transfor- mation was applied. Multiple logistic regression analysis was used to evaluate the odds ratios (ORs) and 95% confidence in- tervals (CIs) of having low bone mass including osteopenia and osteoporosis (Table 4). The OR (95% CI) for having low bone mass in those who belonged to tertiles 2 and 3 was evalu- ated compared to those who belonged to tertile 1. All tests were two-sided, and P<0.05 was considered significant.
RESULTS
Demographics and clinical characteristics of the participants The mean±SD age of the participants was 55.8±8.4 years for men and 55.0±9.8 for women. The mean±SD BMI was 25.1±2.7 for men and 22.7±3.2 for women. The mean±SD serum level of GGT was 40.5±31.4 IU/L in men and 21.4±
19.0 IU/L in women. The demographic and clinical character-
istics of the participants were compared among the tertiles of serum GGT levels in men and women (Table 1). The average age of men decreased with increasing serum GGT level from tertile 1 to tertile 3, whereas the average age of women in- creased. In both sexes, the mean values of BMI and waist cir- cumference increased with serum GGT level from tertile 1 to tertile 3. The average amount of alcohol consumed and the per- centage of participants smoking increased with increasing se- rum GGT level in men. The prevalence of hypertension and hypercholesterolemia also increased with elevating serum GGT level in both sexes. Other clinical and biochemical parameters are presented in Table 1.
Associations between serum GGT levels and BMD
Mean BMD values measured at the lumbar spine, femoral neck, and total hip were compared among tertiles of serum GGT levels (Table 2). Mean BMD values at the lumbar spine Table 2. Comparison of BMD among Tertiles of Serum GGT Levels
Variable
Men Women
Tertile 1
(n=100) Tertile 2
(n=93) Tertile 3
(n=96) P for trend Tertile 1
(n=57) Tertile 2
(n=58) Tertile 3
(n=58) P for trend LS BMD, g/cm2 1.066±0.013 1.063±0.013 1.022±0.012 0.018 0.986±0.017 0.970±0.017 0.915±0.017 0.004 LS BMD (T-score)
Model 1a 0.4±0.1 0.3±0.1 0.0±0.1 0.011 –0.2±0.1 –0.3±0.1 –0.8±0.1 0.004
Model 2b 0.4±0.1 0.3±0.1 0.0±0.1 0.006 –0.2±0.1 –0.3±0.1 –0.8±0.1 0.006
Model 3c 0.3±0.1 0.4±0.1 0.0±0.1 0.047 –0.3±0.1 –0.3±0.1 –0.7±0.1 0.022
Model 4d 0.3±0.1 0.4±0.1 0.0±0.1 0.050 –0.3±0.1 –0.3±0.1 –0.7±0.1 0.025
FN BMD, g/cm2 0.814±0.011 0.816±0.011 0.811±0.011 0.826 0.748±0.013 0.718±0.013 0.692±0.013 0.003 FN BMD (T-score)
Model 1a –0.3±0.1 –0.2±0.1 –0.3±0.1 0.793 –0.5±0.1 –0.8±0.1 –1.0±0.1 0.003
Model 2b –0.2±0.1 –0.3±0.1 –0.3±0.1 0.117 –0.6±0.1 –0.7±0.1 –1.0±0.1 0.009
Model 3c –0.2±0.1 –0.2±0.1 –0.4±0.1 0.163 –0.6±0.1 –0.8±0.1 –1.0±0.1 0.020
Model 4d –0.2±0.1 –0.2±0.1 –0.4±0.1 0.188 –0.6±0.1 –0.8±0.1 –1.0±0.1 0.021
TH BMD, g/cm2 0.963±0.012 0.970±0.013 0.952±0.012 0.542 0.858±0.016 0.816±0.015 0.796±0.015 0.005 TH BMD (T-score)
Model 1a 0.2±0.1 0.2±0.1 0.1±0.1 0.468 0.1±0.1 –0.3±0.1 –0.5±0.1 0.006
Model 2b 0.3±0.1 0.2±0.1 0.0±0.1 0.042 0.0±0.1 –0.3±0.1 –0.5±0.1 0.007
Model 3c 0.3±0.1 0.2±0.1 0.0±0.1 0.038 0.0±0.1 –0.3±0.1 –0.4±0.1 0.023
Model 4d 0.3±0.1 0.2±0.1 0.0±0.1 0.056 0.0±0.1 –0.3±0.1 –0.4±0.1 0.026
Values are expressed as mean±SE. Tertiles of serum GGT level in men: tertile 1, ≤24 IU/L; tertile 2, 25–38 IU/L; tertile 3, ≥39 IU/L. Tertiles of se- rum GGT level in women: tertile 1, ≤13 IU/L; tertile 2, 14–20 IU/L; tertile 3 ≥21 IU/L.
BMD, bone mineral density; GGT, γ-glutamyl transferase; LS, lumbar spine; FN, femoral neck; TH, total hip.
aModel 1: no adjustment; bModel 2: adjusted for age and body mass index; cModel 3: adjusted as in model 2 plus amount of alcohol consumed, smok- ing, regular exercise, and postmenopausal state (in women); dModel 4: adjusted as in model 3 plus hypertension, diabetes mellitus, and hypercholes- terolemia.
decreased as serum GGT level increased from tertile 1 to 3 in both sexes. Mean BMD values at the femoral neck and total hip also decreased with increasing serum GGT level in women.
The BMD T-scores were compared between the different ter- tiles in men and women. As shown in Table 2, the BMD T- scores at all sites decreased with increasing GGT level from tertile 1 to tertile 3 in women, which remained statistically sig- nificant even after adjusting for confounders (model 1 to 4). In men, the BMD T-scores at lumbar spine significantly decreased with increasing serum GGT level (model 1). Adjustment for possible predictors of BMD such as age, BMI, amount of alco- hol consumed, smoking, and regular exercise made the associa- tions between serum GGT levels and BMD T-scores at the lumbar spine and total hip statistically significant (model 2, 3).
Even after further adjustment for hypertension, diabetes melli- tus, and hypercholesterolemia, the associations between serum GGT levels and BMD T-scores at the lumbar spine and total
hip showed a tendency toward inverse association (model 4).
Multiple linear regression analysis for BMD was performed with log-transformed serum GGT level as covariates. In this model, log-transformed serum GGT level was inversely associ- ated with BMD (Table 3).
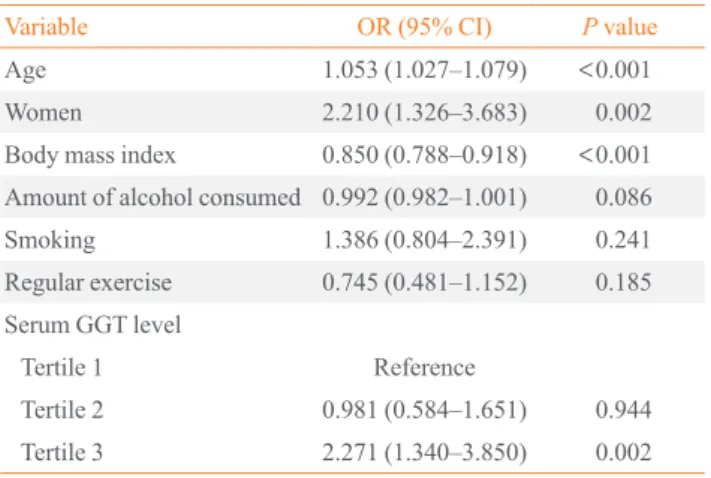
Multiple logistic regression analysis for low bone mass The multiple logistic regression analysis results for low bone mass including osteopenia and osteoporosis are presented in Table 4. Age, sex, BMI, amount of alcohol consumed, smok- ing, regular exercise, and tertile of serum GGT level were in- cluded as covariates. In this analysis, age, sex, BMI, and serum GGT level were associated with low bone mass. Age and BMI were independently associated with low bone mass with ORs (95% CI) of 1.053 (1.027 to 1.079) and 0.850 (0.788 to 0.918), respectively. Compared to men, the OR (95% CI) for low bone mass was 2.210 (1.326 to 3.683) for women. Tertile 3 of the se- rum GGT level was associated with increased risk for low bone mass compared to tertile 1 (OR, 2.271; 95% CI, 1.340 to 3.850;
P=0.002), but tertile 2 of serum GGT level was not associated with low bone mass in this analysis.
DISCUSSION
In the present study, we showed that serum GGT level was in- versely associated with BMD in Korean adults after adjusting Table 3. Multiple Linear Regression Analyses between Serum
GGT Levels and BMD
Ln GGT
Men Women
β P value β P value
LS BMD
Model 1a –0.163 0.006 –0.306 <0.001 Model 2b –0.184 0.002 –0.316 <0.001 Model 3c –0.146 0.016 –0.314 <0.001 Model 4d –0.147 0.017 –0.311 <0.001 FN BMD
Model 1a –0.034 0.569 –0.271 <0.001 Model 2b –0.119 0.037 –0.269 <0.001 Model 3c –0.113 0.052 –0.276 <0.001 Model 4d –0.111 0.061 –0.278 <0.001 TH BMD
Model 1a –0.065 0.268 –0.287 <0.001 Model 2b –0.148 0.009 –0.306 <0.001 Model 3c –0.152 0.008 –0.307 <0.001 Model 4d –0.149 0.011 –0.307 <0.001 GGT, γ-glutamyl transferase; BMD, bone mineral density; Ln GGT, log-transformed value of serum GGT level; LS, lumbar spine; FN, femoral neck; TH, total hip.
aModel 1: no adjustment; bModel 2: adjusted for age and body mass index; cModel 3: adjusted as in model 2 plus amount of alcohol con- sumed, smoking, regular exercise, and postmenopausal state (in wom- en); dModel 4: adjusted as in model 3 plus hypertension, diabetes mel- litus, and hypercholesterolemia.
Table 4. Multiple Logistic Regression Analysis for Low Bone Mass
Variable OR (95% CI) P value
Age 1.053 (1.027–1.079) <0.001
Women 2.210 (1.326–3.683) 0.002
Body mass index 0.850 (0.788–0.918) <0.001 Amount of alcohol consumed 0.992 (0.982–1.001) 0.086
Smoking 1.386 (0.804–2.391) 0.241
Regular exercise 0.745 (0.481–1.152) 0.185 Serum GGT level
Tertile 1 Reference
Tertile 2 0.981 (0.584–1.651) 0.944 Tertile 3 2.271 (1.340–3.850) 0.002 Low bone mass: the lowest bone mineral density T-score among those measured at lumbar spine, femoral neck, and total hip ≤−1.0. Tertiles of serum GGT levels in men: tertile 1, ≤24 IU/L; tertile 2, 25–38 IU/
L; tertile 3, ≥39 IU/L. Tertiles of serum GGT level in women: tertile 1,
≤13 IU/L; tertile 2, 14–20 IU/L; tertile 3 ≥21 IU/L.
OR, odds ratio; CI, confidence interval; GGT, γ-glutamyl transferase.
for confounders such as alcohol consumption, which is a well- known factor associated with both elevated serum GGT level and low bone mass. Furthermore, we also demonstrated that the highest tertile of serum GGT level (≥39 IU/L in men and ≥21 IU/L in women) was associated with an increased risk for low bone mass including osteopenia and osteoporosis. These results suggest that GGT might negatively affect bone metabolism.
Several in vitro and in vivo studies have demonstrated that GGT can affect bone metabolism through systemic and local mechanisms [17-20]. It was shown that the GGT protein puri- fied from rat kidney effectively stimulates osteoclast formation in mouse bone marrow culture possibly via expression of RANKL in marrow stromal cells [17]. In addition, transgenic mice overexpressing GGT either systemically or locally in skel- etal tissue exhibit osteopenia and microstructural deterioration, which was attributable to both increased bone resorption and decreased bone formation as evidenced by histomorphometry [18]. Bone marrow cells from these mice exhibited significantly higher expression of transcription factors essential for osteo- clastogenesis such as c-fos, c-jun, and NFATc1. In that study, mutated GGT devoid of enzyme activity was also as potent as the wild-type molecule for inducing osteoclast formation, sug- gesting that GGT acts not as an enzyme but as a cytokine. GGT- deficient mice also exhibit a marked decrease in bone density along with other abnormalities including growth retardation, early mortality, and cataracts [19,21]. Osteopenia in GGT-defi- cient mice was attributable to both increased bone resorption and decreased bone formation. In these mice, restoration of cys- teine deficiency by N-acetylcysteine supplementation amelio- rated skeletal abnormalities, suggesting that abnormal cysteine metabolism in GGT-deficient mice might have caused the ab- normal skeletal phenotype [19]. A clinical study also suggested GGT as a marker of bone resorption in human subjects. It showed that urinary GGT excretion was highly correlated with deoxypyridinoline, an established biochemical marker of bone resorption, in a survey of postmenopausal women [20].
Taken together, both deficiency and excess GGT seem to be involved in abnormal bone metabolism, which results in de- creased bone mass. GGT seems to affect bone formation main- ly through its enzymatic activity on glutathione metabolism, and also affects bone resorption as a cytokine independent of enzymatic activity. However, GGT deficiency is a very rare au- tosomal recessive disease in a clinical setting, and only a few patients with this disease have been reported worldwide [22- 26]. In contrast, patients with excess GGT can easily be found, particularly among those who chronically consume alcohol or
those with hepatobiliary diseases. Therefore, excess GGT rather than deficiency is clinically relevant to the general health con- dition. In the present study, we also think excess GGT may ex- plain the inverse relationship between serum GGT and BMD.
As stated above, GGT also plays an important role in the in- tracellular antioxidant defense by maintaining glutathione ho- meostasis [27]. Cells increase expression of glutathione in re- sponse to oxidative stress, as this tripeptide removes oxidants [28,29]. Expression of several enzymes involved in glutathione homeostasis including GGT must be modulated to upregulate glutathione synthesis. Several experimental studies have dem- onstrated that GGT expression is increased in response to oxida- tive stress [30-32]. This result suggests that increased GGT con- centration could be a marker of oxidative stress that is known to play a role in the development of many pathological conditions such as cancer, diabetes mellitus, atherosclerosis, neurodegen- erative diseases, and rheumatoid arthritis [33,34]. Oxidative stress is also known to affect bone metabolism and have an in- verse association with bone mass [35,36]. Several experimental studies have shown that oxidative stress enhances osteoclastic activity [37], while inhibiting osteoblastic differentiation [38].
Therefore, serum GGT level as a marker of oxidative stress may have an inverse relationship with bone mass, as found in the present study. Abnormal bone metabolism associated with liver diseases may also explain the association between bone and GGT in this study. Serum level of GGT is a well-known marker of hepatobiliary disease. In the present study, serum levels of AST and ALT also increased with elevating serum GGT level.
There have been studies that demonstrated chronic liver diseas- es may have negative effects on bone [39].
The present study had several limitations. First, because it was a cross-sectional observational study, the associations found are not proof of causal relationships and might be con- founded by many unmeasured and unaccounted for variables even after multiple adjustments. Second, we did not measure estrogen levels, which may play a role in the relationship be- tween serum GGT and BMD, particularly in women. In a pre- vious study, oral contraceptive use and menopause were associ- ated with increased serum GGT levels [40], suggesting that es- trogens, a well-known determinant of bone mass, might also be a factor that affects serum GGT levels. Third, we did not mea- sure bone turnover markers. Therefore, we could not determine how serum GGT is clinically associated with bone turnover.
In conclusion, we showed that serum GGT level was in- versely associated with BMD in Korean adults and that excess GGT level was associated with increased risk for low bone
mass. Further studies are necessary to investigate the effect of GGT on bone among those with increased serum GGT level such as individuals with chronic alcoholism or hepatobiliary diseases.
CONFLICTS OF INTEREST
No potential conflict of interest relevant to this article was re- ported.
ACKNOWLEDGMENTS
This study was supported by the Dongguk University Research Fund 2011.
REFERENCES
1. Zhang H, Forman HJ, Choi J. Gamma-glutamyl transpepti- dase in glutathione biosynthesis. Methods Enzymol 2005;401:
468-83.
2. Taniguchi N, Ikeda Y. Gamma-glutamyl transpeptidase:
catalytic mechanism and gene expression. Adv Enzymol Relat Areas Mol Biol 1998;72:239-78.
3. Lee DH, Silventoinen K, Jacobs DR Jr, Jousilahti P, Tuomi- leto J. gamma-Glutamyltransferase, obesity, and the risk of type 2 diabetes: observational cohort study among 20,158 middle-aged men and women. J Clin Endocrinol Metab 2004;89:5410-4.
4. Lee DH, Jacobs DR Jr, Gross M, Kiefe CI, Roseman J, Lewis CE, et al. Gamma-glutamyltransferase is a predictor of incident diabetes and hypertension: the Coronary Artery Risk Development in Young Adults (CARDIA) Study. Clin Chem 2003;49:1358-66.
5. Fraser A, Harris R, Sattar N, Ebrahim S, Smith GD, Lawlor DA. Gamma-glutamyltransferase is associated with incident vascular events independently of alcohol intake: analysis of the British Women’s Heart and Health Study and Meta- Analysis. Arterioscler Thromb Vasc Biol 2007;27:2729-35.
6. Lee DS, Evans JC, Robins SJ, Wilson PW, Albano I, Fox CS, et al. Gamma glutamyl transferase and metabolic syn- drome, cardiovascular disease, and mortality risk: the Framingham Heart Study. Arterioscler Thromb Vasc Biol 2007;27:127-33.
7. Meisinger C, Doring A, Schneider A, Lowel H; KORA Study Group. Serum gamma-glutamyltransferase is a pre- dictor of incident coronary events in apparently healthy men
from the general population. Atherosclerosis 2006;189:297- 302.
8. Ruttmann E, Brant LJ, Concin H, Diem G, Rapp K, Ulmer H, et al. Gamma-glutamyltransferase as a risk factor for cardiovascular disease mortality: an epidemiological inves- tigation in a cohort of 163,944 Austrian adults. Circulation 2005;112:2130-7.
9. Lee DH, Ha MH, Kim JH, Christiani DC, Gross MD, Stef- fes M, et al. Gamma-glutamyltransferase and diabetes: a 4 year follow-up study. Diabetologia 2003;46:359-64.
10. Meisinger C, Lowel H, Heier M, Schneider A, Thorand B;
KORA Study Group. Serum gamma-glutamyltransferase and risk of type 2 diabetes mellitus in men and women from the general population. J Intern Med 2005;258:527-35.
11. Jousilahti P, Rastenyte D, Tuomilehto J. Serum gamma- glutamyl transferase, self-reported alcohol drinking, and the risk of stroke. Stroke 2000;31:1851-5.
12. Nakanishi N, Suzuki K, Tatara K. Serum gamma-glutamyl- transferase and risk of metabolic syndrome and type 2 diabetes in middle-aged Japanese men. Diabetes Care 2004;27:1427- 32.
13. Andre P, Balkau B, Vol S, Charles MA, Eschwege E; DE- SIR Study Group. Gamma-glutamyltransferase activity and development of the metabolic syndrome (International Diabe- tes Federation Definition) in middle-aged men and women:
Data from the Epidemiological Study on the Insulin Resistance Syndrome (DESIR) cohort. Diabetes Care 2007;30:2355-61.
14. Wannamethee G, Ebrahim S, Shaper AG. Gamma-glutam- yltransferase: determinants and association with mortality from ischemic heart disease and all causes. Am J Epidemiol 1995;142:699-708.
15. Wu G, Fang YZ, Yang S, Lupton JR, Turner ND. Glutathione metabolism and its implications for health. J Nutr 2004;134:
489-92.
16. Zaidi M. Skeletal remodeling in health and disease. Nat Med 2007;13:791-801.
17. Niida S, Kawahara M, Ishizuka Y, Ikeda Y, Kondo T, Hibi T, et al. Gamma-glutamyltranspeptidase stimulates receptor activator of nuclear factor-kappaB ligand expression inde- pendent of its enzymatic activity and serves as a pathologi- cal bone-resorbing factor. J Biol Chem 2004;279:5752-6.
18. Hiramatsu K, Asaba Y, Takeshita S, Nimura Y, Tatsumi S, Katagiri N, et al. Overexpression of gamma-glutamyltrans- ferase in transgenic mice accelerates bone resorption and causes osteoporosis. Endocrinology 2007;148:2708-15.
19. Levasseur R, Barrios R, Elefteriou F, Glass DA 2nd, Li-
eberman MW, Karsenty G. Reversible skeletal abnormali- ties in gamma-glutamyl transpeptidase-deficient mice. En- docrinology 2003;144:2761-4.
20. Asaba Y, Hiramatsu K, Matsui Y, Harada A, Nimura Y, Kata- giri N, et al. Urinary gamma-glutamyltransferase (GGT) as a potential marker of bone resorption. Bone 2006;39:1276-82.
21. Lieberman MW, Wiseman AL, Shi ZZ, Carter BZ, Barrios R, Ou CN, et al. Growth retardation and cysteine deficiency in gamma-glutamyl transpeptidase-deficient mice. Proc Natl Acad Sci U S A 1996;93:7923-6.
22. Ristoff E, Larsson A. Inborn errors in the metabolism of glutathione. Orphanet J Rare Dis 2007;2:16.
23. Goodman SI, Mace JW, Pollack S. Serum gamma-glutamyl transpeptidase deficiency. Lancet 1971;1:234-5.
24. Wright EC, Stern J, Ersser R, Patrick AD. Glutathionuria:
gamma-glutamyl transpeptidase deficiency. J Inherit Metab Dis 1980;2:3-7.
25. Hammond JW, Potter M, Wilcken B, Truscott R. Siblings with gamma-glutamyltransferase deficiency. J Inherit Metab Dis 1995;18:82-3.
26. Iida M, Yasuhara T, Mochizuki H, Takakura H, Yanagisawa T, Kubo H. Two Japanese brothers with hereditary gamma- glutamyl transpeptidase deficiency. J Inherit Metab Dis 2005;28:49-55.
27. Lee DH, Blomhoff R, Jacobs DR Jr. Is serum gamma glu- tamyltransferase a marker of oxidative stress? Free Radic Res 2004;38:535-9.
28. Darley-Usmar VM, Severn A, O’Leary VJ, Rogers M.
Treatment of macrophages with oxidized low-density lipo- protein increases their intracellular glutathione content.
Biochem J 1991;278(Pt 2):429-34.
29. Deneke SM, Baxter DF, Phelps DT, Fanburg BL. Increase in endothelial cell glutathione and precursor amino acid up- take by diethyl maleate and hyperoxia. Am J Physiol 1989;257(4 Pt 1):L265-71.
30. Takahashi Y, Oakes SM, Williams MC, Takahashi S, Miura T, Joyce-Brady M. Nitrogen dioxide exposure activates
gamma-glutamyl transferase gene expression in rat lung.
Toxicol Appl Pharmacol 1997;143:388-96.
31. Kugelman A, Choy HA, Liu R, Shi MM, Gozal E, Forman HJ. Gamma-glutamyl transpeptidase is increased by oxida- tive stress in rat alveolar L2 epithelial cells. Am J Respir Cell Mol Biol 1994;11:586-92.
32. Markey CM, Rudolph DB, Labus JC, Hinton BT. Oxidative stress differentially regulates the expression of gamma-glu- tamyl transpeptidase mRNAs in the initial segment of the rat epididymis. J Androl 1998;19:92-9.
33. Droge W. Free radicals in the physiological control of cell function. Physiol Rev 2002;82:47-95.
34. Rosen P, Nawroth PP, King G, Moller W, Tritschler HJ, Packer L. The role of oxidative stress in the onset and pro- gression of diabetes and its complications: a summary of a Congress Series sponsored by UNESCO-MCBN, the American Diabetes Association and the German Diabetes Society. Diabetes Metab Res Rev 2001;17:189-212.
35. Basu S, Michaelsson K, Olofsson H, Johansson S, Melhus H. Association between oxidative stress and bone mineral density. Biochem Biophys Res Commun 2001;288:275-9.
36. Grassi F, Tell G, Robbie-Ryan M, Gao Y, Terauchi M, Yang X, et al. Oxidative stress causes bone loss in estrogen-defi- cient mice through enhanced bone marrow dendritic cell activation. Proc Natl Acad Sci U S A 2007;104:15087-92.
37. Garrett IR, Boyce BF, Oreffo RO, Bonewald L, Poser J, Mundy GR. Oxygen-derived free radicals stimulate osteo- clastic bone resorption in rodent bone in vitro and in vivo. J Clin Invest 1990;85:632-9.
38. Mody N, Parhami F, Sarafian TA, Demer LL. Oxidative stress modulates osteoblastic differentiation of vascular and bone cells. Free Radic Biol Med 2001;31:509-19.
39. Collier J. Bone disorders in chronic liver disease. Hepatolo- gy 2007;46:1271-8.
40. Nilssen O, Forde OH, Brenn T. The Tromso Study. Distri- bution and population determinants of gamma-glutamyl- transferase. Am J Epidemiol 1990;132:318-26.