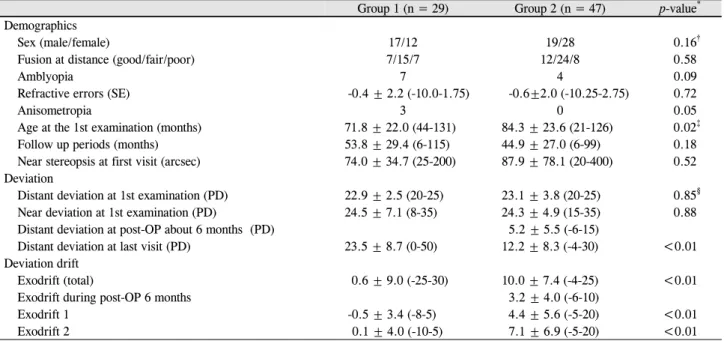
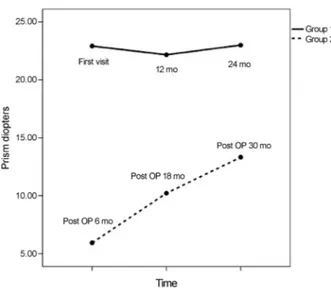
Comparison of Exodrift between Natural Group and Postoperative Group in Intermittent Exotropia Patients
전체 글
수치


관련 문서
<Table 5> Difference of limb load asymmetry, postural sway and lumbar flexibility between control group and experimental group(In case
Comparison of mean and standard deviation of capnographic I:E ratio between normal breathing status and respiratory depression status in 21 patients experienced
First, after the Group Art Therapy, the scale of hopelessness depression in the test group decreased significantly in comparison with that before the group
Comparison of the prevalence of Malnutrition and Overweight, Obesity between South Korean families and North Korean refugees families 15 Table 5.. Comparison of the
Diagrams show the spatial distribution of individual trees and stand profile(a), crown projection(b) for Group of Quercus glauca... The comparison of
2) In between-group comparison before and after elastic band exercise, a significant difference was found in the percentage of body fat, fat-free
Results: In this research, in the group with fibromyalgia patients group, systemic lupus erythematosus patients group and without systemic autoimmune
Figure 6.23 Comparison of the average absorption coefficient between the honeycomb panel and HMPP for a 25-mm core thickness.. 174 Figure 6.24 Comparison of STL between