Introduction
Ovarian cancer is the most lethal gynecologic malignancy with more than 130,000 deaths every year worldwide [1].
It is called a silent killer, spreading asymptomatically within the abdominal cavity. Most patients are diagnosed when the cancer is in the advanced stages and they exhibit poor prog- nosis, with a 5-year overall survival (OS) rate of 30% at stag- es III and IV [1]. The treatment of advanced ovarian cancer remains a critical challenge for clinicians. The primary treat- ment consists of cytoreductive surgery and chemotherapy.
Serum lactate dehydrogenase is a possible predictor of platinum resistance in ovarian cancer
Asami Ikeda, MD
1, Ken Yamaguchi, MD, PhD
1,2,3, Hajime Yamakage, MEng
3, Kaoru Abiko MD, PhD
1, Noriko Satoh-Asahara, MD, PhD
3, Kenji Takakura, MD, PhD
1, Ikuo Konishi, MD, PhD
11Department of Obstetrics and Gynecology, National Hospital Organization Kyoto Medical Center; 2Department of Gynecology and Obstetrics, Kyoto University Graduate School of Medicine; 3Department of Endocrinology, Metabolism, and Hypertension, Clinical Research Institute, National Hospital Organization Kyoto Medical Center, Kyoto, Japan
Objective
The need for tailoring ovarian cancer treatments to individual patients is increasing. This study aimed to evaluate the prognostic value of pretreatment laboratory test data for predicting the response and survival outcomes of platinum- based chemotherapy in ovarian cancer.
Methods
We enrolled 270 patients with ovarian cancer diagnosed at the Kyoto Medical Center (n=120; group A) and Kyoto University (n=150; group B). Data on 9 blood parameters (neutrophil to lymphocyte ratio [NLR], platelet to lymphocyte rate [PLR], C-reactive protein, lactate dehydrogenase [LDH], glucose, total cholesterol, high-density lipoprotein [HDL], low-density lipoprotein, and triglyceride levels), cancer pathology, cancer stage, cytoreduction outcomes, serum cancer antigen 125 levels, platinum-free interval (PFI), disease-free survival (DFS), and overall survival were assessed retrospectively.
Results
NLR, PLR, LDH, and HDL were significantly different in advanced stage patients (P<0.001, <0.001, 0.029, and <0.001, respectively). The Kaplan-Meier curves revealed that high LDH level (≥250 U/L) was associated with reduced PFI (P=0.037 and 0.012) and DFS (P=0.007 and 0.002) in groups A and B, respectively. High NLR (≥4) was associated with reduced DFS in both groups (P=0.036 and 0.005, respectively). LDH showed higher area under the curve (AUC) values in predicting platinum resistance with a PFI of less than 6 months and 12 months (AUC=0.606 and 0.646, respectively) than NLR. In the multivariate analysis, LDH remained significant (P=0.019) after adjusting for the 9 blood parameters.
Conclusion
Serum LDH level may possibly predict platinum resistance and prognosis in ovarian cancer and may be useful when developing precision medicine for individual patients.
Keywords: Ovarian cancer; Serum; Lactate dehydrogenase; Platinum; Chemotherapy
Received: 2020.04.30. Revised: 2020.07.18. Accepted: 2020.08.02.
Corresponding author: Ken Yamaguchi, MD, PhD
Department of Gynecology and Obstetrics, Kyoto University Graduate School of Medicine, 54 Kawahara-cho, Shogoin, Sakyo- ku, Kyoto 606-8507, Japan
E-mail: [email protected] https://orcid.org/0000-0002-7669-1405
Articles published in Obstet Gynecol Sci are open-access, distributed under the terms of the Creative Commons Attribution Non-Commercial License (http://creativecommons.
org/licenses/by-nc/3.0/) which permits unrestricted non-commercial use, distribution, and reproduction in any medium, provided the original work is properly cited.
Copyright © 2020 Korean Society of Obstetrics and Gynecology https://doi.org/10.5468/ogs.20117
pISSN 2287-8572 · eISSN 2287-8580
The complete removal of tumor through surgery is key to better disease prognosis [2]. Platinum sensitivity is also one of the important prognostic factors. A platinum-based chemo- therapy is commonly administered as chemotherapy in pa- tients with residual tumor and as adjuvant chemotherapy in those with ovarian cancer. Platinum-sensitive recurrent ovar- ian cancer is associated with a median patient survival period of 2 years; it responds to additional platinum-based chemo- therapy, with a response rate ranging from 30% to 90% [3].
Platinum-resistant ovarian cancer, however, has a median patient survival period of less than 1 year, and response to subsequent chemotherapy is noted only in less than 15% of the cases.
Ovarian cancer is a heterogeneous tumor, and the clinical outcome is variable. Its heterogeneity is characterized ac- cording to the biological and molecular profiles, as well as to the anatomical origin and histological subtype. Therefore, the need to establish individual therapeutic strategies for the management of ovarian cancer is increasing. Blood and im- aging tests are used as pretreatment tests. Image scanning, used for diagnosing the clinical cancer stage, is mainly based on the anatomical information, and the biological heteroge- neity is not considered. Thus, the staging system alone is not sufficient to predict the biological behaviors of a heteroge- neous ovarian cancer. Blood tests may be used to predict the response of the host as well as the biological profile of the tumor itself. Therefore, identification of more prognostic fac- tors is essential for tailoring the treatment to individual pa- tients. This study aimed to evaluate the role of laboratory test data obtained prior to treatment for predicting the response and survival outcomes of platinum-based chemotherapy in patients with ovarian cancer.
Materials and methods
1. Study design
The study participants were women diagnosed with primary epithelial ovarian cancer (EOC) at Kyoto Medical Center between January 2012 and December 2017 (group A). All women diagnosed with EOC at Kyoto University Hospital between January 2012 and December 2017 comprised the external-validation set (group B). The patients’ electronic medical records were reviewed; the relevant clinical informa- tion, such as age, International Federation of Gynecology
and Obstetrics (FIGO) stage, histology, cytoreduction out- comes (R0, R1, vs. R2), serum cancer antigen 125 (CA125) levels, data on 9 pretreatment laboratory parameters (neu- trophil to lymphocyte ratio [NLR], platelet to lymphocyte rate [PLR], C-reactive protein [CRP], lactate dehydrogenase [LDH], glucose, total cholesterol [TC], high-density lipoprotein [HDL]-cholesterol, low-density lipoprotein [LDL]-cholesterol, and triglyceride [TG] levels), date of treatment initiation, date of progression or recurrence, date of last follow-up, and pa- tients’ disease status at last contact, were collected. These 9 pretreatment laboratory parameters were evaluated because they are related with inflammation and lipid or glucose me- tabolism, which had been associated with cancer progres- sion. All patients were followed-up until death or until May 31, 2019. All blood samples were collected before treatment.
NLR was defined as the absolute neutrophil count divided by the absolute lymphocyte count. PLR was defined as the absolute platelet count divided by the absolute lymphocyte count. LDL was estimated using the Friedewald formula. R0 was defined as the absence of macroscopic residual tumor after a cytoreduction surgery. R1 was defined as a maximal residual tumor diameter of <1 cm after cytoreduction. R2 was defined as a maximal residual tumor diameter of ≥1 cm.
2. Statistical analyses
The association between the baseline clinicopathologic char- acteristics and 9 pretreatment laboratory parameters was evaluated using ordinary one-way analysis of variance and Student’s t-test. Platinum-free interval (PFI) was defined as the time when the patient was cancer free after receiving a platinum-based chemotherapy. Disease-free survival (DFS) was calculated as the time the patient was cancer free after receiving a particular treatment. OS was calculated as the duration from the date of first treatment until death or the last follow-up. The Kaplan-Meier method was used for the analysis of the PFI, DFS, and OS, while log-rank tests were used in the univariate and multivariate analyses. A χ2 test for trend was used to examine the relationships between levels of LDH and NLR and recurrence. The cut-off values to predict platinum resistance was determined using receiver operat- ing characteristic curves. Cox proportional hazard models were applied to evaluate the predictors of platinum resis- tance and survival in the multivariate analysis. A multivariate logistic regression model was used to assess the association
between the 9 blood parameters and platinum resistance.
We sequentially introduced some variables into the model, such as group, age, FIGO stage, histological type, and cyto- reduction outcome, because these factors were known to be associated with the survival of ovarian cancer patients.
We analyzed groups A and B separately based on PFI, DFS, and OS, whereas we analyzed the 2 groups together based on the other parameters. Statistical analyses were performed using Prism 8 (GraphPad Software, La Jolla, CA, USA). Multi- variate analyses were performed using SPSS version 22.0 for Windows (IBM Japan, Ltd., Tokyo, Japan). A P-value of <0.05 was considered significant.
Results
1. Patient characteristics and their correlations with the 9 blood parameters
A total of 270 women were included in the current analysis, with 120 women in group A and 150 women in group B. Be- cause the platinum-based regimens were only administered in 223 out of 270 patients, all 270 patients were included in
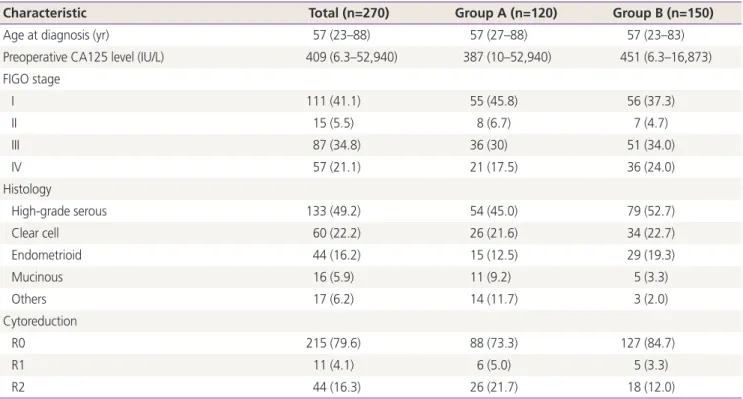
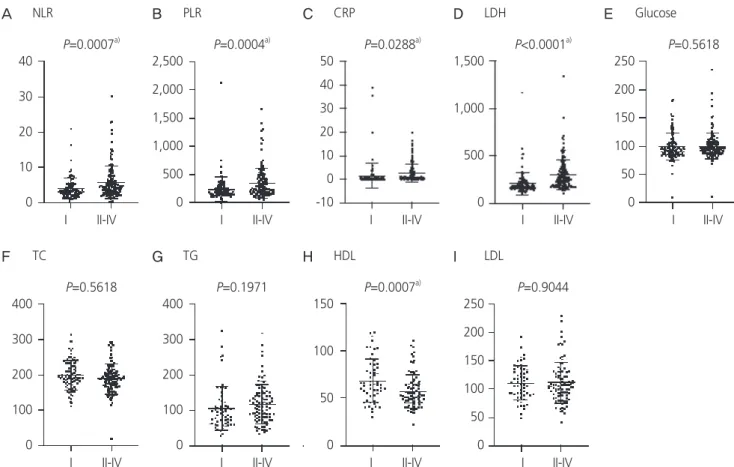
the analyses of DFS, while 223 were included in the analysis of PFI. The median age of the studied population was 57 years (range: 23–88 years). Most patients (n=144, 55.9%) were diagnosed at advanced stage (FIGO stage III or IV), and the most common pathological type was high-grade serous carcinoma (n=133, 49.2%). The patient characteristics are shown in Table 1. The correlations between patients’ clinical characteristics and the 9 pretreatment laboratory parameters are summarized in Fig. 1 and Supplementary Table 1. NLR, PLR, CRP, and LDH were increased in patients with FIGO stage II–IV (P<0.001, <0.001, 0.029, and <0.001, respec- tively; Fig. 1A-D). By contrast, HDL was significantly lower in patients with advanced stages (P<0.001; Fig. 1H). No signifi- cant differences were observed in glucose, TC, TG, and LDL levels (Fig. 1E-G and I). With regard to the histological type, a significant difference was observed in the LDH and glucose levels (P=0.041; Supplementary Fig. 1D and E). Patients with high-grade serous carcinoma showed higher LDH levels than those with other histological types, such as clear cell carci- noma (P=0.009), endometrioid carcinoma (P=0.002), and mucinous carcinoma (P=0.006). There was a statistically posi- tive correlation between CA125 and NLR, PLR, CRP, and LDH
Table 1. Patient characteristics
Characteristic Total (n=270) Group A (n=120) Group B (n=150)
Age at diagnosis (yr) 57 (23–88) 57 (27–88) 57 (23–83)
Preoperative CA125 level (IU/L) 409 (6.3–52,940) 387 (10–52,940) 451 (6.3–16,873)
FIGO stage
I 111 (41.1) 55 (45.8) 56 (37.3)
II 15 (5.5) 8 (6.7) 7 (4.7)
III 87 (34.8) 36 (30) 51 (34.0)
IV 57 (21.1) 21 (17.5) 36 (24.0)
Histology
High-grade serous 133 (49.2) 54 (45.0) 79 (52.7)
Clear cell 60 (22.2) 26 (21.6) 34 (22.7)
Endometrioid 44 (16.2) 15 (12.5) 29 (19.3)
Mucinous 16 (5.9) 11 (9.2) 5 (3.3)
Others 17 (6.2) 14 (11.7) 3 (2.0)
Cytoreduction
R0 215 (79.6) 88 (73.3) 127 (84.7)
R1 11 (4.1) 6 (5.0) 5 (3.3)
R2 44 (16.3) 26 (21.7) 18 (12.0)
Values are presented as median (range) or number (%).
CA125, cancer antigen 125; FIGO, International Federation of Gynecology and Obstetrics.
(P<0.001, 0.045, 0.003, and 0.022, respectively; Supplemen- tary Table 1).
2. Association of 9 blood parameters with survival analysis, including platinum resistance
In group A, the median follow-up time was 36 (range: 0–84) months; approximately 42.5% (51/120) of the patients ex- perienced cancer progression or recurrence, while 23.3%
(28/120) died due to cancer progression. The remaining pa- tients survived. In group B, the median follow-up time was 38 (range: 0–86) months; approximately 44.6% (67/150) of the patients experienced cancer progression or recurrence, while 16% (24/150) died as a result of cancer progression.
Only LDH and NLR displayed a significant difference in the survival analysis of groups A and B. For group A, the Kaplan- Meier curves depicted that a high LDH level (≥250 U/L) was associated with reduced PFI (P=0.037) and DFS (P=0.007)
(Fig. 2A and B). In group B, a high LDH level (≥250 U/L) was also associated with reduced PFI (P=0.012) and DFS (P=0.002;
Fig. 2D and E). A high NLR (≥4) was associated with reduced PFI (P=0.024) in group B (Fig. 3D) and reduced DFS in groups A and B (P=0.036 and 0.005, respectively; Fig. 3B and E).
However, no significant differences were observed in the LDH level in groups A and B and NLR in group A in terms of OS (Fig. 2C and F, and Fig. 3C). In group B, high PLR (≥200), CRP level (≥1.0 mg/dL), and TC level (≥200 mg/dL) were associated with reduced PFI (P=0.048, <0.001, and 0.009, respectively), DFS (P=0.029, <0.001 and 0.028, respectively), and OS (P=0.008, <0.001, and 0.010, respectively); however, significant differences were not noted in group A (Supple- mentary Figs. 2-4). Next, we examined whether evaluating both LDH and NLR has a superior predictive accuracy for recurrence rather than using a single variable. Patients with high LDH and NLR exhibited the most frequent recurrence
Fig. 1. Association between International Federation of Gynecology and Obstetrics stage and blood data. This figure presents the dif- ferences in the blood data of patients with early-stage (I) and advanced-stage (II/III/IV) cancer. NLR, neutrophil to lymphocyte ratio; PLR, platelet to lymphocyte rate; CRP, C-reactive protein; LDH, lactate dehydrogenase; TC, total cholesterol; TG, triglyceride; HDL, high-density lipoprotein; LDL, low-density lipoprotein. a)P<0.05.
P=0.0007a)
P=0.5618
P=0.0004a)
P=0.1971
P=0.0288a)
P=0.0007a)
P<0.0001a)
P=0.9044
P=0.5618
I
I
I
I
I
I
I
I
I II-IV
II-IV
II-IV
II-IV
II-IV
II-IV
II-IV
II-IV
II-IV NLR
TC
PLR
TG
CRP
HDL
LDH
LDL
Glucose
40
30
20
10
0
400
300
200
100
0
2,500 2,000 1,500 1,000 500 0
400
300
200
100
0
50 40 30 20 10 0 -10
150
100
50
0
1,500
1,000
500
0
250 200 150 100 50 0
250 200 150 100 50 0 A
F
B
G
C
H
D
I
E
Fig. 2. Kaplan-Meier curve for the platinum-free interval (PFI), disease-free survival (DFS), and overall survival (OS) stratified by lactate de- hydrogenase (LDH) level. The upper 3 panels and lower 3 panels show the Kaplan-Meier curves for the PFI, DFS, and OS in groups A and B, respectively. Dotted lines depict high LDH levels (≥250 U/L), while solid lines depict low LDH levels (<250 U/L). a)P<0.05.
Group A
Group B A
D
B
E
C
F
Platinum-free interval Platinum-free interval Disease-free survival Disease-free survival Overall survival Overall survival
100
50
0
100
50
0
100
50
0
100
50
0
100
50
0
100
50
0 0 20 40 60 80 100
Time (month)
0 20 40 60 80
Time (month)
0 20 40 60 80 100 Time (month)
0 20 40 60 80
Time (month)
0 20 40 60 80 100 Time (month)
0 20 40 60 80 100 Time (month)
Low LDH (<250)
Low LDH (<250)
Low LDH (<250)
Low LDH (<250)
Low LDH (<250)
Low LDH (<250) P=0.037a)
P=0.012a)
P=0.007a)
P=0.002a)
P=0.066
P=0.860 High LDH (≥250)
High LDH (≥250)
High LDH (≥250)
High LDH (≥250)
High LDH (≥250)
High LDH (≥250)
Fig. 3. Kaplan-Meier curve for the platinum-free interval (PFI), disease-free survival (DFS) and overall survival (OS) stratified by neutrophil to lymphocyte ratio (NLR). The upper 3 panels and lower 3 panels show the Kaplan-Meier curves for the PFI, DFS, and OS in groups A and B, respectively. Dotted lines depict high NLR (≥4), while solid lines depict low NLR (<4). a)P<0.05.
Group A
Group B A
D
B
E
C
F
Platinum-free interval Platinum-free interval Disease-free survival Disease-free survival Overall survival Overall survival
100
50
0
100
50
0
100
50
0
100
50
0
100
50
0
100
50
0 0 20 40 60 80 100
Time (month)
0 20 40 60 80
Time (month)
0 20 40 60 80 100 Time (month)
0 20 40 60 80
Time (month)
0 20 40 60 80 100 Time (month)
0 20 40 60 80 100 Time (month)
Low NLR (<4)
Low NLR (<4)
Low NLR (<4)
Low NLR (<4)
Low NLR (<4)
High NLR (≥4) P=0.226
P=0.024a)
P=0.036a)
P=0.005a)
P=0.371
P=0.006a) High NLR (≥4)
High NLR (≥4)
High NLR (≥4)
High NLR (≥4)
High NLR (≥4)
Low NLR (<4)
compared with those with high LDH or high NLR, and those with low LDH and low NLR (Table 2).
3. Predictive value of platinum resistance by receiver operating characteristic analysis
As LDH and NLR were considered as predictive factors of platinum resistance, platinum sensitivity was assessed using LDH and NLR. We divided patients who received platinum- based chemotherapy into “platinum-sensitive group,”
“platinum partially resistant group,” and “platinum-resistant group.” The platinum-resistant group included patients with cancer progression during the course of platinum-based che- motherapy or recurrence with a PFI of less than 6 months.
Patients with a PFI of more than 12 months were denoted as platinum sensitive, whereas those with PFI between 6 and 12 months were considered as platinum partially resistant. Of 223 patients who received platinum-based chemotherapy, 150 (67.26%) were platinum sensitive, 35 (15.70%) were
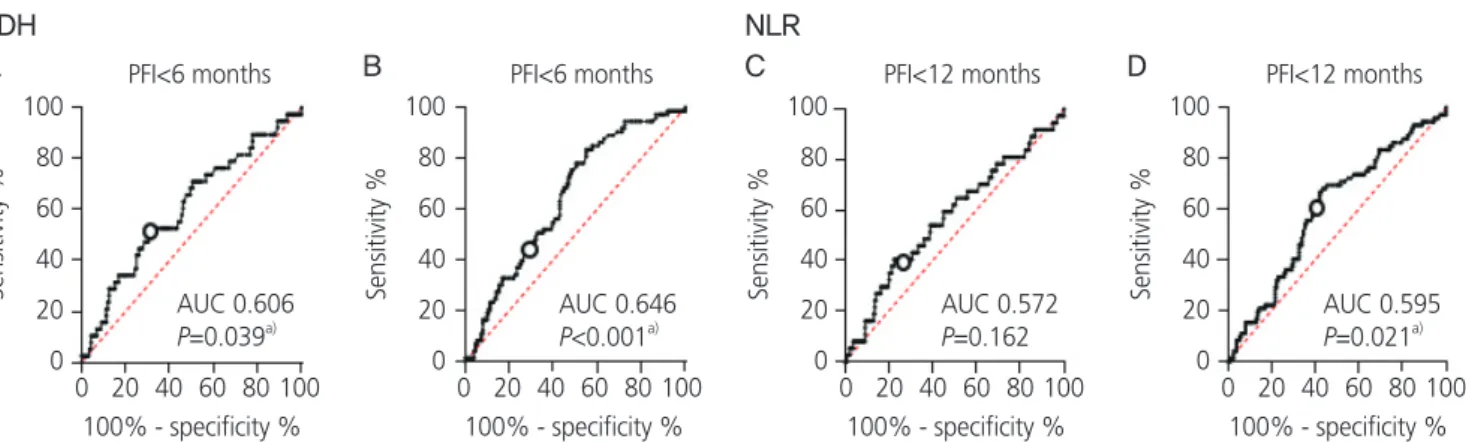
platinum partially resistant, and 38 (17.04%) were platinum resistant. The area under the curve (AUC), sensitivity, and specificity of LDH ≥250 U/L to predict whether the patients were “platinum resistant,” “platinum partially resistant,” and
“platinum sensitive” were 0.606 (P=0.039), 52.63%, and 63.04%, respectively (Fig. 4A).
The AUC, sensitivity, and specificity of LDH ≥250 U/L for predicting whether the patients were “platinum resistant”
and “platinum partially resistant” or “platinum sensitive were 0.646 (P<0.001), 50.68%, and 65.77%, respectively (Fig. 4B). As for NLR, the cut-off value for predicting whether the patients were “platinum resistant” and platinum partially resistant” or “platinum sensitive” was 4.0, and the AUC was 0.5957 (P=0.021, Fig. 4D).
4. Univariate and multivariate analyses of platinum- free interval
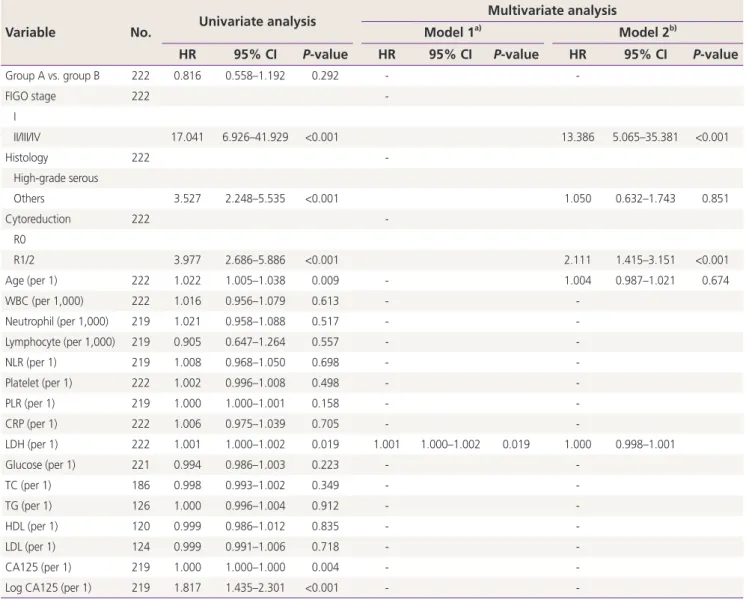
The Cox regression univariate analysis of PFI showed that age, FIGO stage, histological type, and cytoreduction out- come, LDH, and serum CA125 were significant prognostic factors (P=0.009, <0.001, <0.001, <0.001, 0.019, and 0.004, respectively; Table 3). In the multivariate analysis with adjust- ments for blood data excluding CA125, only LDH remained highly significant (P=0.019), although stage and cytoreduc- tion outcome were independent predictors of a poorer PFI after adjustments for group, age, FIGO stage, histological type, and cytoreduction outcome (P<0.001 and <0.001, re- spectively; Table 3).
Table 2. Recurrent frequency according to lactate dehydrogenase (LDH) and neutrophil to lymphocyte ratio (NLR) levels
Characteristic Recurrence No
recurrence High LDH (≥250) and low NLR (≥4) 37 21 High LDH (≥250) or high NLR (≥4) 46 37 Low LDH (<250) and low NLR (<4) 27 51 Chi-square test for trend: P<0.001.
Fig. 4. Receiver-operating characteristic curves for lactate dehydrogenase (LDH) and neutrophil to lymphocyte ratio (NLR) based on the platinum-free interval (PFI). The area under the curve (AUC), sensitivity, and specificity for an LDH level ≥250 U/L with a PFI of less than 6 months were 0.606 (P=0.039), 52.63%, and 63.04%, respectively. Meanwhile, the AUC, sensitivity, and specificity with a PFI of 12 months were 0.646 (P<0.001), 50.68%, and 65.77%, respectively. The AUCs for NLR ≥4 predicting the PFI at less than 6 and 12 months were 0.572 (P=0.162) and 0.595 (P=0.021), respectively. a)P<0.05.
Sensitivity % Sensitivity % Sensitivity % Sensitivity %
100 80 60 40 20 0
100 80 60 40 20 0
100 80 60 40 20 0
100 80 60 40 20 0
PFI<6 months PFI<6 months PFI<12 months PFI<12 months
AUC 0.606
P=0.039a) AUC 0.646
P<0.001a) AUC 0.572
P=0.162 AUC 0.595
P=0.021a) 0 20 40 60 80 100
100% - specificity %
0 20 40 60 80 100 100% - specificity %
0 20 40 60 80 100 100% - specificity %
0 20 40 60 80 100 100% - specificity %
LDH NLR
A B C D
Discussion
LDH is one of the major enzymes used in glycolysis, which can reversibly catalyze the conversion of pyruvate to lactic acid. LDH exists inside the cell. When the cells are damaged, it is released into the bloodstream, which causes an increase in its concentration [4]. In clinical practice, the level of LDH in the serum is largely measured in patients with suspected organ damage or dysfunction such as myocardial infarction,
acute hepatitis, and hemolytic anemia. As for neoplastic disease, serum LDH increases in patients with tumor growth and tissue destruction, establishing the survival duration and rate in those with Hodgkin’s disease and non-Hodgkin’s lym- phoma [5]. In the last few decades, the prognostic values of serum LDH have been extensively studied in common tumors such as gastric, colorectal, breast, renal, and liver cancer [6].
In ovarian cancer, serum LDH may serve as a reliable marker to discriminate ovarian carcinoma from benign ovarian tu-
Table 3. Univariate and multivariate Cox proportional analysis for the platinum-free interval
Variable No. Univariate analysis Multivariate analysis
Model 1a) Model 2b)
HR 95% CI P-value HR 95% CI P-value HR 95% CI P-value
Group A vs. group B 222 0.816 0.558–1.192 0.292 - -
FIGO stage 222 -
I
II/III/IV 17.041 6.926–41.929 <0.001 13.386 5.065–35.381 <0.001
Histology 222 -
High-grade serous
Others 3.527 2.248–5.535 <0.001 1.050 0.632–1.743 0.851
Cytoreduction 222 -
R0
R1/2 3.977 2.686–5.886 <0.001 2.111 1.415–3.151 <0.001
Age (per 1) 222 1.022 1.005–1.038 0.009 - 1.004 0.987–1.021 0.674
WBC (per 1,000) 222 1.016 0.956–1.079 0.613 - -
Neutrophil (per 1,000) 219 1.021 0.958–1.088 0.517 - -
Lymphocyte (per 1,000) 219 0.905 0.647–1.264 0.557 - -
NLR (per 1) 219 1.008 0.968–1.050 0.698 - -
Platelet (per 1) 222 1.002 0.996–1.008 0.498 - -
PLR (per 1) 219 1.000 1.000–1.001 0.158 - -
CRP (per 1) 222 1.006 0.975–1.039 0.705 - -
LDH (per 1) 222 1.001 1.000–1.002 0.019 1.001 1.000–1.002 0.019 1.000 0.998–1.001
Glucose (per 1) 221 0.994 0.986–1.003 0.223 - -
TC (per 1) 186 0.998 0.993–1.002 0.349 - -
TG (per 1) 126 1.000 0.996–1.004 0.912 - -
HDL (per 1) 120 0.999 0.986–1.012 0.835 - -
LDL (per 1) 124 0.999 0.991–1.006 0.718 - -
CA125 (per 1) 219 1.000 1.000–1.000 0.004 - -
Log CA125 (per 1) 219 1.817 1.435–2.301 <0.001 - -
Bold words represent statistical significance.
HR, hazard ratio; CI, confidence ratio; FIGO, International Federation of Gynecology and Obstetrics; WBC, white blood cell count; NLR, neu- trophil to lymphocyte ratio; PLR, platelet to lymphocyte rate; CRP, C-reactive protein; LDH, lactate dehydrogenase; TC, total cholesterol; TG, triglyceride; HDL, high-density lipoprotein; LDL, low-density lipoprotein; CA125, cancer antigen 125.
a)Adjusted for blood data; b)Adjusted for blood data and clinical characteristics (group, age, FIGO stage, histological type, and cytoreduction outcome).
mors [7]. Additionally, combining serum LDH with other tu- mor markers such as alpha-fetoprotein, CA125, and hCG-β enhances the diagnosis of the histological type of ovarian tumor[8]. As with our study, the serum LDH level increased with the advancement in clinical stage and histological grade [9]. In the present study, high serum LDH level had a signifi- cant correlation with advanced stages; patients with high- grade serous carcinoma showed higher serum LDH levels than those with other histological types. Xiang et al. [9] re- vealed, for the first time, that higher serum LDH was associ- ated with lower survival rate in patients with ovarian cancer.
In their study, OS was associated with serum LDH level, but our study showed that DFS was associated with serum LDH level. The exact follow-up time in their study was uncertain.
However, it was speculated that serum LDH may be associ- ated only with short-term survival because many useful anti- cancer agents have been developed.
To the best of our knowledge, the present study is the first to report the association between serum LDH level and plati- num resistance in ovarian cancer. In other types of cancer, such as pancreatic, breast, colon, and lung cancers, serum LDH levels serve as predictors of response to chemotherapy and radiotherapy [10-13]. Platinum agents are widely used for the treatment of different malignancies. The main target of platinum-based agents is the DNA, resulting in increased DNA damage, which eventually leads to apoptosis. Resis- tance to platinum agents has been associated with several mechanisms. In ovarian cancer, metabolic rewiring in cispla- tin-resistant cells tended to counteract the effect of cisplatin therapy [14]. Cisplatin-resistant ovarian cancer cells had higher rates of glycolysis and reduced mitochondrial activity compared with cisplatin-sensitive cancer cells. However, the mechanism of how LDH affects cancer survival is not fully understood. Cancer cells preferentially metabolize glucose through the process of glycolysis to generate energy even in the presence of adequate oxygen with the help of LDH. It is termed the “Warburg effect”[15]. This change of energy metabolism is believed to be beneficial for the development and progression of cancer cells.
Inflammation is a critical component of tumor progression.
Leukocytes and activated platelets secrete a large number of pro-inflammatory mediators, such as cytokines and chemo- kines, all of which help initiate and accelerate the inflamma- tory response by the host [16]. The pro-inflammatory media- tors stimulate CRP production predominantly by hepatocytes.
NLR, PLR, and CRP reflect the state of inflammatory and immune conditions either from the tumor itself or as a host response. In ovarian cancer, a previous meta-analysis sug- gested NLR as an available predictor of OS and progression- free survival [17]. Our study indicated that patients with high NLR had poor DFS. Furthermore, ovarian cancer patients with high level of NLR had poor response to chemotherapy [18,19].
Kim et al. [20] suggested that dynamic changes in NLR dur- ing chemotherapy might help estimate a more accurate progression-free survival than pretreatment NLR. The positive correlation of pretreatment NLR with platinum resistance was demonstrated in our study as well. PLR and CRP have also been investigated as prognostic factors in ovarian can- cer. From the random effects of meta-analysis, patients with higher level of pretreatment PLR had shorter OS and progres- sion-free survival [21]. Miao et al. [19] reported that pretreat- ment high PLR is predictive of platinum resistance and poor OS. As for CRP, Hefler et al. [22] found that an elevated CRP level is associated with FIGO stage, poor OS, and platinum resistance in patients with ovarian cancer. In our study, the pretreatment PLR and CRP levels increased significantly with advancing clinical stage; in the Kaplan–Meier curves for the validation set, group B, higher PLR and CRP were associated with shorter OS, DFS, and PFI. NLR, PLR, and CRP levels, which are inflammatory markers, may predict prognosis and platinum resistance in patients with ovarian cancer. However, patients with high NLR, high PLR, and high CRP did not show significantly poorer prognosis in group A. A possible reason for this discrepancy is the effect of inflammation, because patients with high CRP showed poor prognosis only in group B. Using a Cox regression model of multivariate analysis after adjusting for the blood data, excluding CA125 levels, we found that only LDH remained an independent prognostic marker of platinum resistance, indicating that LDH is a more powerful predictor than the inflammatory markers.
At present, the prognostic significance of preoperative se- rum lipid lipoproteins and glucose in ovarian cancer remains controversial. Of 9 blood data, TC, TG, HDL, LDL, and glu- cose had no significant association with prognosis and plati- num resistance in our study. Zhu et al. [23] also examined the prognostic value of preoperative TC, TG, HDL, LDL, and glucose. Of the 5 blood data, only high LDL level was associ- ated with a favorable recurrence-free survival, while Li et al.
[24] observed that higher LDL was a significant predictor of poor recurrence-free survival and OS. As well as in our study,
Zhu et al. [23] found a null association between glucose and ovarian cancer clinical outcomes, although Lamkin et al. [25]
reported that higher glucose levels were associated with shorter DFS and OS in 74 patients with ovarian cancer.
One of the strengths of this study is that all laboratory data were collected in an easy, inexpensive, and safe man- ner. Ovarian cancer patients were examined routinely before surgery or chemotherapy. In addition, external validation was performed to allow the generalizability of our findings. The limitations of this study include the retrospective nature of the data collection and the lack of data on usage of anti-an- giogenic agents, performance status, and nutritional status.
In conclusion, the 9 pretreatment laboratory data were assessed based on the patients’ clinical characteristics and prognosis including platinum resistance. High levels of serum LDH and NLR were possible predictors of platinum resistance and poor prognosis in ovarian cancer. In particular, LDH was a more accurate predictor of platinum resistance than NLR.
Combining these prognostic factors might provide clues for managing ovarian cancer using individual therapeutic strate- gies.
Acknowledgements
We gratefully acknowledge the work of past and present members of our department.
Conflict of interest
No potential conflict of interest relevant to this article was reported.
Ethical approval
A retrospective study was conducted with the approval of the institute ethical review board at the National Hospital Organization Kyoto Medical Center (#17-091) and Kyoto University Hospital (#G0531).
Patient consent
The patients provided written informed consent for the pub- lication.
Supplementary materials
Supplementary materials associated with this article can be found online at https://doi.org/10.5468/ogs.20117.
References
1. Siegel RL, Miller KD, Jemal A. Cancer statistics, 2019.
CA Cancer J Clin 2019;69:7-34.
2. Elattar A, Bryant A, Winter-Roach BA, Hatem M, Naik R. Optimal primary surgical treatment for advanced epithelial ovarian cancer. Cochrane Database Syst Rev 2011;2011:CD007565.
3. Davis A, Tinker AV, Friedlander M. “Platinum resistant”
ovarian cancer: what is it, who to treat and how to mea- sure benefit? Gynecol Oncol 2014;133:624-31.
4. Gallo M, Sapio L, Spina A, Naviglio D, Calogero A, Navi- glio S. Lactic dehydrogenase and cancer: an overview.
Front Biosci (Landmark Ed) 2015;20:1234-49.
5. Huijgen HJ, Sanders GT, Koster RW, Vreeken J, Bossuyt PM. The clinical value of lactate dehydrogenase in se- rum: a quantitative review. Eur J Clin Chem Clin Bio- chem 1997;35:569-79.
6. Wulaningsih W, Holmberg L, Garmo H, Malmstrom H, Lambe M, Hammar N, et al. Serum lactate dehydroge- nase and survival following cancer diagnosis. Br J Cancer 2015;113:1389-96.
7. Bastani A, Asghary A, Heidari MH, Karimi-Busheri F.
Evaluation of the sensitivity and specificity of serum level of prostasin, CA125, LDH, AFP, and hCG+β in epithelial ovarian cancer patients. Eur J Gynaecol Oncol 2017;38:418-24.
8. Boran N, Kayikçioğlu F, Yalvaç S, Tulunay G, Ekinci U, Köse MF. Significance of serum and peritoneal fluid lactate dehydrogenase levels in ovarian cancer. Gynecol Obstet Invest 2000;49:272-4.
9. Xiang J, Zhou L, Zhuang Y, Zhang J, Sun Y, Li S, et al.
Lactate dehydrogenase is correlated with clinical stage
and grade and is downregulated by si-SATB1 in ovarian cancer. Oncol Rep 2018;40:2788-97.
10. Liu X, Zhang W, Yin W, Xiao Y, Zhou C, Hu Y, et al. The prognostic value of the serum neuron specific enolase and lactate dehydrogenase in small cell lung cancer pa- tients receiving first-line platinum-based chemotherapy.
Medicine (Baltimore) 2017;96:e8258.
11. Feng W, Wang Y, Zhu X. Baseline serum lactate dehy- drogenase level predicts survival benefit in patients with metastatic colorectal cancer receiving bevacizumab as first-line chemotherapy: a systematic review and meta- analysis of 7 studies and 1,219 patients. Ann Transl Med 2019;7:133.
12. Jia Z, Zhang J, Wang Z, Wang B, Wang L, Cao J, et al.
An explorative analysis of the prognostic value of lactate dehydrogenase for survival and the chemotherapeu- tic response in patients with advanced triple-negative breast cancer. Oncotarget 2018;9:10714-22.
13. Wen Q, Meng X, Xie P, Wang S, Sun X, Yu J. Evalua- tion of factors associated with platinum-sensitivity sta- tus and survival in limited-stage small cell lung cancer patients treated with chemoradiotherapy. Oncotarget 2017;8:81405-18.
14. Zaal EA, Berkers CR. The influence of metabolism on drug response in cancer. Front Oncol 2018;8:500.
15. Vander Heiden MG, Cantley LC, Thompson CB. Under- standing the Warburg effect: the metabolic require- ments of cell proliferation. Science 2009;324:1029-33.
16. Coussens LM, Werb Z. Inflammation and cancer. Nature 2002;420:860-7.
17. Chen G, Zhu L, Yang Y, Long Y, Li X, Wang Y. Prog- nostic role of neutrophil to lymphocyte ratio in ovar- ian cancer: a meta-analysis. Technol Cancer Res Treat 2018;17:1533033818791500.
18. Wang Y, Liu P, Xu Y, Zhang W, Tong L, Guo Z, et al.
Preoperative neutrophil-to-lymphocyte ratio predicts response to first-line platinum-based chemotherapy and prognosis in serous ovarian cancer. Cancer Chemother Pharmacol 2015;75:255-62.
19. Miao Y, Yan Q, Li S, Li B, Feng Y. Neutrophil to lympho- cyte ratio and platelet to lymphocyte ratio are predictive of chemotherapeutic response and prognosis in epithe- lial ovarian cancer patients treated with platinum-based chemotherapy. Cancer Biomark 2016;17:33-40.
20. Kim YJ, Lee I, Chung YS, Nam E, Kim S, Kim SW, et al.
Pretreatment neutrophil-to-lymphocyte ratio and its dynamic change during neoadjuvant chemotherapy as poor prognostic factors in advanced ovarian cancer. Ob- stet Gynecol Sci 2018;61:227-34.
21. Tian C, Song W, Tian X, Sun Y. Prognostic significance of platelet-to-lymphocyte ratio in patients with ovarian can- cer: a meta-analysis. Eur J Clin Invest 2018;48:e12917.
22. Hefler LA, Concin N, Hofstetter G, Marth C, Mustea A, Sehouli J, et al. Serum C-reactive protein as independent prognostic variable in patients with ovarian cancer. Clin Cancer Res 2008;14:710-4.
23. Zhu F, Xu X, Shi B, Zeng L, Wang L, Wu X, et al. The positive predictive value of low-density lipoprotein for recurrence-free survival in ovarian cancer. Int J Gynaecol Obstet 2018;143:232-8.
24. Li AJ, Elmore RG, Chen IY, Karlan BY. Serum low- density lipoprotein levels correlate with survival in ad- vanced stage epithelial ovarian cancers. Gynecol Oncol 2010;116:78-81.
25. Lamkin DM, Spitz DR, Shahzad MM, Zimmerman B, Lenihan DJ, Degeest K, et al. Glucose as a prognostic factor in ovarian carcinoma. Cancer 2009;115:1021-7.