Korean J Physiol Pharmacol 2018;22(1):23-33 https://doi.org/10.4196/kjpp.2018.22.1.23
Author contributions: M.K. wrote the manuscript, performed the cell- based experiments (except Fig. 3. and Fig. 7B), performed animal based ex- periments (except Fig. 9B, C) and bred animals. H.A.L. organized the study, performed immunoprecipitation in Fig. 9C. H.M.C. performed Chip assay in Fig. 3. and EMSA in Fig. 7B. S.H.K. and E.L. helped breed and I.K.K. supervised the study.
This is an Open Access article distributed under the terms of the Creative Commons Attribution Non-Commercial License, which permits unrestricted non-commercial use, distribution, and reproduction in any medium, provided the original work is properly cited.
Copyright © Korean J Physiol Pharmacol, pISSN 1226-4512, eISSN 2093-3827
INTRODUCTION
Cushing’s syndrome (CS) is caused by prolonged elevation of the levels of circulating cortisol [1]. The levels of circulating cor- tisol, a principal glucocorticoid (GC), are controlled by the hypo- thalamic-pituitary-adrenal axis [2]. The anterior pituitary gland secretes adrenocorticotropic hormone (ACTH), which stimulates secretion of cortisol by the adrenal glands [3]. CS is characterized by central obesity, insulin resistance, hypercholesterolemia, dia- betes, and muscle wasting [4]. The chronically elevated GC levels that occur in CS also cause hepatic steatosis [5].
GCs are steroid hormones that play critical and complex roles in the maintenance of metabolic homeostasis and lipid metabo-
lism [6,7]. The effects of GCs are mediated via the glucocorticoid receptor (GR), a member of the nuclear receptor superfamily of transcription factors. Upon binding to GC in the cytosol, the GR translocates into the nucleus where it functions as a transcrip- tional regulator of GC-responsive target genes via direct DNA binding or through protein-protein interactions with other tran- scriptional coregulators [8]. GCs are potent, key regulators that drive lipogenesis through the upregulation of fatty acid synthase (Fasn), acetyl-CoA carboxylase (Acc), stearoyl-CoA desaturase-1 ( Scd1) [9], and sterol regulatory element binding protein 1c ( Sreb- p1c) [10,11]. However, the molecular mechanism by which the GR induces hepatic lipogenesis and steatosis is largely unknown.
Posttranslational modifications of steroid receptors, such as
Original Article
Histone deacetylase inhibition attenuates hepatic steatosis in rats with experimental Cushing’s syndrome
Mina Kim 1,2,3,4 , Hae-Ahm Lee 1,2,3 , Hyun-Min Cho 1 , Seol-Hee Kang 1,2,3,4 , Eunjo Lee 1,2,3,4 , and In Kyeom Kim 1,2,3,4, *
1
Department of Pharmacology,
2Cardiovascular Research Institute,
3Cell and Matrix Research Institute,
4BK21 Plus KNU Biomedical Convergence Program, De- partment of Biomedical Science, Kyungpook National University School of Medicine, Daegu 41944, Korea
ARTICLE INFO Received March 29, 2017 Revised July 14, 2017 Accepted July 30, 2017
*Correspondence In Kyeom Kim E-mail: [email protected] Key Words
Cushing’s syndrome Glucocorticoid receptor HDAC inhibitor Hepatic steatosis Sodium valproate
ABSTRACT Cushing’s syndrome (CS) is a collection of symptoms caused by pro-
longed exposure to excess cortisol. Chronically elevated glucocorticoid (GC) levels
contribute to hepatic steatosis. We hypothesized that histone deacetylase inhibitors
(HDACi) could attenuate hepatic steatosis through glucocorticoid receptor (GR) acet-
ylation in experimental CS. To induce CS, we administered adrenocorticotropic hor-
mone (ACTH; 40 ng/kg/day) to Sprague-Dawley rats by subcutaneous infusion with
osmotic mini-pumps. We administered the HDACi, sodium valproate (VPA; 0.71% w/v),
in the drinking water. Treatment with the HDACi decreased steatosis and the expres-
sion of lipogenic genes in the livers of CS rats. The enrichment of GR at the promot-
ers of the lipogenic genes, such as acetyl-CoA carboxylase (Acc), fatty acid synthase
(Fasn), and sterol regulatory element binding protein 1c (Srebp1c), was markedly de-
creased by VPA. Pan-HDACi and an HDAC class I-specific inhibitor, but not an HDAC
class II a-specific inhibitor, attenuated dexamethasone (DEX)-induced lipogenesis in
HepG2 cells. The transcriptional activity of Fasn was decreased by pretreatment with
VPA. In addition, pretreatment with VPA decreased DEX-induced binding of GR to the
glucocorticoid response element (GRE). Treatment with VPA increased the acetyla-
tion of GR in ACTH-infused rats and DEX-induced HepG2 cells. Taken together, these
results indicate that HDAC inhibition attenuates hepatic steatosis through GR acety-
lation in experimental CS.
phosphorylation, acetylation, ubiquitylation, and sumoylation, are important mechanisms for the regulation of target gene ex- pression [12]. The phosphorylation of GR is critical to its ability to regulate the expression of target genes involved in insulin signal- ing and lipid metabolism, thereby potentially facilitating insulin resistance [13]. The acetylation of GR also controls the activity of various cytosolic and nuclear proteins [14].
HDAC inhibitors including valproic acid (VPA) have been reported to exert several beneficial effects in T2DM and its com- plications [15,16]. VPA is primarily used for the treatment of epilepsy, migraine and bipolar disorders. VPA has been proven as an HDAC inhibitor and subdued the activities of class I and II HDACs. HDAC inhibitors (HDACi) increase transcription via chromatin decondensation [17]. However, recent studies have reported that HDACi can also suppress the expression of genes [18,19]. Our previous study revealed that acetylation of the min- eralocorticoid receptor caused by HDAC inhibition attenuates its transcriptional activity and the expression of target genes [20,21].
Few studies have investigated whether HDACi prevent steatosis and lipogenesis in the context of excess GCs, as associated with CS. We hypothesized that HDACi could attenuate hepatic steato- sis through GR acetylation in experimental CS.
METHODS
Animals
The study was conducted in accordance with the National In- stitutes of Health Guide for the Care and Use of Laboratory Ani- mals, after approval by the Institutional Review Board of Kyung- pook National University; every effort was made to minimize both the number of animals used and their suffering. Nine-week- old male Sprague-Dawley (SD) rats were unilaterally nephrec- tomized under ketamine (150 mg/kg; Yuhan, Seoul, Korea) and xylazine (18 mg/kg; Bayer, Seoul, Korea) anesthesia, as previously described [21]. Rats received subcutaneous infusion of ACTH (40 ng/kg/day) via an osmotic mini-pump. Sodium valproate (VPA) was purchased from Sigma-Aldrich (St. Louis, MO, USA). VPA (0.71% w/v) was administered via the drinking water for 4 weeks.
Rats were anesthetized with sodium pentobarbital (50 mg/kg in- traperitoneally). Tissues were frozen in liquid nitrogen and stored at –80°C until further study.
Cell culture
HepG2 cells were purchased from the American Type Culture Collection (Manassas, VA, USA) and maintained under 5% CO
2at 37°C in Dulbecco’s modified Eagle’s medium with L-glutamine and 4,500 mg/L glucose containing 10% fetal bovine serum (In- vitrogen, Carlsbad, CA, USA). They were sub-cultured every 3 or 4 days with trypsin (0.25%) and EDTA (0.02%). A fraction of the
detached cells was transferred to normal Tyrode’s solution and kept at 4°C in microtubes. We treated HepG2 cells with the HDA- Ci; VPA (Sigma-Aldrich Inc., MO, USA), SAHA (Sigma-Aldrich Inc., MO, USA), TSA (Sigma-Aldrich Inc., MO, USA), MS275 (Selleckchem, TX, USA) and MC1568 (Santa Cruz Biotechnology, CA, USA), then incubated the cells with or without DEX.
Histology
For trichrome, Oil Red O, and hematoxylin&eosin (H&E) stains, liver tissues were fixed in 4% formalin overnight, then dehydrated and embedded in paraffin. The paraffin-embedded samples were sectioned at a thickness of 3 mm. The slides were examined using light microscopy.
Oil Red O stain
Briefly, to examine the accumulation of fat, HepG2 cells were rinsed with cold phosphate-buffered saline (PBS) and fixed in 10% paraformaldehyde for 30 min. After the cells were washed with 60% isopropanol, they were stained for at least 1 h in a fresh- ly diluted Oil Red O solution (6 parts 0.5% Oil Red O in isopropa- nol stock solution and 4 parts H
2O). After the stain was removed and the cells were washed with 60% isopropanol, images of each group of cells were acquired (Nikon Imaging Korea, Seoul, Ko- rea).
Quantitative reverse transcription-polymerase chain reaction (RT-qPCR)
RT-qPCR was performed using an ABI PRISM
Ⓡ7000 Sequence Detection System (Applied Biosystems, Foster City, CA, USA) as previously described [21]. Amplification reactions containing 10 μL of SYBR
ⓇGreen PCR Master Mix (Applied Biosystems), 4 μL of cDNA, and the indicated primer set (200 nM) were performed in a total volume of 20 μL. All samples were amplified in triplicate in a 96-well plate, with the following cycling conditions: 2 min at 50°C, 10 min at 95°C, and 40 cycles at 95°C for 15 s followed by 1 min at 60°C. The relative mRNA expression level was determined by calculating the values of Δcycle threshold (ΔCt) by normalizing the average Ct value compared to its endogenous control (Gapdh), then calculating 2
–ΔΔCt. Statistical analyses were performed using one-way analysis of variance (ANOVA). The primer sets are given in the supplementary data (Table 1S).
Immunoprecipitation and Western blotting
The frozen tissues were homogenized in RIPA buffer contain-
ing protease inhibitors. The cell lysates were precleared with
protein G agarose at 4°C for 2 h. The supernatants were incubated
overnight with 1 mg of GR antibody (Santa Cruz Biotechnology,
USA), or acetyl-lysine (ac-K) antibody (Cell Signaling Technology,
HDAC inhibitor attenuates steatosis in Cushing’s syndrome 25 USA), at 4°C. The immunocomplexes were washed 3 times with
lysis buffer (20 mM Tris, 150 mM NaCl, 1% NP-40, 0.5% SDS, 0.1% SDS, and 1 proteinase inhibitor cocktail), then subjected to western blot analysis. For western blots, protein-matched samples (Bradford assay) were subjected to SDS-PAGE, then transferred to nitrocellulose membranes. The nitrocellulose membranes were blocked with 5% skim milk in TBS (25 mM Tris base and 150 mM NaCl) for 2 h at room temperature, then incubated with 1 mg/mL of GR or ac-K antibody at 4°C overnight. Then, the mem- branes were incubated in secondary antibody (diluted 1:5000) at room temperature for 1 h, and washed 3 times for 10 min each in TBST. The target proteins were detected with Enhanced Che- miluminescence Plus detection reagents (Amersham, Pittsburgh, PA, USA). The expression levels were quantified by optical densi- tometry (ImageJ software; http://rsbweb.nih.gov). We performed western blotting with the following antibodies: GR antibody (San- ta Cruz Biotechnology, CA, USA), SREBP1 antibody (Santa Cruz Biotechnology, CA, USA), ac-K antibody (Cell Signaling Technol- ogy, MA, USA), ACC antibody (Thermo Fisher, MA, USA) FAS antibody (Thermo Fisher, MA, USA), GAPDH antibody (Thermo Fisher, MA, USA), SCD1 antibody (Abcam, Cambridge, UK), and β-actin antibody (Sigma-Aldrich Inc., MO, USA).
Electrophoretic mobility shift assay (EMSA)
Oligonucleotides were either commercially synthesized or, in the case of the oligonucleotide glucocorticoid response element (GRE), obtained from Genotech (Pohang, Korea). The oligo- nucleotides that we used in the EMSAs included 35 nucleotides of GCs. Complementary oligonucleotides in equimolar amounts were heated to 100°C, cooled overnight to 25°C, divided into aliquots, and stored at –20°C before use. Double-stranded oli- gonucleotide probes were end-labeled using T4 polynucleotide kinase and [γ-
32P]-ATP. Binding reactions were performed in a 20-mL volume containing approximately 20,000 cpm of labeled probe, 6~12 mg of nuclear extract, 20 mM HEPES (pH 7.9), 60 mM KCl, 5 mM MgCl
2, 2 mM dithiothreitol, 10% glycerol, 200 ng poly(dIzdC), 1 mg bovine serum albumin, and unlabeled com- petitor oligonucleotides. We followed the instructions provided by the manufacturer for EMSAs with the human recombinant GR. The binding reaction mixtures were incubated at 25°C for 30 min, then loaded onto 6% non-denaturing polyacrylamide gels in 25 mM Tris (pH 8.3), 25 mM boric acid, and 0.5 mM EDTA. For supershift experiments, incubations with polyclonal anti-human GR antibody from Abcam (Cambridge, UK) or preimmune an- tiserum (diluted 1:500) were performed for 30 min at room tem- perature after addition of radiolabeled GRE 5 and nuclear extract.
Gels were dried and autoradiographed overnight at 270°C, using Fujifilm RX-Fuji medical X-ray film and intensifying screens.
Epstein-Barr Nuclear Antigen (EBNA) extract was used as a posi- tive control.
Chromatin immunoprecipitation (ChIP) assay
ChIP assays were performed according to the manufacturer’s instructions, with minor modifications, using the EZ-ChIP
TMkit (Upstate Biotechnology, Lake Placid, NY, USA) as previously described [22]. In brief, tissues were fixed with 1% formaldehyde and washed with ice-cold PBS. After homogenization, tissues were incubated in SDS lysis solution for 10 min on ice. The lysates were sonicated with 15 cycles of 100 amplitude for 10 s followed by cooling on ice for 50 s. The lysates were precleared with pro- tein G agarose beads for 2 h. Then, antibodies were added and in- cubated at 4°C overnight. The antibody against GR was obtained from Abcam. Anti–polymerase II antibodies were obtained from Upstate Biotechnology. To reverse the crosslinking between DNA and chromatin, elutes were incubated at 65°C for 5 h after the ad- dition of NaCl to a final concentration of 0.2 M. The proteins were eliminated by digestion with proteinase K at 45°C for 2 h and the DNA was purified with a spin column. Specific promoter DNA was quantified by qPCR. All samples were amplified in triplicate in 96-well plates, with the following cycling conditions: 2 min at 50°C, 10 min at 95°C, and 40 cycles at 95°C for 15 s followed by 1 min at 60°C. The primer sets are given in the supplementary data (Table 2S).
Luciferase assay
For the luciferase assay, HepG2 cells were seeded on collagen I-coated 12-well plates, cultured overnight, and transfected with vector constructs using Superfect Transfection Reagent (Qiagen, Hilden, Germany), according to the manufacturer’s recom- mendation. The next day, cells were exposed to dexamethasone (DEX, 10 nmol/L) for 24 h with or without pretreatment with VPA (10 mmol/L). The cells were lysed with a lysis buffer and the luciferase activity was analyzed with a Bright-Glo
TMLuciferase Assay System kit (Promega, Madison, WI, USA) according to the manufacturer’s instructions. Luminescence was measured with a Veritas
TMMicroplate Luminometer (Turner Biosystems, Sunny- vale, CA, USA).
Statistics
Results are expressed as mean±standard error (SE). Data were
analyzed with the Kruskal-Wallis test or one-way ANOVA fol-
lowed by post hoc Tukey’s comparison test; differences were con-
sidered significant at p<0.05. Student’s t-test was applied for the
analysis of the significance of differences between 2 groups. The
procedures were performed using SPSS software (release 19.0,
SPSS, Chicago, IL, USA).
RESULTS
VPA attenuated hepatic steatosis in ACTH-infused rats
To determine whether VPA has an anti-steatotic effect in vivo, we administered VPA into control SD rats or SD rats subcutane- ously infused with ACTH for 4 weeks. Upon assessment of liver morphology and Oil Red O staining, we found that the admin- istration of VPA considerably reduced ACTH-induced steatosis.
We also examined collagen deposition and fibrosis, which would appear blue after trichrome staining. ACTH infusion did not af- fect liver collagen deposition and fibrosis (Fig. 1). We analyzed the expression of the lipogenic genes Acc, Fasn, Scd1, and Srebp1c by RT-qPCR. The ACTH-induced increase in the expression of Acc, Fasn, Scd1, and Srebp1c was attenuated by VPA (Figs. 2A~D). We confirmed the effect at the protein level by western blot analysis (Fig. 2E). Importantly, hepatic steatosis was reduced by VPA, which was associated with significantly reduced mRNA expres- sion and protein levels of lipogenesis in the livers. These results suggested that HDAC inhibition may prevent hepatic steatosis in ACTH-infused rats by suppressing lipogenesis.
VPA reduced the ACTH-induced enrichment of GR and RNA polymerase II (Pol II) at target gene promoters in rats
We next analyzed the enrichment of GR and Pol II on the pro- moters for Acc, Fasn, Scd1, and Srebp1c by ChIP assay followed
by qPCR (Fig. 3 ). The qPCR results showed that VPA attenuated the ACTH-induced enrichment of GR and Pol II at the Acc, Fasn, and Srebp1c promoters in rats compared with controls (Figs. 3A, 3B and 3D). VPA did not affect the enrichment of GR induced by ACTH at the Scd1 promoter (Fig. 3C). These findings suggested that treatment with an HDACi decreased the recruitment of GR and Pol II to the promoters of lipogenesis-related genes in vivo.
DEX increased lipid accumulation in HepG2 cells
To further explore the molecular mechanism of the HDACi-in- duced reduction of liver steatosis, we developed an in vitro model of hepatic steatosis by exposing HepG2 cells to DEX (10 nmol/L).
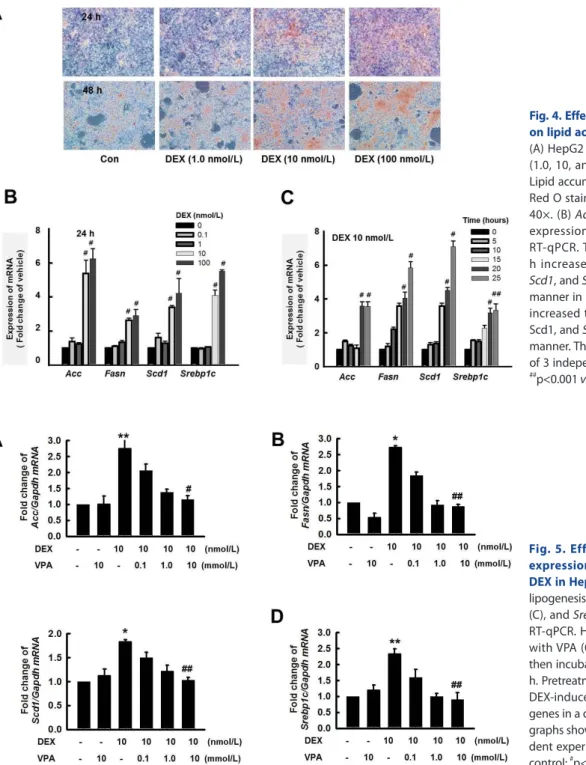
We investigated the expression of Acc, Fasn, Scd1, and Srebp1c using RT-qPCR. In HepG2 cells, Oil Red O stain indicated that DEX induced lipid accumulation in a dose-dependent manner (Fig. 4A). In addition, DEX increased the expression of lipogen- esis genes in a dose- and time-dependent manner (Figs. 4B and C). Thus, DEX increased lipogenesis and lipid accumulation in HepG2 cells.
HDAC inhibition attenuated lipogenesis in HepG2 cells
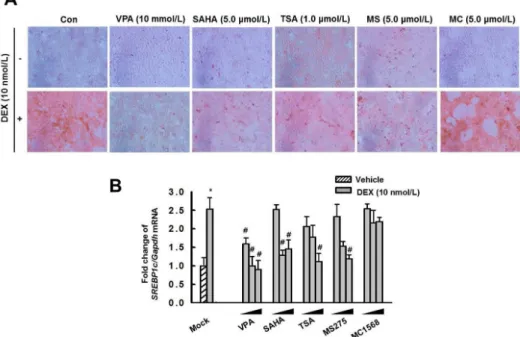
We used VPA to determine whether HDAC inhibition could influence the DEX-mediated induction of lipogenesis. Pretreat- ment with VPA for 6 h attenuated DEX-induced expression of Acc (Fig. 5A), Fasn (Fig. 5B), Scd1 (Fig. 5C), and Srebp1c (Fig. 5D).
DEX increased expression of lipogenesis genes, which was attenu-
Fig. 1. Effects of VPA treatment on ACTH-induced steatosis. Representa- tive images of livers from rats treated with vehicle (n=6), VPA (n=7), ACTH (n=6), or ACTH with VPA (n=7). Liver sections were stained with Oil Red O, trichrome, or H&E to compare between treatment groups. (Bar=50 μm, stain magnification 200×).
Fig. 1
HDAC inhibitor attenuates steatosis in Cushing’s syndrome 27
Fig. 3. Effect of VPA treatment on the enrichment of GR and RNA poly- merase II (Pol II) onto the promoters of target genes in the rat liver. The enrichment of GR and Pol II at promot- ers of lipogenesis genes was analyzed by ChIP. Schematic diagrams show the locations of the GREs, as well as the PCR amplifications following the ChIP assay, for the Fasn (A), Acc (B), Scd1 (C), and Srebp1c (D) promoters (upper). TSS;
transcription start site. The ChIP assays were quantified by qPCR. ACTH infusion increased enrichment of GR and Pol II on Fasn, Acc, and Srebp1c, which were decreased by VPA treatment. The graphs show the mean±SE of 5 independent experiments. *p<0.05 and **p<0.01 vs.
control;
#p<0.05 and
##p<0.01 vs. ACTH.
Fig. 3
Fig. 2. Effects of VPA treatment on the expression of lipogenesis genes in the liver. Expression of lipogenesis genes Fasn (A), Acc (B), Scd1 (C), and Srepb1c (D) was quantified by RT-qPCR. VPA treatment decreased the expression of lipogenesis genes in ACTH-induced rats. (E) The expression of li- pogenesis proteins was detected by western blotting. (F) Relative protein expression was quantified by optical densitometry (ImageJ software; http://
rsbweb.nih.gov). VPA treatment decreased lipogenesis protein expression in ACTH-induced rats. The graphs show the mean±SE of 3 independent experiments. *p<0.05 and **p<0.01 vs. control;
#p<0.05 and
##p<0.01 vs. ACTH.
Fig. 2
ated by VPA in HepG2 cells. Thus, we consider VPA a potential therapeutic agent for the treatment of lipogenesis. However, VPA is a pan-HDACi. To identify which type of HDACi affected DEX- induced lipid accumulation, we treated HepG2 cells with the pan- HDACi VPA, SAHA, and TSA; the HDAC class I-specific inhibi- tor MS275; and the HDAC class II a-specific inhibitor MC1568 for 6 h, then incubated the cells with or without DEX for 48 h. Pan- HDACi and the HDAC class I-specific inhibitor decreased DEX- induced lipid accumulation (Fig. 6A) and expression of Srebp1c (Fig. 6B) in HepG2 cells.
VPA reduced the recruitment and DNA binding affinity of GR
We analyzed the enrichment of GR and Pol II at the promoters of Srebp1c by ChIP assay followed by qPCR in HepG2 cells (Fig.
7 A). The qPCR results revealed that the enrichment of GR and Pol II on the Srebp1c promoters induced by DEX, compared with the control, was attenuated by VPA. To examine the effect of VPA on DEX-induced GR DNA binding activity, we performed EMSAs.
Treatment with DEX (10 nM) induced the formation of a strong binding complex (Fig. 7B, lane 4). Formation of the binding com- Fig. 4
Fig. 4. Effect of dexamethasone (DEX) on lipid accumulation in HepG2 cells.
(A) HepG2 cells were treated with DEX (1.0, 10, and 100 nM) for 24 and 48 h.
Lipid accumulation was analyzed by Oil Red O staining. Original magnification, 40×. (B) Acc, Fasn, Scd1, and Srepb1c expression levels were quantified by RT-qPCR. Treatment with DEX for 24 h increased expression of Acc, Fasn, Scd1, and Srepb1c in a dose-dependent manner in HepG2 cells. (C) DEX (10 nM) increased the expression of Acc, Fasn, Scd1, and Srepb1c in a time-dependent manner. The graphs show the mean±SE of 3 independent experiments.
#p<0.05,
##
p<0.001 vs. vehicle.
Fig. 5. Effect of VPA treatment on expression of lipogenesis genes by DEX in HepG2 cells. The expression of lipogenesis genes Acc (A), Fasn (B), Scd1 (C), and Srepb1c (D) was quantified by RT-qPCR. HepG2 cells were pretreated with VPA (0.1, 1.0 and 10 mM) for 6 h then incubated with DEX (10 nM) for 24 h. Pretreatment with VPA decreased the DEX-induced expression of lipogenesis genes in a dose-dependent manner. The graphs show the mean±SE of 3 indepen- dent experiments *p<0.05, **p<0.01 vs.
control;
#p<0.05,
##p<0.01 vs. DEX.
Fig. 5
HDAC inhibitor attenuates steatosis in Cushing’s syndrome 29
plex was blocked by treatment with VPA (10 mM) for 6 h (lane 5).
These findings suggested that VPA decreased the recruitment of GR and Pol II to the promoters of lipogenesis genes, as well as the GR DNA binding activity, in vitro.
VPA reduced Fasn transcriptional activity and increased the acetylation of GR
To evaluate the transcriptional activity of Fasn in response to DEX, we performed a luciferase assay. HepG2 cells were trans- fected with a luciferase vector driven by the Fasn promoter. Treat- ment with DEX increased the transcriptional activity of Fasn,
Fig. 6. Effect of HDAC inhibitors on lipid accumulation and expression of Srepb1c by DEX in HepG2 cells. HepG2 cells were pretreated with VPA (10 mM), SAHA (5.0 μM), TSA (1.0 μM), MS275 (5.0 μM), and MC1568 (5.0 μM) for 6 h then incubated with or without DEX (10 nM) for 48 h. Lipid ac- cumulation was analyzed by Oil Red O stain. Original magnification, 40×. (B) Cells were pretreated with VPA (0.1, 1.0, and 10 mM), SAHA (0.1, 1.0, and 10 μM), TSA (0.1, 0.3, and 1.0 μM), MS275 (1.0, 10, and 100 μM), and MC1568 (0.1, 5.0, and 10 μM) for 6 h then incubated with DEX (10 nM) for 48 h.
The expression of Srebp1c was quantified by RT-qPCR. Treatment with DEX increased lipid accumulation and the expression of Srebp1c, which were decreased by pretreatment with the pan-HDACi VPA, SAHA and TSA, or the HDAC class I-specific inhibitor MS275, but not with the HDAC class II a- specific inhibitor MC1568. The graphs show the mean±SE of 3 independent experiments.
#p<0.05 vs. the mock.
Fig. 6
Fig. 7. Effect of VPA treatment on binding of GR or Pol II on GRE of Srebp1c promoter. (A) The enrichment of GR and Pol II at the promoters for Srebp1c was analyzed by ChIP. The ChIP assays were quantified by qPCR. Treatment with DEX (10 nM) increased the enrichment of GR and Pol II on the Srebp1c promoter, which was decreased by pretreatment with VPA. The graphs show the mean±SE of 3 independent experiments. (*p<0.05 vs.
control;
#p<0.05 vs. DEX). (B) EMSA. HepG2 cells were pretreated with or without VPA (10 mM) for 6 h then incubated with DEX (10 nM) for 6 h. DEX induced binding of GR to the GRE, which was decreased by pretreatment with VPA. The gel is representative of 3 independent experiments.
Fig. 7
which was significantly decreased by VPA only in cells trans- fected with wild-type GR (Fig. 6A). We also used 2 GR mutants, in which 2 lysines in the GR acetylation site were substituted with glutamine (QQ) or arginine (RR) (Vigene Biosciences, CA, USA). We found that the DEX-induced transcriptional activity of Fasn was not decreased by VPA in cells transfected with the RR- mutant (Fig. 8 ). We investigated GR acetylation by blotting with an anti–ac-K antibody after immunoprecipitation with an anti- GR antibody (Fig. 9). GR acetylation was analyzed by western blot with anti–ac-K antibody after immunoprecipitation with anti- GR antibody (Figs. 9A and C). The relative protein expression was quantified by optical densitometry (Figs. 9B and D). GR acety- lation was significantly increased in HepG2 cells and ACTH- infused rats after treatment with VPA, compared to controls (Figs.
9B and D). These findings indicated that VPA decreased the DEX-induced transcriptional activity of GR by acetylation.
DISCUSSION
In this report, we demonstrated that the inhibition of HDAC attenuates hepatic steatosis through GR acetylation in experi- mental CS. We showed that HDACi increased GR acetylation in ACTH-infused rats, which decreased the recruitment of GR and Pol II to the promoters of target genes such as Fasn, Acc and Srebp1c. Treatment with HDACi decreased the transcriptional activity of Fasn and GR DNA binding activity induced by DEX in HepG2 cells. Therefore, treatment with HDACi reduced the expression of lipogenic enzymes, including FAS, ACC, SCD1 and SREBP1 c, resulting in attenuated lipogenesis and hepatic steatosis via GR acetylation. These results are summarized in Fig. 10.
GC plays an important role in the regulation of lipid homeo- stasis, signal through the GR [23]. Prolonged exposure to excess
Fig. 8. VPA treatment attenuated Fasn transcriptional activity.
(A) HepG2 cells were cotransfected with expression vectors for wild- type GR, QQ-mutant GR (Glu mt), or RR-mutant GR (Arg mt), as well as a luciferase vector driven by the Fasn promoter. Treatment with DEX increased transcriptional activity in HepG2 cells transfected with wild- type GR and RR-mutant GR, but not the QQ-mutant. Pretreatment with VPA (10 mM) resulted in a significant decrease in DEX-induced promoter activity in HepG2 cells transfected with wild-type GR, but not RR-mutant GR. The graphs show the mean±SE of 5 independent experi- ments. *p<0.05, **p<0.01 vs. control;
#p<0.05 vs. DEX.
Fig. 8
Fig. 9. VPA treatment increased ace- tylation of GR. (A) HepG2 cells were pretreated with VPA (10 mM) for 3 h then incubated with DEX (10 nM) for 6 h. (C) GR acetylation in rat livers. GR acetyla- tion was analyzed by western blot (WB) with anti–ac-K antibody after immuno- precipitation (IP) with anti-GR antibody.
(B and D) The relative protein expression was quantified by optical densitometry (ImageJ software; http://rsbweb.nih.
gov). The graphs show the mean±SE of 6 independent experiments. GR acetyla- tion was increased by VPA treatment.
##