INTRODUCTION
Between 1988 and 2012, the United States in-hospital mortality rate of septic patients admitted to an intensive care unit (ICU) de- clined by 35%, despite an increase in illness severity.1 The most important factor in decreasing mortality among septic patients was the implementation of care bundle approaches (e.g., the Surviving Sepsis Campaign).2,3 However, sepsis is still the lead- ing cause of death (18.4–29.0%),4,5 and the incidences of severe sepsis and septic shock are increasing.5,6 Therefore, much prog- ress remains to be made in decreasing the mortality rate; one way to accomplish this is the early identification of patients likely
Hypoalbuminemia, Low Base Excess Values, and Tachypnea Predict 28-Day Mortality
in Severe Sepsis and Septic Shock Patients in the Emergency Department
Min Ho Seo
1*, Minhong Choa
2*, Je Sung You
1, Hye Sun Lee
3, Jung Hwa Hong
3, Yoo Seok Park
1, Sung Phil Chung
1, and Incheol Park
11Department of Emergency Medicine, Yonsei University College of Medicine, Seoul;
2Institute for Disaster Relief and Medical Safety Net, Yonsei University College of Medicine, Seoul;
3Department of Biostatistics, Yonsei University College of Medicine, Seoul, Korea.
Purpose: The objective of this study was to develop a new nomogram that can predict 28-day mortality in severe sepsis and/or septic shock patients using a combination of several biomarkers that are inexpensive and readily available in most emergency departments, with and without scoring systems.
Materials and Methods: We enrolled 561 patients who were admitted to an emergency department (ED) and received early goal- directed therapy for severe sepsis or septic shock. We collected demographic data, initial vital signs, and laboratory data sampled at the time of ED admission. Patients were randomly assigned to a training set or validation set. For the training set, we generated models using independent variables associated with 28-day mortality by multivariate analysis, and developed a new nomogram for the prediction of 28-day mortality. Thereafter, the diagnostic accuracy of the nomogram was tested using the validation set.
Results: The prediction model that included albumin, base excess, and respiratory rate demonstrated the largest area under the receiver operating characteristic curve (AUC) value of 0.8173 [95% confidence interval (CI), 0.7605–0.8741]. The logistic analysis revealed that a conventional scoring system was not associated with 28-day mortality. In the validation set, the discrimination of a newly developed nomogram was also good, with an AUC value of 0.7537 (95% CI, 0.6563–0.8512).
Conclusion: Our new nomogram is valuable in predicting the 28-day mortality of patients with severe sepsis and/or septic shock in the emergency department. Moreover, our readily available nomogram is superior to conventional scoring systems in predict- ing mortality.
Key Words: Severe sepsis, septic shock, mortality, nomograms Yonsei Med J 2016 Nov;57(6):1361-1369
http://dx.doi.org/10.3349/ymj.2016.57.6.1361 pISSN: 0513-5796 · eISSN: 1976-2437
Received: November 19, 2015 Revised: April 29, 2016 Accepted: May 3, 2016
Corresponding author: Dr. Yoo Seok Park, Department of Emergency Medicine, Yonsei University College of Medicine, 50-1 Yonsei-ro, Seodaemun-gu, Seoul 03722, Korea.
Tel: 82-2-2228-2460, Fax: 82-2-2227-7908, E-mail: [email protected]
*Min Ho Seo and Minhong Choa contributed equally to this work.
•The authors have no financial conflicts of interest.
© Copyright: Yonsei University College of Medicine 2016
This is an Open Access article distributed under the terms of the Creative Com- mons Attribution Non-Commercial License (http://creativecommons.org/licenses/
by-nc/3.0) which permits unrestricted non-commercial use, distribution, and repro- duction in any medium, provided the original work is properly cited.
to die. If we can predict the mortality of patients with severe sep- sis and/or septic shock (hereafter referred to as “severe sepsis”) in the emergency department (ED) and aggressively resuscitate them, the survival rate can be expected to increase.
Many studies have suggested prognostic factors for severe sepsis such as age, gender, ethnic origin, comorbidities, illness severity, and biomarkers associated with mortality.7,8 Conven- tional scoring systems such as the Acute Physiology and Chron- ic Health Evaluation II (APACHE II), Sepsis Organ Failure As- sessment (SOFA), and National Early Warning Score (NEWS) have been used to predict mortality and multi-organ dysfunc- tion.9 However, some studies considered that conventional scoring systems were more suitable for patients with early sep- sis, and were unsuitable for those with severe sepsis or septic shock.10 Others have suggested a role for biomarkers in predict- ing mortality from severe sepsis.11,12 More than 170 different bio- markers have been evaluated, including coagulation, comple- ment, contact system activation, inflammation, and apoptosis markers. Biomarkers can add accuracy and objectivity,13 but their effectiveness in mortality prediction is limited by a lack of specificity and sensitivity.12,14,15 It is difficult to precisely estimate prognosis from a single biomarker because the host immune response to infection is complex. Response to sepsis varies with time, and some specific biomarkers may be useful during spe- cific time periods.12
Recently, some studies have reported a combinatory ap- proach using scoring systems and biomarkers for predicting septic patient mortality.11,16 However, few studies suggested a combination of several biomarkers with and without scoring systems for mortality prediction in patients with severe sepsis.
Thus, the objective of this study was to determine a new no- mogram (which is a user-friendly graphical representation of a statistical predictive model that generates a numerical proba- bility of a clinical event)17 that can predict 28-day mortality in severe sepsis and/or septic shock patients using a combination of several biomarkers that are inexpensive and readily available in most EDs, with and without scoring systems.
MATERIALS AND METHODS
Study design and populations
We performed a retrospective, observational, registry-based study using the early goal-directed therapy (EGDT) registry data from Yonsei University College of Medicine, Severance Hospital, Seoul, Korea between January 1, 2012 and December 31, 2014. Since November 2007, the protocol-based EGDT has been implemented as a critical pathway for patients presenting to the ED of our institution with severe sepsis. If a patient meet- ing two or more systemic inflammatory response syndrome (SIRS) criteria along with having suspicious signs of organ dys- function or hypoperfusion with infection presented to the ED, the patient’s eligibility for EGDT was assessed. Patients were
enrolled in the EGDT registry if one or both of the following con- ditions existed: 1) an initial systolic blood pressure (SBP) <90 mm Hg, despite a 20 mL/kg intravenous crystalloid fluid chal- lenge; or 2) an initial serum lactate level ≥4 mmol/L. The exclu- sion criteria were as follows: 1) those aged <19 years, 2) preg- nancy, 3) an acute cerebrovascular or coronary syndrome, 4) active gastrointestinal bleeding, 5) a contraindication to a cen- tral venous catheter, 6) trauma, 7) a requirement for immediate surgical intervention, 8) a transfer to another hospital within 6 hours after ED admission, and 9) those on do-not-resuscitate status. After reviewing the final diagnosis, we also excluded pa- tients with non-infectious conditions leading to SIRS. The final study population was then allocated to either the training or the validation set at a 7:3 ratio by simple random sampling. The study was reviewed and approved by the Institutional Review Board of Yonsei University College of Medicine, Severance Hospital. The requirement of informed consent was waived by the ethics committee because of the retrospective nature of the study.
Data collection
One investigator (M.H.S.) collected data through a retrospec- tive review of medical records. We attempted to use a standard- ized data abstraction form to minimize bias in the present ret- rospective study.
We collected demographic data, pre-existing chronic comor- bidities, and initial vital signs including respiratory rate (RR).
Initial laboratory data sampled at the time of ED admission that were known to be relevant to the diagnosis or prognosis of sep- sis, as well as laboratory data collected routinely in the ED, were recorded. Parameters included white blood cell count, hema- tocrit, platelet count, red cell distribution width (RDW), delta neutrophil index (DNI), international normalized ratio, activat- ed partial thromboplastin time (aPTT), pH, pCO2, pO2, base ex- cess (BE), HCO3- , lactate, blood urea nitrogen (BUN), creatinine, albumin, creatine kinase-MB (CK-MB), troponin T, N-terminal Fig. 1. Flow diagram of the study subjects. ED, emergency department;
SIRS, systemic inflammatory response syndrome.
574 patients (admitted to the ED with severe
sepsis and/or septic shock)
Training set (393 patients) 69 deaths (17.6%)
Validation set (168 patients) 39 deaths (23.2%)
13 patients excluded 3 patients: active gastrointestinal
bleeding 6 patients: requirement
for immediate surgical intervention
4 patients: non-infectious condition leading to SIRS 561 patients
brain natriuretic peptide, C-reactive protein (CRP), and procal- citonin. APACHE II score, SOFA score, and NEWS were also ob- tained using the worst values during the initial 24 hours after ED admission. The primary outcome was 28-day overall mortality.
Statistical analysis
Statistical analysis was performed using SAS version 9.2 (SAS Inc., Cary, NC, USA). The categorical variables are described as frequencies (%) and continuous variables as mean±standard deviation.
We used independent two-sample t tests for comparisons of continuous variables and the chi-squared test or Fisher’s exact test for categorical variables. For the training set, multicollinear- ity between the variables was taken into consideration. First, we created various types of combinations composed of variables with p<0.05 on univariate binary logistic regression, including individual scoring systems such as APACHE II, and then gener- ated models using variables that were identified as indepen- dently associated with 28-day mortality by a stepwise multivari- ate analysis method. Subsequently, we selected the model with
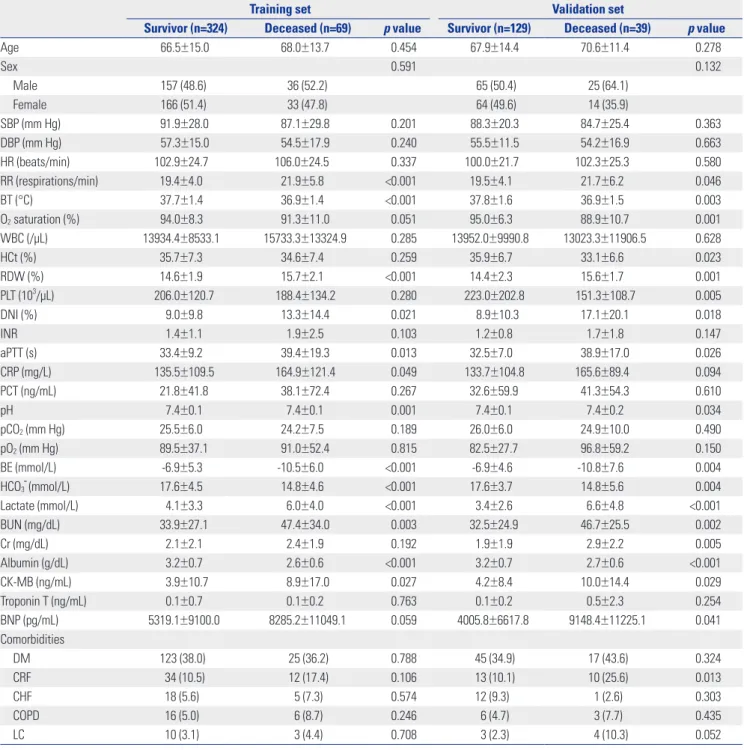
Table 1. Demographic and Other Features of the Study Population
Training set Validation set
Survivor (n=324) Deceased (n=69) p value Survivor (n=129) Deceased (n=39) p value
Age 66.5±15.0 68.0±13.7 0.454 67.9±14.4 70.6±11.4 0.278
Sex 0.591 0.132
Male 157 (48.6) 36 (52.2) 65 (50.4) 25 (64.1)
Female 166 (51.4) 33 (47.8) 64 (49.6) 14 (35.9)
SBP (mm Hg) 91.9±28.0 87.1±29.8 0.201 88.3±20.3 84.7±25.4 0.363
DBP (mm Hg) 57.3±15.0 54.5±17.9 0.240 55.5±11.5 54.2±16.9 0.663
HR (beats/min) 102.9±24.7 106.0±24.5 0.337 100.0±21.7 102.3±25.3 0.580
RR (respirations/min) 19.4±4.0 21.9±5.8 <0.001 19.5±4.1 21.7±6.2 0.046
BT (°C) 37.7±1.4 36.9±1.4 <0.001 37.8±1.6 36.9±1.5 0.003
O2 saturation (%) 94.0±8.3 91.3±11.0 0.051 95.0±6.3 88.9±10.7 0.001
WBC (/μL) 13934.4±8533.1 15733.3±13324.9 0.285 13952.0±9990.8 13023.3±11906.5 0.628
HCt (%) 35.7±7.3 34.6±7.4 0.259 35.9±6.7 33.1±6.6 0.023
RDW (%) 14.6±1.9 15.7±2.1 <0.001 14.4±2.3 15.6±1.7 0.001
PLT (103/μL) 206.0±120.7 188.4±134.2 0.280 223.0±202.8 151.3±108.7 0.005
DNI (%) 9.0±9.8 13.3±14.4 0.021 8.9±10.3 17.1±20.1 0.018
INR 1.4±1.1 1.9±2.5 0.103 1.2±0.8 1.7±1.8 0.147
aPTT (s) 33.4±9.2 39.4±19.3 0.013 32.5±7.0 38.9±17.0 0.026
CRP (mg/L) 135.5±109.5 164.9±121.4 0.049 133.7±104.8 165.6±89.4 0.094
PCT (ng/mL) 21.8±41.8 38.1±72.4 0.267 32.6±59.9 41.3±54.3 0.610
pH 7.4±0.1 7.4±0.1 0.001 7.4±0.1 7.4±0.2 0.034
pCO2 (mm Hg) 25.5±6.0 24.2±7.5 0.189 26.0±6.0 24.9±10.0 0.490
pO2 (mm Hg) 89.5±37.1 91.0±52.4 0.815 82.5±27.7 96.8±59.2 0.150
BE (mmol/L) -6.9±5.3 -10.5±6.0 <0.001 -6.9±4.6 -10.8±7.6 0.004
HCO3- (mmol/L) 17.6±4.5 14.8±4.6 <0.001 17.6±3.7 14.8±5.6 0.004
Lactate (mmol/L) 4.1±3.3 6.0±4.0 <0.001 3.4±2.6 6.6±4.8 <0.001
BUN (mg/dL) 33.9±27.1 47.4±34.0 0.003 32.5±24.9 46.7±25.5 0.002
Cr (mg/dL) 2.1±2.1 2.4±1.9 0.192 1.9±1.9 2.9±2.2 0.005
Albumin (g/dL) 3.2±0.7 2.6±0.6 <0.001 3.2±0.7 2.7±0.6 <0.001
CK-MB (ng/mL) 3.9±10.7 8.9±17.0 0.027 4.2±8.4 10.0±14.4 0.029
Troponin T (ng/mL) 0.1±0.7 0.1±0.2 0.763 0.1±0.2 0.5±2.3 0.254
BNP (pg/mL) 5319.1±9100.0 8285.2±11049.1 0.059 4005.8±6617.8 9148.4±11225.1 0.041
Comorbidities
DM 123 (38.0) 25 (36.2) 0.788 45 (34.9) 17 (43.6) 0.324
CRF 34 (10.5) 12 (17.4) 0.106 13 (10.1) 10 (25.6) 0.013
CHF 18 (5.6) 5 (7.3) 0.574 12 (9.3) 1 (2.6) 0.303
COPD 16 (5.0) 6 (8.7) 0.246 6 (4.7) 3 (7.7) 0.435
LC 10 (3.1) 3 (4.4) 0.708 3 (2.3) 4 (10.3) 0.052
the largest area under the receiver operating characteristic curve (AUC). The Delong method was used to compare the AUC for the predictive value of the new nomogram with those of APACHE II, NEWS, and SOFA regarding 28-day survival of pa- tients with severe sepsis. Finally, a simplified nomogram was developed for the prediction of 28-day mortality with the train- ing set using variables included in the selected model. The per- formances of the nomograms in predicting outcomes were evaluated with respect to discrimination and calibration.17 The Hosmer-Lemeshow goodness-of-fit test was used to assess the suitability of the models, because it showed how well the no- mogram was calibrated; namely, a close approximation be- tween the observed and predicted probabilities shows good calibration and confirms the exportability of the model. There- after, the diagnostic accuracy of the new nomogram generated with the training set was subsequently tested in the validation set. p<0.05 was considered statistically significant.
RESULTS
Study population
A total of 574 patients with suspected severe sepsis underwent
EGDT in the ED during the study period and were initially en- rolled in the present study. Upon chart review, we excluded 13 patients for the following reasons: active gastrointestinal bleed- ing (n=3), a requirement for immediate surgical intervention (n=6), and a non-infectious condition leading to SIRS (n=4) (Fig. 1). We included 561 patients in the final analysis, of whom 393 were randomly allocated to the training set and 168 to the validation set. The baseline characteristics in the training and validation sets that were related to 28-day mortality are sum- marized in Table 1. In the training set of 393 patients, 69 (17.6%) did not survive 28 days. Moreover, there were 39 (23.2%) deaths during the follow-up period in the validation set.
Albumin, base excess, and respiratory rate are independent prognostic factors in the training set Among training set patients, the RR of those who died was higher than that of survivors (21.9±5.8 vs. 19.4±4.0; p<0.001), and body temperature was also significantly different between the groups (p<0.001). There were several differing laboratory findings between the surviving and deceased groups. High RDW, DNI, aPTT, and CRP values were correlated with increased 28- day mortality in severely septic patients (p<0.001, p=0.021, p=0.013, and p=0.049, respectively). Low pH, HCO3- , and BE Table 1. Demographic and Other Features of the Study Population (Continued)
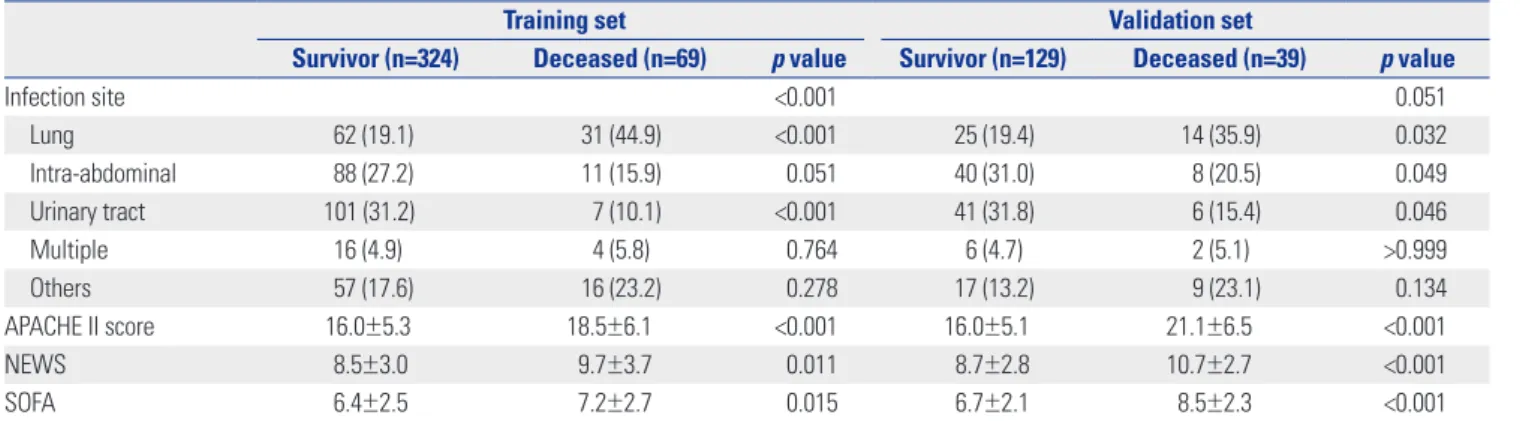
Training set Validation set
Survivor (n=324) Deceased (n=69) p value Survivor (n=129) Deceased (n=39) p value
Infection site <0.001 0.051
Lung 62 (19.1) 31 (44.9) <0.001 25 (19.4) 14 (35.9) 0.032
Intra-abdominal 88 (27.2) 11 (15.9) 0.051 40 (31.0) 8 (20.5) 0.049
Urinary tract 101 (31.2) 7 (10.1) <0.001 41 (31.8) 6 (15.4) 0.046
Multiple 16 (4.9) 4 (5.8) 0.764 6 (4.7) 2 (5.1) >0.999
Others 57 (17.6) 16 (23.2) 0.278 17 (13.2) 9 (23.1) 0.134
APACHE II score 16.0±5.3 18.5±6.1 <0.001 16.0±5.1 21.1±6.5 <0.001
NEWS 8.5±3.0 9.7±3.7 0.011 8.7±2.8 10.7±2.7 <0.001
SOFA 6.4±2.5 7.2±2.7 0.015 6.7±2.1 8.5±2.3 <0.001
SBP, systolic blood pressure; DBP, diastolic blood pressure; HR, heart rate; RR, respiratory rate; BT, body temperature; WBC, white blood cell; HCt, hematocrit;
RDW, red cell distribution width; PLT, platelet count; INR, international normalized ratio; aPTT, activated partial thromboplastin time; DNI, delta neutrophil index;
CRP, C-reactive protein; PCT, procalcitonin; BE, base excess; BUN, blood urea nitrogen; Cr, creatinine; CK-MB, creatine kinase-MB; BNP, N-terminal brain natri- uretic peptide; DM, diabetes mellitus; CRF, chronic renal failure; CHF, congestive heart failure; COPD, chronic obstructive pulmonary disease; LC, liver cirrhosis;
APACHE II, Acute Physiology and Chronic Health Evaluation II; NEWS, National Early Warning Score; SOFA, Sepsis Organ Failure Assessment.
Data are expressed as the mean±SD or n (%). There were no differences between the training set and the validation set except for SOFA.
Table 2. A Multivariate Analysis Predicting 28-Day Mortality in Septic Patients from the Training Set
Model 1 (AUC: 0.7901) Model 2 (AUC: 0.7901) Model 3 (AUC: 0.8173) Model 4 (AUC: 0.8173) OR (95% CI) p value OR (95% CI) p value OR (95% CI) p value OR (95% CI) p value Albumin 0.276 (0.178–0.427) <0.001 0.276 (0.178–0.427) <0.001 0.254 (0.161–0.403) <0.001 0.254 (0.161–0.403) <0.001 BE 0.899 (0.856–0.944) <0.001 0.899 (0.856–0.944) <0.001 0.901 (0.856–0.948) <0.001 0.901 (0.856–0.948) <0.001
RR 1.119 (1.057–1.183) <0.001 1.119 (1.057–1.183) <0.001
AUC, area under the receiver operating characteristic curve; OR, odds ratio; CI, confidence interval; BE, base excess; RR, respiratory rate; APACHE II, Acute Phys- iology and Chronic Health Evaluation II; SOFA, Sepsis Organ Failure Assessment; NEWS, National Early Warning Score.
Each scoring system was entered individually into the multivariate logistic regression analysis with clinical variables and laboratory variables in the training set.
A total of four models were generated by a stepwise multivariate analysis method. Model 1 includes clinical variables, laboratory variables, and APACHE II;
Model 2 includes clinical variables, laboratory variables, and NEWS; Model 3 includes clinical variables, laboratory variables, and SOFA; and Model 4 includes clinical variables and laboratory variables without a scoring system.
values as well as a high lactate value were also significantly as- sociated with increased 28-day mortality (p=0.001, p<0.001, p<0.001, and p<0.001, respectively). Low albumin, high BUN, and high CK-MB values were predictive of increased mortality (p<0.001, p=0.003, and p=0.027, respectively). Procalcitonin values were available for only 150 patients (38.2%) because this test was not performed during the earlier stage of the study pe- riod, and did not show statistical significance predicting 28-day mortality in our study (p=0.267). In the training set, the APACHE II, NEWS, and SOFA scores of deceased patients were higher than those of survivors (18.5±6.1 vs. 16.0±5.3; p<0.001, 9.7±3.7 vs. 8.5±3.0; p=0.011, and 7.2±2.7 vs. 6.4±2.5; p=0.015, re- spectively) (Table 1).
All significant variables in the univariate binary logistic re- gression were considered when generating models to predict 28-day mortality in patients with severe sepsis. Each scoring system was entered individually into the multivariate logistic regression analysis with clinical variables and laboratory vari- ables among the training set (models 1–3). We also created a model that did not include a scoring system (model 4). Conse- quently, four models were generated by a stepwise multivariate analysis method in our study. Because pH is highly correlated with HCO3- , this variable was dropped from subsequent mod- els. Table 2 summarizes the results of the multivariate logistic regression analysis. In the models that included scoring sys- tems, the multivariate logistic analysis revealed that no scoring system was associated with 28-day mortality in patients with severe sepsis. Model 4, which did not include a scoring system, demonstrated the largest AUC value of 0.8173 (95% CI, 0.7605–
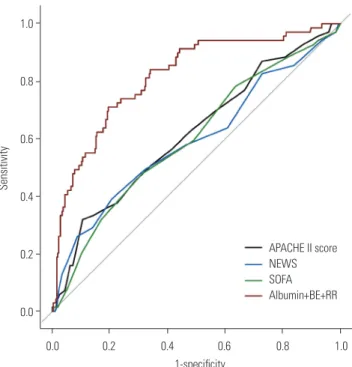
0.8741) among the models. This model was composed of albu- min, BE, and RR as predictive factors and showed a significant- ly higher AUC value than those of conventional scoring systems (p<0.001) (Fig. 2).
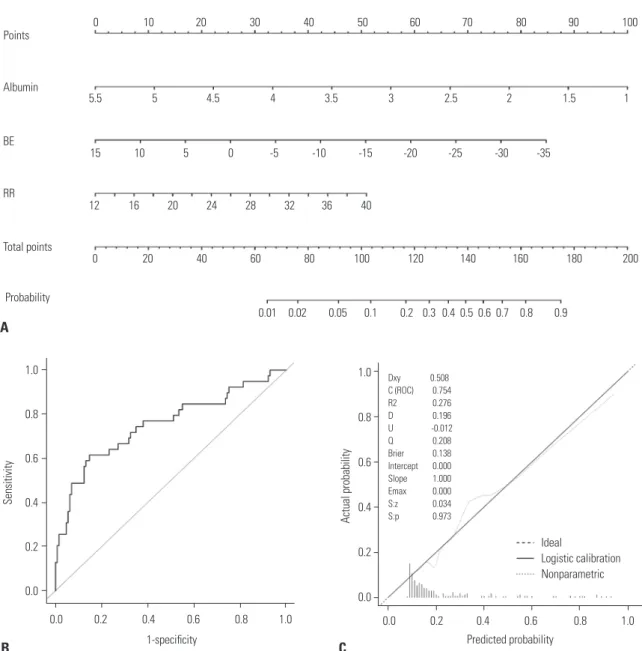
Nomogram shows that hypoalbuminemia, low base excess values, and tachypnea predict 28-day mortality A nomogram incorporating three prognostic factors was estab- lished from the final model (Fig. 3). The nomogram illustrated that albumin was the largest contributor to prognosis, followed by BE and RR. By calculating the total number of points and lo- cating it on the total point scale, we were easily able to draw a straight line down to estimate the predicted probability of 28- day mortality. For example, a 55-year-old man presented with complaints of a 3-day history of fever associated with pneumo- nia. On admission, he presented with tachypnea [20/min (15 points)] and his blood test results were BE=-10 mmol/L (43 points) and albumin=2 g/dL (78 points). The sum of the nomo- gram values was 136, and the predicted probability for 28-day mortality was 43%.
The p value from the Hosmer-Lemeshow test was 0.61 for model 4, indicating that the model was suitable. In the valida- tion set, discrimination was good with an AUC value of 0.7537 (95% CI, 0.6563–0.8512). The calibration plot of the nomogram
presented excellent agreement between predicted and ob- served probabilities of 28-day mortality, and exhibited a close approximation between the probabilities.
DISCUSSION
In this study, we developed and validated a new nomogram us- ing three independent variables to identify 28-day mortality in patients with severe sepsis in the ED. This nomogram is solely based on hypoalbuminemia, a low BE value, and tachypnea, which are easily and readily obtainable during the patient’s course in the ED. Therefore, it can be used to identify patients who are at high risk of severe sepsis and require more aggres- sive treatment. Our nomogram demonstrated a significantly higher AUC value than those of conventional scoring systems, despite it being simpler than such systems.
We found that the initial albumin value sampled at the time of ED admission was associated with 28-day mortality in severe sepsis patients and was the largest contributor to prognosis. Al- bumin, which is considered a negative acute-phase protein, is frequently decreased in the acute phase of several diseases
Fig. 2. Comparisons of APACHE II, NEWS, and SOFA scores versus model 4 in predicting 28-day mortality. Model 4 was composed of albumin, BE, and RR as predictive factors, and showed an AUC value of 0.8173 (95% CI, 0.7605–0.8741). The AUCs of the APACHE II, NEWS, and SOFA scores were 0.6177 (95% CI, 0.5423–0.6931), 0.5940 (95% CI, 0.5137–0.6743), and 0.6005 (95% CI, 0.5256–0.6754), respectively. Model 4 demonstrated a sig- nificantly higher AUC value than those of conventional scoring systems (p<0.001) by the Delong test for comparisons of receiver operating char- acteristic curves. APACHE II, Acute Physiology and Chronic Health Evalu- ation II; NEWS, National Early Warning Score; SOFA, Sepsis Organ Fail- ure Assessment; BE, base excess; RR, respiratory rate; AUC, area under the curve; CI, confidence interval.
1.0
0.8
0.6
0.4
0.2
0.0
0.0 0.2 0.4 0.6 0.8 1.0 1-specificity
Sensitivity
APACHE II score NEWS SOFA Albumin+BE+RR
such as sepsis or trauma, and its levels are reduced by approxi- mately 10–15 g/L within 1 week of the event.18 Hypoalbumin- emia can be caused by reduced hepatic synthesis, a decrease in the supply of amino acids, increased leakage into the interstitial space, and tissue catabolism or distributional issues.19 The re- duction in albumin synthesis during inflammation is likely as- sociated with the effect of monocytic products such as interleu- kin-6 and tumor necrosis factor-α.20 Although the precise mechanisms have not been fully described, serum albumin has protective effects such as maintaining physiologic homeostasis, antioxidant activity, anti-inflammatory effects, and prevention of apoptosis.21,22 Therefore, these protective biologic functions may be impaired in hypoalbuminemic conditions, and in-
creased morbidity and mortality can consequently develop in severely septic patients.23,24 In patients with community-ac- quired bloodstream infection who require intensive care, hypo- albuminemia was an independent risk factor associated with global mortality (odds ratio, 0.34; 95% CI, 0.15–0.76).23 A previ- ous study by Vincent, et al.24 also reported that each 10 g/L de- cline in serum albumin concentration significantly raised the odds of mortality by 137%, morbidity by 89%, prolonged ICU stay by 28%, prolonged hospital stay by 71%, and increased re- source utilization by 66%.
BE was defined as the concentration of titratable hydrogen ion required to return the pH to 7.4 while maintaining PCO2 at 40 mm Hg by equilibration.25 BE can be correlated with the lev-
Fig. 3. The newly developed nomogram and external validation. (A) A nomogram for predicting 28-day mortality among patients with severe sepsis and/or septic shock using the training set. (B and C) External validation of the nomograms using the validation set. The discriminative ability of the nomogram was good, with an AUC value of 0.7537 (95% CI, 0.6563–0.8512) (B). Calibration plots (dotted line) show close approximations to the logistic calibration (solid line), indicating good agreement between the predicted and observed probabilities of 28-day mortality (C). BE, base excess; RR, respiratory rate; AUC, area under the curve; CI, confidence interval.
1.0 0.8 0.6 0.4 0.2 0.0
Predicted probability
0.0 0.2 0.4 0.6 0.8 1.0
Sensitivity
Points
Albumin
Total points
Probability BE
RR
B A
1-specificity C
0.0 0.2 0.4 0.6 0.8 1.0
0 10 20 30 40 50 60 70 80 90 100
5.5 5 4.5 4 3.5 3 2.5 2 1.5 1
15 10 5 0 -5 -10 -15 -20 -25 -30 -35
0 20 40 60 80 100 120 140 160 180 200
0.01 0.02 0.05 0.1 0.2 0.3 0.4 0.5 0.6 0.7 0.8 0.9 12 16 20 24 28 32 36 40
1.0 0.8 0.6 0.4 0.2 0.0
Actual probability
Ideal
Logistic calibration Nonparametric
Dxy 0.508 C (ROC) 0.754 R2 0.276 D 0.196 U -0.012 Q 0.208 Brier 0.138 Intercept 0.000 Slope 1.000 Emax 0.000 S:z 0.034 S:p 0.973
el of deterioration secondary to severe sepsis. The decrease in BE during septic shock is associated with critical reductions in oxygen use, resulting in tissue hypoperfusion, anaerobic me- tabolism, and lactic acidosis.26 Moreover, these were related to mortality in patients with severe sepsis.27 In this study, the ini- tial BE was -6.9±5.3 and -6.9±4.6 mmol/L in survivors vs.
-10.5±6.0 and -10.8±7.6 mmol/L in non-survivors in the train- ing and validation sets (p<0.001 and p=0.004), respectively. This result is consistent with a previous study.28 Some scoring sys- tems used pH and lactate values to evaluate metabolic acidosis with tissue hypoperfusion.29,30 However, BE has been shown to be superior to pH for evaluating metabolic acidosis. Davis, et al.31 reported that BE was superior to pH as a marker of meta- bolic acidosis clearance after shock in a retrospective study of 674 patients. Similarly, BE is superior to lactate, because lactate does not entirely account for metabolic acidosis development from systemic hypoperfusion.27 Accordingly, our scoring sys- tem more accurately estimated metabolic acidosis in patients with severe sepsis by using the BE value.
Tachypnea is a compensatory mechanism for metabolic aci- dosis secondary to sepsis. Respiratory difficulty (defined as tachypnea, low oxygen saturation, or high oxygen requirement) was significantly predictive of mortality in septic patients;
therefore, recent scoring systems such as the Mortality in Emer- gency Department Sepsis (MEDS) and Predisposition Insult Response and Organ Failure (PIRO) incorporated tachypnea as a key criterion.30,32 In our study, the respiratory rates of deceased patients were 21.9±5.8 in the training set and 21.7±6.2 in the validation set. These results met the tachypneic criteria of the MEDS and PIRO systems.
There are several scoring systems to predict outcomes of se- vere sepsis patients, with APACHE II and SOFA being the most popular. However, the predictive ability of these conventional scoring systems was somewhat suboptimal; the AUC for APACHE II was 0.71,33 and that for SOFA was 0.708,34 in previ- ous reports. In our study, the AUC values of APACHE II, NEWS, and SOFA were 0.618, 0.594, and 0.601, respectively; these val- ues were significantly lower than those of our new nomogram.
One explanation for this outcome may be that the conventional scoring systems were designed for patients in the ICU, not for those in the ED as our nomogram was.
Our new scoring system carries the virtues of simplicity and promptitude to predict 28-day mortality in patients with severe sepsis in the ED. In this study, the variables selected in models 3 and 4 were the same; hence, the AUCs of these two models were the same as well. For the simplicity and promptitude of our new scoring system, we ultimately selected model 4, as it does not include the conventional, complex scoring system. Further- more, by building a user-friendly nomogram, our system is more readily available, and predicting mortality in severely sep- tic patients is easier to calculate than with other conventional scoring systems. Our nomogram uses the initial values of vari- ables rather than the worst values; therefore, we are able to pre-
dict mortality earlier, which can be helpful for selecting high- risk patients who require more aggressive interventions. Several studies reported that early, intensive, and effective treatment could decrease the mortality rate by 8–16%.35 Therefore, our no- mogram could be applied to triage decisions, and could be used to select severely ill patients for closer monitoring and ag- gressive treatment. Additionally, our nomogram includes only three independent variables, while others include a greater number of variables and are thus much more complex to cal- culate. Our nomogram could be performed significantly more predictably than other scoring systems, with AUCs of 0.8173 from the training set and 0.7537 from the validation set.
This study has several limitations. The main limitation is that it is a retrospective study of data collected from a single center;
therefore, it is possible that the results could differ from those of other centers, and the predictive probability could be overesti- mated compared to a prospective study. Although we per- formed internal validation to reduce bias, a multi-center study is required for further validation. Another source of bias was the population enrollment criteria, in which organ dysfunction and hypoperfusion were regarded as an initial SBP of <90 mm Hg, despite a 20 mL/kg intravenous crystalloid fluid challenge; or an initial serum lactate level ≥4 mmol/L. These criteria did not completely encompass severe sepsis; however, lactate is a com- monly used marker of hypoxic tissue.36 Accordingly, these pa- tients could be regarded as severely septic in our study. Our no- mogram did not include information such as the cause of infection or the type of cultured pathogen. However, our goal was to construct a system to predict mortality among patients with severe sepsis, but not to identify a specific infection or pathogen. We performed comparisons with conventional scor- ing systems, such as APACHE II, NEWS, and SOFA, but these scoring systems are not intended for use in ED environments.
However, MEDS, Mortality In Severe Sepsis in the Emergency Department, and PIRO have been developed for use in the ED to risk-stratify septic cases.30,32,37 In a future study, we aim to com- pare these scoring systems to ours, and to extend the validation to a multi-center study. An increase in treatment bundle com- pliance improves the outcome of severe sepsis patients.38,39 However, we could not accurately measure the compliance rate of EGDT at our institution because of the retrospective nature of this study. The overall mortality rate of our study population was similar to that of a recently published randomized con- trolled study,40 indicating that our compliance rate was not nec- essarily lower than that observed in a developed country.
In conclusion, our new nomogram is valuable in predicting the 28-day mortality of patients with severe sepsis and/or septic shock at an early stage after ED admission, and it is superior to the APACHE II, NEWS, and SOFA scoring systems in predicting mortality, and is readily available.
REFERENCES
1. Zimmerman JE, Kramer AA, Knaus WA. Changes in hospital mortality for United States intensive care unit admissions from 1988 to 2012. Crit Care 2013;17:R81.
2. Angus DC, van der Poll T. Severe sepsis and septic shock. N Engl J Med 2013;369:840-51.
3. Miller RR 3rd, Dong L, Nelson NC, Brown SM, Kuttler KG, Probst DR, et al. Multicenter implementation of a severe sepsis and sep- tic shock treatment bundle. Am J Respir Crit Care Med 2013;188:
77-82.
4. Kaukonen KM, Bailey M, Suzuki S, Pilcher D, Bellomo R. Mortali- ty related to severe sepsis and septic shock among critically ill pa- tients in Australia and New Zealand, 2000-2012. JAMA 2014;311:
1308-16.
5. Martin GS, Mannino DM, Eaton S, Moss M. The epidemiology of sepsis in the United States from 1979 through 2000. N Engl J Med 2003;348:1546-54.
6. Wang HE, Shapiro NI, Angus DC, Yealy DM. National estimates of severe sepsis in United States emergency departments. Crit Care Med 2007;35:1928-36.
7. Marshall JC, Reinhart K; International Sepsis Forum. Biomarkers of sepsis. Crit Care Med 2009;37:2290-8.
8. Annane D, Bellissant E, Cavaillon JM. Septic shock. Lancet 2005;
365:63-78.
9. Dupuy AM, Philippart F, Péan Y, Lasocki S, Charles PE, Chalumeau M, et al. Role of biomarkers in the management of antibiotic ther- apy: an expert panel review: I - currently available biomarkers for clinical use in acute infections. Ann Intensive Care 2013;3:22.
10. Jones AE, Saak K, Kline JA. Performance of the Mortality in Emer- gency Department Sepsis score for predicting hospital mortality among patients with severe sepsis and septic shock. Am J Emerg Med 2008;26:689-92.
11. Zhao Y, Li C, Jia Y. Evaluation of the Mortality in Emergency De- partment Sepsis score combined with procalcitonin in septic pa- tients. Am J Emerg Med 2013;31:1086-91.
12. Pierrakos C, Vincent JL. Sepsis biomarkers: a review. Crit Care 2010;14:R15.
13. O’Keefe SC, Marshall FF, Issa MM, Harmon MP, Petros JA. Throm- bocytosis is associated with a significant increase in the cancer specific death rate after radical nephrectomy. J Urol 2002;168(4 Pt 1):1378-80.
14. Silvestre J, Póvoa P, Coelho L, Almeida E, Moreira P, Fernandes A, et al. Is C-reactive protein a good prognostic marker in septic pa- tients? Intensive Care Med 2009;35:909-13.
15. Samraj RS, Zingarelli B, Wong HR. Role of biomarkers in sepsis care. Shock 2013;40:358-65.
16. Lee CC, Chen SY, Tsai CL, Wu SC, Chiang WC, Wang JL, et al. Prog- nostic value of mortality in emergency department sepsis score, procalcitonin, and C-reactive protein in patients with sepsis at the emergency department. Shock 2008;29:322-7.
17. Iasonos A, Schrag D, Raj GV, Panageas KS. How to build and inter- pret a nomogram for cancer prognosis. J Clin Oncol 2008;26:1364- 70.
18. Moshage HJ, Janssen JA, Franssen JH, Hafkenscheid JC, Yap SH.
Study of the molecular mechanism of decreased liver synthesis of albumin in inflammation. J Clin Invest 1987;79:1635-41.
19. Franch-Arcas G. The meaning of hypoalbuminaemia in clinical practice. Clin Nutr 2001;20:265-9.
20. Nicholson JP, Wolmarans MR, Park GR. The role of albumin in criti- cal illness. Br J Anaesth 2000;85:599-610.
21. Emerson TE Jr. Unique features of albumin: a brief review. Crit Care Med 1989;17:690-4.
22. Lee JH, Kim J, Kim K, Jo YH, Rhee J, Kim TY, et al. Albumin and C- reactive protein have prognostic significance in patients with com- munity-acquired pneumonia. J Crit Care 2011;26:287-94.
23. Artero A, Zaragoza R, Camarena JJ, Sancho S, González R, Nogueira JM. Prognostic factors of mortality in patients with community- acquired bloodstream infection with severe sepsis and septic shock. J Crit Care 2010;25:276-81.
24. Vincent JL, Dubois MJ, Navickis RJ, Wilkes MM. Hypoalbumin- emia in acute illness: is there a rationale for intervention? A meta- analysis of cohort studies and controlled trials. Ann Surg 2003;237:
319-34.
25. Siggaard-Andersen O, Fogh-Andersen N. Base excess or buffer base (strong ion difference) as measure of a non-respiratory acid- base disturbance. Acta Anaesthesiol Scand Suppl 1995;107:123-8.
26. Chaudry IH. Cellular mechanisms in shock and ischemia and their correction. Am J Physiol 1983;245:R117-34.
27. Mecher C, Rackow EC, Astiz ME, Weil MH. Unaccounted for anion in metabolic acidosis during severe sepsis in humans. Crit Care Med 1991;19:705-11.
28. Noritomi DT, Soriano FG, Kellum JA, Cappi SB, Biselli PJ, Libório AB, et al. Metabolic acidosis in patients with severe sepsis and sep- tic shock: a longitudinal quantitative study. Crit Care Med 2009;
37:2733-9.
29. Knaus WA, Draper EA, Wagner DP, Zimmerman JE. APACHE II: a severity of disease classification system. Crit Care Med 1985;13:
818-29.
30. Howell MD, Talmor D, Schuetz P, Hunziker S, Jones AE, Shapiro NI. Proof of principle: the predisposition, infection, response, or- gan failure sepsis staging system. Crit Care Med 2011;39:322-7.
31. Davis JW, Kaups KL, Parks SN. Base deficit is superior to pH in evaluating clearance of acidosis after traumatic shock. J Trauma 1998;44:114-8.
32. Sankoff JD, Goyal M, Gaieski DF, Deitch K, Davis CB, Sabel AL, et al. Validation of the Mortality in Emergency Department Sepsis (MEDS) score in patients with the systemic inflammatory re- sponse syndrome (SIRS). Crit Care Med 2008;36:421-6.
33. Nguyen HB, Van Ginkel C, Batech M, Banta J, Corbett SW. Com- parison of predisposition, insult/infection, response, and organ dysfunction, acute physiology and chronic health evaluation II, and mortality in emergency department sepsis in patients meet- ing criteria for early goal-directed therapy and the severe sepsis resuscitation bundle. J Crit Care 2012;27:362-9.
34. Wilhelm J, Hettwer S, Hammer D, Schürmann M, Christoph A, Amoury M, et al. Outcome prediction using clinical scores and bio- markers in patients with presumed severe infection in the emer- gency department. Med Klin Intensivmed Notfmed 2012;107:558- 63.
35. Rivers E, Nguyen B, Havstad S, Ressler J, Muzzin A, Knoblich B, et al. Early goal-directed therapy in the treatment of severe sepsis and septic shock. N Engl J Med 2001;345:1368-77.
36. Thomas-Rueddel DO, Poidinger B, Weiss M, Bach F, Dey K, Häber- le H, et al. Hyperlactatemia is an independent predictor of mortali- ty and denotes distinct subtypes of severe sepsis and septic shock.
J Crit Care 2015;30:439.e1-6.
37. Sivayoham N, Rhodes A, Cecconi M. The MISSED score, a new scoring system to predict mortality in severe sepsis in the emergen- cy department: a derivation and validation study. Eur J Emerg Med 2014;21:30-6.
38. Nguyen HB, Lynch EL, Mou JA, Lyon K, Wittlake WA, Corbett SW.
The utility of a quality improvement bundle in bridging the gap be- tween research and standard care in the management of severe sepsis and septic shock in the emergency department. Acad Emerg Med 2007;14:1079-86.
39. Jiang LB, Zhang M, Jiang SY, Ma YF. Early goal-directed resuscita- tion for patients with severe sepsis and septic shock: a meta-anal- ysis and trial sequential analysis. Scand J Trauma Resusc Emerg Med 2016;24:23.
40. Mouncey PR, Osborn TM, Power GS, Harrison DA, Sadique MZ, Grieve RD, et al. Trial of early, goal-directed resuscitation for sep- tic shock. N Engl J Med 2015;372:1301-11.