Neoplastic transformation and tumorigenesis associated with overexpression of phospholipase D isozymes in cultured murine fibroblasts
Do Sik Min
7, Taeg Kyu Kwon
3, Won-Sang Park
1, Jong-Soo Chang
4, Seung-Kiel Park
5, Bong-Hyun Ahn, Zae-Young Ryoo
2, Young Han Lee
6, Yeon Soo Lee
1, Duck-Joo Rhie, Shin-Hee Yoon, Sang June Hahn, Myung-Suk Kim and Yang-Hyeok Jo
Department of Physiology,1Department of Pathology and2Department of Laboratory Animal Research, College of Medicine, The Catholic University of Korea, Seoul, 137-701,3Department of Immunology, College of Medicine, Keimyung University, Taegu,4Department of Life Science, Daejin University, Pochon-gun, Kyeonggido,5Department of Biochemistry, College of Medicine, Chungnam National University, Taejon and
6Department of Biochemistry & Molecular Biology, College of Medicine, Yeungnam University, Taegu, Korea
7To whom correspondence should be addressed Email: [email protected]
Phospholipase D (PLD) has been suggested to play an important role in a variety of cellular functions. PLD activity has been shown to be significantly elevated in many tumours and transformed cells, suggesting the possibility that PLD might be involved in tumorigenesis. In this study, we have established stable cell lines overexpressing PLD1 and PLD2 from fibroblast cells. These cells, but not control cells, showed altered growth properties and anchorage- independent growth in soft agar. Both PLD1 and PLD2 also induced an up-regulation of the activity of matrix metalloprotease-9 as detected by zymograms. Furthermore, both PLD1 and PLD2 transformants, but not vector- transfectants, induced undifferentiated sarcoma when transplanted into nude mice. Both PLD1- and PLD2- mediated cell cycle distributions in stable cell lines revealed an increased fraction of cells in the S phase compared with control cells. Interestingly, the level of cyclin D3 protein, known as an activator of G
1to S phase transition in the cell cycle, was aberrantly high in cells overexpressing PLD1 and PLD2 compared with control cells. These results suggest that overexpression of PLD isozymes may play an important role in neoplastic transformation.
Introduction
Phosphatidylcholine-specific phospholipase D (PLD) enzymes have been implicated in playing an important role in receptor- mediated signal transduction (1). PLD activity is increased in response to treatment of mammalian cells with a variety of mitogenic signals. PLD catalyzes the hydrolysis of phos- phatidylcholine (PC), the main constituent of biomembrane in mammalian cells, into phosphatidic acid (PA) and choline.
Recently, two isoforms of PLD, PLD1 and PLD2, have been described (2,3). Activity of 124 kDa PLD1 is regulated by multiple inputs, including phosphatidyl 4,5-bisphosphate, protein kinase C and the Rho family and ADP-ribosylation factor (ARF) proteins. PLD2 is a 106 kDa protein that shares
Abbreviations: cdk, cyclin-dependent kinase; LPA, lysophosphatidic acid;
MMP, matrix metalloprotease; PA, phosphatidic acid; PLD, phospholipase D.
50–55% homology with PLD1. Although PLD has been implicated in a broad spectrum of physiological processes and diseases, including metabolic regulation, inflammation, secretion, mitogenesis, oncogenesis, neural and cardiac stimu- lation, diabetes and senescence (4), the exact functions of PLD have not been clearly elucidated. Phosphatidic acid in itself has growth factor-like activity (5), regulates the activities of Ras (6) and shows stimulatory effects on important signal- transducing enzymes, such as protein kinase Cα and -ζ (7), raf-1 kinase (8) and phosphatidylinositol 4-phosphate kinase (9,10). In addition, PA can be metabolized to the second messenger diacylglycerol via PA phosphohydrolase, or to lysophosphatidic acid (LPA) via phospholipase A
2. Lyso- phosphatidic acid is a potent mitogen for many mammalian cells (11) and also induces in vitro tumour cell invasion of cellular monolayers (12). The idea has been presented that prolonged activation of PKC induced by continuous genera- tion of diacylglycerol from PLD-generated PA is needed for long-term cellular responses such as cell proliferation and tumorigenesis (13). Aberrations in the growth factor signal transduction pathway often result in uncontrolled cell growth, a characteristic of cellular transformation. PLD activity is elevated in cells transformed by several transforming onco- genes including v-Src (14), v-Ras (15), v-Raf (16) and v-Fps (17), implying chronic stimulation of PLD-dependent PC turnover in these transformed cells. PLD is also critical for the transformed phenotype induced by Src and Ras (18,19) as well as the epidermal growth factor receptor (20).
Recently, it has been reported that PLD activity is signi- ficantly elevated in human breast cancer (21), human renal cancer (22), human gastric cancer tissue (23) and experimental colon cancer (24), suggesting that PLD might be implicated in tumorigenesis. Taken together, these reports suggest that PLD may play a pivotal role in the signal transduction pathways of cellular proliferation and carcinogenesis. However, whether PLD really induces transformation of cells and which isozyme of PLD is involved in this phenomenon are not known.
Therefore, in order to investigate the transforming potential of PLD, we established stable cell lines overexpressing PLD1 and PLD2 from fibroblast cells by transfection of recombinant retroviral vector. In this report, we demonstrate that mouse fibroblasts overexpressing PLD1 and PLD2 form colonies in soft agar and induce undifferentiated sarcoma after injection into nude mice.
Materials and methods
Materials
Polyacrylamide 10% zymogram gels, zymogram renaturing and developing buffers were products of Novex (San Diego, CA). Affinity-purified PLD antibody that recognizes both PLD1 and PLD2 was produced as previously described (25). Enhanced Chemiluminescence Detection (ECL) system was from Amersham (Arlington Heights, IL). Geneticin (G418) was from Gibco- BRL (Grand Island, NY). Anti-cyclin A, B, D3, cdc-2, cdk2, cdk4 and p21 antibodies were purchased from Santa Cruz Biotechnology (Santa Cruz, CA).
Transfection
GP⫹envAm 12 cells (26) derived from NIH3T3 fibroblast cells were grown in Dulbecco’s modified Eagle’s medium containing 10% fetal bovine serum and antibiotics (100 U/ml penicillin, 10µg/ml streptomycin and 0.25 µg/ml amphotericin B) at 37°C under 5% CO2. pLXSN (Clontech, Palo Alto, CA) containing cDNA for PLD1 or PLD2 was used as expression vectors. Cells were transfected either with the empty vector as a control or with the PLD- expression vector using lipofectamin following the procedure recommended by the manufacturer. Transfected cells were subsequently grown in selection medium containing 1 mg/ml G418. After 3 weeks, antibiotic-resistant clones were isolated and expanded for further analysis under selected conditions.
Immunoblotting
Cells were lysed with radioimmune precipitation assay buffer (20 mM HEPES pH 7.2, 1% Triton X-100, 1% sodium deoxycholate, 0.2% SDS, 150 mM NaCl, 1 mM Na3VO4, 1 mM NaF, 10% glycerol, 10µg/ml leupeptin, 10µg/ml aprotinin and 1 mM phenylmethylsulfonyl fluoride). Lysates were sonicated and centrifuged at 10 000 g for 10 min. After surgical removal of tumour mass from nude mice, the tumour tissues were minced and homogenized for extraction of cellular proteins in the lysis buffer. The cleared lysates were subjected to 8% SDS–PAGE. The resolved protein bands were transferred onto a nitrocellulose membrane and probed with anti-PLD antibody. The blotted membrane was then incubated with horseradish peroxidase-conjugated secondary antibody and immunoreactive bands were visualized by chemi- luminescence using ECL reagents (Amersham).
Anchorage-independent growth on soft agar
Cells (5⫻106) were suspended in 10 ml 0.35% (w/v) agarose/standard medium.
The suspended cells were overlaid onto 0.7% (w/v) agarose/standard media supplemented with 200µg/ml genistein in 100-mm dishes and grown at 37°C under 5% CO2. The cultures were replenished with 5 ml DMEM containing 20% fetal bovine serum. After 14–16 days of incubation, colonies in the 0.35% agarose layer were identified and photographed.
Cell proliferation assay
Stable cell transfectants in 96-well plates (3⫻104cells/well) were seeded in DMEM supplemented with either 0.5 or 10% fetal bovine serum and incubated at 37°C for 36 h. Afterwards, cells were incubated for 2 h with CellTiter 96 Aqueous (MTS) solution, absorbance of coloured MTS products in the supernatant was determined on an ELISA reader at 495 nm.
Matrix metalloproteases secretion and activity assay
We performed matrix metalloproteases (MMP) activity assays according to the manufacturer’s instructions (Novex). Before the assays, the medium was replaced with fresh DMEM containing, unless stated otherwise, 100µM LPA.
Medium samples were collected, unless stated otherwise, after 10 h. MMP-9 activity was indicated by clear bands at 92 kDa that appeared after staining with Coomassie brilliant blue and removal of excess dye by a 20 h rinse in water. Gels were scanned and then the image was inverted (clear to black and black to clear) for presentation.
Flow cytometry analysis
After transfectant cells were synchronized in G0/G1by serum starvation for 24 h, 10% fetal calf serum was added for 24 h. Approximately 1⫻106cells were suspended in 100µl PBS, and 200 µl 95% ethanol was added while vortexing. Cells were incubated at 4°C for 1 h, washed with PBS and resuspended in 250µl 1.12% sodium citrate buffer (pH 8.4) together with 12.5µg RNase. Incubation was continued at 37°C for 30 min. Cellular DNA was then stained by applying 250µl 50 µg/ml propidium iodide for 30 min at room temperature. The stained cells were analyzed on a FACScan flow cytometer for relative DNA content based on increased red fluorescence. Cell cycle analysis was performed by flow cytometer using a commercially available software package (Modfit; Verity Winlist, Topsham, ME).
Tumorigenicity studies in nude mice
PLD1, PLD2 and vector transfectant cells were grown and harvested with trypsin. Cells (1⫻106) suspended in 500µl PBS were injected subcutaneously into the left flank of 8-week-old female athymic BALB/C nude mice (Animal Laboratory, The Catholic University of Korea, College of Medicine, Seoul, Korea). Animals were monitored for tumour appearance and tumour growth every day, and the tumour mass was measured. Mice that did not develop tumours were monitored for 16–18 weeks.
Tumour histology and immunohistochemistry
Mice were killed and the tumours removed and fixed in 10% neutral buffered formalin overnight. Tumours were paraffin embedded, sectioned, placed on poly-L-lysine slides and stained with H&E, Masson-trichrome and reticulin.
To evaluate the presence of tumour cell characteristics in histological sections, mouse monoclonal antibody to epithelial membrane antigen (EMA), vimentin
and rabbit polyclonal antibody to PLD isoforms were used. Immunohisto- chemical procedures were performed as previously described (27). The results were reviewed independently by three pathologists. As a safeguard for antibody specificity, adjacent sections were immunostained with the primary antibody omitted or by using mouse or rabbit pre-immune serum.
Results
Overexpression of PLD isoforms in fibroblast cells
To investigate the transforming potential of PLD isozymes, PLD1 and PLD2 in cells, we generated stable cell lines overexpressing PLD isoforms in mouse fibroblasts. The expression of PLD1 and PLD2 was examined with rabbit anti-PLD antibody (Figure 1). Immunoblot analysis of clones transfected with PLD1 or PLD2 showed the presence of a significant amount of PLD1 and PLD2, but not in vector-transfected cells. One of each clone was chosen for characterization.
Overexpression of both PLD1 and PLD2 causes transformation of normal murine cells
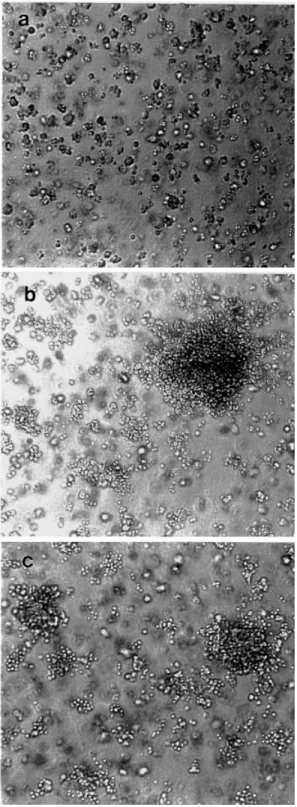
Both PLD1 and PLD2 transfectants appeared to be morpho- logically transformed in culture. Both transformants appeared round in shape and exhibited growth in an aggregate manner, while there was no morphological alteration in control cells that were transfected with empty vector. Other clones of PLDs transfectant showed similar aspect. We examined which isozyme of PLD transfectant formed colonies in soft agar.
Both PLD1 and PLD2 transfectants displayed anchorage- independent growth and formed colonies after 10–14 days of incubation (Figure 2). The cells transfected with empty vector alone did not form any colonies. These results suggest that deregulated expression of PLD isozymes, PLD1 and PLD2, may contribute to cell transformation.
Overexpression of PLD isozymes induces cell proliferation in low serum media
To assess the ability of PLD transfectants to proliferate in low serum medium, we used the CellTiter 96 Aqueous proliferation assay that is based on metabolic conversion of a tetrazolium compound, MTS, to a coloured product by living cells.
The absorbance intensity of the MTS product is directly
Fig. 1. Overexpression of PLD1 and PLD2 in fibroblasts and tumor tissues of nude mice. Mouse fibroblasts were transfected with pLXSN containing PLD1, PLD2 or vector alone. Cells were prepared and lysed for western blotting as described in Materials and methods. Lanes 1–3, cells transfected with vector alone, PLD1 and PLD2, respectively. Tumour tissues from nude mice, which originated from PLD1 (Lane 4) and PLD2 (Lane 5)
transformed cells, were extracted in the lysis buffer. Cell extracts were analyzed by SDS-polyacrylamide gel electrophoresis, followed by transfer of proteins to nitrocellulose membrane and western blotting with anti-PLD antibody.
proportional to the number of viable cells in culture. As shown in Figure 3, low serum treatment significantly increased absorbance in both PLD1 and PLD2 transfectants compared with vector-transfected cells.
Secretion of MMP by both PLD1 and PLD2
We examined whether the overexpression of PLD isozymes could lead to an increase in protease secretion by PLD transfectants. In the zymographic analysis of conditioned media from PLD2 transfectants as well as PLD1 transform- ants, appreciable levels of secreted 92 kDa gelatinase (also
designated MMP-9) were found, but were not found in control cells (Figure 4). When cells were treated with 100 µM LPA for 10 h, MMP-9 secretion was slightly increased in the control, whereas MMP-9 activity accumulated considerably in the media with PLD transfectant cells treated with LPA. These data suggest that enhanced expression of both PLD1 and PLD2 in fibroblast cells can lead to an increased secretion of 92 kDa gelatinase, which may contribute to increased metastatic potential.
Both PLD1 and PLD2 transformants induce tumours after injection into nude mice
To assess the tumorigenicity of PLD transformants, 1⫻10
6cells were injected into 6-week-old female athymic BALB/c nude mice. None of the five nude mice injected with vector- transfected cells developed tumours during the 16–18 weeks of observation. In contrast, both PLD1 and PLD2 transformed cells were found to be highly tumorigenic in all five mice tested (Figure 5). The tumours in nude mice receiving injec- tions of PLD1 and PLD2 transformed cells were detectable at about 1 week after injection, and they grew rapidly thereafter, reaching ~50 mm in diameter at 30 days after injection. The expression levels of PLD1 and PLD2 were investigated with western blots in tumours excised from mice receiving injections of the two transformants. The amounts of PLD1 and PLD2 found in tumour tissues were comparable with those of the injected, transformed cells (Figure 1).
Tumour histology and immunohistochemistry
Grossly, both tumours in nude mice, which were originated from PLD1 and PLD2 transformed cells, showed spherical and well-demarcated masses with a pale yellow rubbery cut
Fig. 2. Cells overexpressing PLD isozymes display a transformed phenotype. Cells stably expressing vector alone (a), PLD1 (b) and PLD2 (c) were seeded in cell suspensions as described in Materials and methods.
(A) The colony formation of cells in soft agar was photographed. (B) A total of 103cells were suspended in soft agar and the percentage of cells that formed colonies was determined 3 weeks later.
Fig. 3. Cells overexpressing PLD isozymes proliferate in low serum media.
Cells stably transfected with vector, PLD1 or PLD2 were plated in 96-well plates (3⫻104cells/well) in DMEM supplemented with either 0.5 or 10%
fetal bovine serum and grown for 24 h. The number of viable cells was determined by the CellTiter 96 Aqueous (MTS) reagent. Differences in absorbance at 490 nm were plotted as relative changes in the number of live cells. Results are the mean⫾ SE of three independent experiments.
Fig. 4. Lysophosphatidic acid induces MMP-9 secretion in cells overexpressing PLD1 and PLD2. Overnight serum-deprived cells (1⫻105cells) were incubated in freshly added DMEM and then treated with or without 100µM LPA. After 10 h, medium samples, 15 µl each, were separated on 10% zymogram gels and MMP-9 activity was assayed as described in Materials and methods. Results are representative of three independent experiments.
surface. Microscopically, the tumours were composed of criss- crossing bundles of uniform spindle cells with dilated and branched blood vessels. The tumour cells showed elongated nuclei and plump cytoplasm with cellular atypia and frequent mitotic figures (Figure 6A). Individual tumour cells were enveloped by reticulin fibres (Figure 6B). On Masson-trichrome staining, the cytoplasm of tumour cells showed fuchinophilia and tumour cells were characteristically separated by focal collagen fibres (data not shown). These tumours were con- sidered to be undifferentiated sarcomas. Immunohistochemical analysis revealed positive reactivity for vimentin and negative reactivity for EMA. Moderate to strong PLD1 and PLD2 expressions were detected in ⬎80% of the total tumour cells (Figure 6C and D). Interestingly, both PLD1 and PLD2 were expressed not only in the cytoplasm, but also in the nucleus.
Fig. 5. PLD1 or PLD2 overexpressing cells are tumorigenic in nude mice.
Subcutaneous inoculation of 1⫻106cells into the left flanks of nude mice induced tumours, while control cells injected into the left flank of the same mice did not induce tumours. Five mice were used for each group. The pictures were taken 4 weeks after inoculation. Mouse injected with (A) cells containing vector; (B) cells overexpressing PLD1 and (C) cells
overexpressing PLD2.
We also found that PLD1 and PLD2 were expressed in both the cytoplasm and nuclear fraction using western blot analysis (data not shown). In contrast, PLD1 and PLD2 were not detected in the surrounding stromal cells and normal squamous epithelia of nude mouse skin.
Cell cycle distribution profile
To investigate PLD-mediated regulation of cell cycle progres-
sion, experiments were conducted using synchronized cell
populations. Vector, PLD1 and PLD2 transfectant cells were
synchronized in G
0/G
1by serum deprivation for 24 h and
released from growth arrest by addition of 10% fetal calf
serum. Entry of cells into S phase was evident by 12 h
following serum stimulation. As shown in Figure 7, cells
overexpressing both PLD1 and PLD2 had a greater proportion
of cells in S phase than vector-transfectant cells.
Fig. 6. PLD1- and PLD2-transfected cells induce undifferentiated sarcomas in nude mice. (A) Tumour composed of criss-crossing bundles of uniform spindle cells with elongated nuclei, plump cytoplasm and frequent mitotic figures (H&E; original magnification,⫻200). Representative picture of PLD1 and PLD2 immunochemically stained samples are shown.
(B) Individual tumour cells were enveloped by reticulin fibers (reticulin stain; original magnification,⫻200). (C) and (D) Immunohistochemical analysis of (C) PLD1 and (D) PLD2 in tumour tissue (original magnification,⫻200).
Aberrant overexpression of cyclin D3 in both PLD1 and PLD2 transformants
Progression through the G
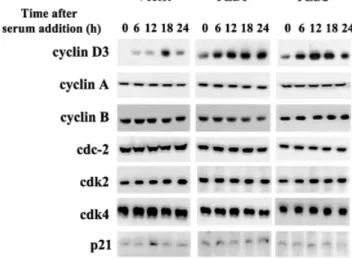
1phase of the cell cycle and entry into S phase in mammalian cells are controlled by a number of proteins including cyclin and cyclin-dependent kinases (cdks). S phase accumulation in PLDs transfectant cells was further investigated by assessing the level of the individual cdks and cyclins involved in cell cycle control. Whole cell lysates were prepared from cells stimulated with serum for various times. Aliquots of 40 µg of each lysate were analyzed for the presence of cdk2, cdk4, cdc2, cyclin D3, cyclin A and cdk inhibitor p21. As shown in Figure 8, western blot analysis showed that overexpression of PLD1 and PLD2 did not affect the levels of cdk2, cdk4, cdc2, cyclin A or p21. However, the most striking point was the finding that cyclin D3 was aberrantly up-regulated in both PLD1 and PLD2 transformants.
These results suggest that the increased population of cells in S phase from cells overexpressing both PLD1 and PLD2 correlates with the aberrantly up-regulated cyclin D3 level.
Discussion
In the present study, we demonstrated that overexpression of PLD isozymes induced tumorigenic transformation of fibro- blasts through observations such as anchorage-independent growth in soft agar and the development of undifferentiated sarcoma in nude mice. PLD activity has been found to be markedly elevated in various cancer tissues (21–24), cancer cell lines and their multidrug resistant counterparts (28), and transformed cells (14–17). Furthermore, the activation of PLD results in the prolonged, not transient, formation of diacylglycerol (29), and consequently causes the long-term activation of protein kinase C, which is necessary for prolifera-
Fig. 7. FACS cell-cycle distribution analysis. Cell cycle distribution among vector, PLD1 or PLD2 transfectant cells by addition of 10% serum for 12 h after serum deprivation for 24 h, was analyzed by propidium iodide staining of DNA content and flow cytometry. The results of a representative study are presented; two additional experiments yielded equivalent results.
tion and tumorigenesis (30). The relationship between PLD
and cancer is further supported by the recent findings that
some antitumour drugs act as inhibitors of PLD (31). However,
whether PLD really induces transformation of cells and which
type of PLD isozyme is involved in the tumorigenesis are not
known. Therefore, to investigate the potential role of PLD
isoforms in tumorigenesis, we established cell lines that
overexpress human PLD1 and PLD2 from mouse fibroblast
cells (26) which has been shown to efficiently transfer retroviral
vector. It was suggested that cells are very intolerant of PLD
expression (20). Nevertheless, we attempted to express PLD1
or PLD2 in parental NIH3T3 cells. However, we could not
obtain cells expressing a high level of PLD. Thus, expression
of PLD isozymes in parental NIH3T3 cells may be toxic,
Fig. 8. Expression levels of cell cycle regulatory proteins in vector and PLD transfectant cells. Vector and PLD transfectant cells were synchronized in G0/G1by serum deprivation for 24 h and then serum was added at the indicated time points. Equal amounts of cell lysates (40µg) were resolved by SDS–PAGE, transferred to nitrocellulose and probed with specific antibodies. Proteins were detected by enhanced chemiluminescence. A representative blot is shown; three additional experiments yielded similar results.
which is consistent with previous reports suggesting that a high level of PLD expression is difficult to obtain (32).
This could be from the difference of cell lines. However, GP ⫹envAm 12 cells, a derivative of NIH3T3, which we used were tolerant of higher expression levels of PLD. Although the cells are more prone to transformation, we performed carefully controlled experiments. We found that in cells overexpressing PLD1 (33) or PLD2 (data not shown), PLD activity was increased by LPA much more than that from vector transfectant cells. Overexpression of PLD isozymes in fibroblast cells increased growth rates and reduced serum requirements for growth compared with control cells. Expres- sion levels of PLD1 and PLD2 in tumours developed by PLD transfectants were comparable with those of cells over- expressing PLDs. Fibroblast cells, when overexpressing PLD isozymes, lost their original morphology and became round in the culture dish. In addition, transformants of both PLD1 and PLD2 formed foci in soft agar, which was not the case for control cells. These altered cell morphology and growth properties suggest that the mouse fibroblast cells overexpress- ing PLD1 and PLD2 were transformed. Anchorage-independent growth in vitro correlates best with tumorigenicity in vivo (34). Secretion of matrix metalloproteases (MMPs) from cancer cells is an important stage in invasion and metastasis. Recently, Williger et al. (35) reported that activation of protein kinase C increased MMP-9 secretion in human fibrosarcoma cells and implicated PLD and PA formation in the effect. In this study, MMP-9 activity was elevated in both PLD1- and PLD2- transformed cells in unstimulated conditions, as detected by zymography, but was not observed in vector-transfectants.
LPA, known to be a potent mitogen, markedly induced MMP-9 secretion in both PLD1 and PLD2 transformed cells.
Consistent with these findings, both PLD1 and PLD2 trans- formants, but not control cells, induced the development of undifferentiated sarcoma in nude mice. PLD1 and PLD2 were not detected in the surrounding stroma cells of the tumours.
These results demonstrate that overexpression of PLD iso- zymes, and not just the cells, contribute to tumorigenesis. The
tumours appeared after a short latent period and grew rapidly, thereby excluding the possibility that secondary alterations selected in vivo were responsible for the tumorigenic pheno- types of these cells. This is supported by the inability of the control vector transfectant to form tumours. Recently, it was reported that PLD1 and PLD2 were overexpressed in human breast cancer (21) and human renal cancer (22), respectively.
In addition, our findings provide evidence that both PLD1 and PLD2 isozymes are involved in tumorigenesis. At present, we don’t know whether or not the phenomenon requires enzymatic activity. It is possible that some domain present in PLD isozymes may be involved in the development of neoplastic transformation.
How can overexpression of PLD lead to cellular transforma- tion? Oncogenic signal transduction pathways have recently been shown to impact cell cycle regulatory proteins. Cancer is increasingly viewed as a cell cycle disease (36). Therefore, it is possible to envision mechanisms linking overexpression of PLD to cell cycle deregulation. Although it appears that the oncogenic defects may target any major transition or checkpoint of the cell cycle, strikingly, the deregulated step is G
1/S control. Cell cycle regulators critical for error-free execu- tion of these events encompass the D-type cyclins with their partner cyclin-dependent kinases cdk4 and cdk6. Previous reports suggest that cyclin D and cyclin E are rate-limiting activators of the G1 to S phase transition and cyclin D might play a specialized role in facilitating emergence from quiescence (37). In this study, we have shown that overexpres- sion of PLD1 or PLD2 in mouse fibroblast cells very potently induces the expression of cyclin D3 protein compared with that from control cells. Therefore, aberrantly overexpressed cyclin D3 in serum-stimulated cells may increase their rates of G
1to S phase transit by several hours. Thus, deregulated expression of PLD may be directly linked to the complex process of oncogenesis. Although the neoplastic mechanism of these proteins is at present not clear, it can be suggested that an abnormally high concentration of signalling molecules may perturb the equilibrium sustained in normal cells (38).
Elucidation of this pathway may help to shed some light on our understanding of the tumorigenic pathway of the PLD isozymes. We believe that two mouse fibroblast cell lines overexpressing PLD1 and PLD2, established in this study or cell lines prepared from tumours developed by PLD1 and PLD2-overexpressed cells will be useful for future studies of the molecular mechanism of both PLD1 and PLD2 involvement in tumorigenesis. Our present observations provide solid evid- ence that overexpression of PLD isoforms, PLD1 and PLD2, can transform cells. Thus, PLD signalling may contribute to the promotion and/or progression of cancers.
Acknowledgements
This work was supported by Korea Research Foundation grant KRF-2000- 042-F00007 and a research grant from the Ministry of Education (BK21).
References
1. Exton,J.H. (1997) Phospholipase D: Enzymology, mechanisms of regulation and function. Physiol. Rev., 77, 303–320.
2. Hammond,S.M., Jenco,J.M., Nakashima,S., Cadwallader,K., Gu,Q.-M., Cook,S., Nozawa,Y., Prestwich,G.D., Frohman,M.A. and Morris,A.J.
(1997) Characterization of two alternately spliced froms of phospholipase D1. J. Biol. Chem., 272, 3860–3868.
3. Colley,W.C., Sung,R., Jenco,R.L., Hammond,S.M., Altshuller,Y., Bar-Sagi, D., Morris,A.J. and Frohman,M.A. (1997) Phospholipase D2, a distinct phospholipase D isoform with novel regulatory properties that provokes cytoskeletal reorganization. Curr. Biol., 7, 191–201.
4. Exton,J.H. (1994) Phosphatidylcholine breakdown and signal transduction.
Biochim. Biophys. Acta, 1212, 26–42.
5. Moolenaar,W.H., Kruijer,W., Tilly,B.C., Verlaan,I., Bieman,A.J. and de Laai,S.W. (1986) Growth factor-like action of phosphatidic acid. Nature, 323, 171–173.
6. Tsai,M.H., Yu,C.L., Wei,P.S. and Staccy,D.W. (1989) The effect of GTPase activating protein upon ras is inhibited by mitogenically responsive lipids.
Science, 243, 522–526.
7. Limatola,C., Schaap,D., Moolenaar,W.H. and van Blitterswijk,W.J. (1994) Phosphatidic acid activation of protein kinase C-ζ overexpressed in COS cells: Comparison with other protein kinase C isotypes and other acidic lipids. Biochem. J., 304, 1001–1008.
8. Ghosh,S., Strum,J.C., Sciorra,V.A., Daniel,L. and Bell,R.M. (1996) Raf-1 kinase possesses distinct binding domains for phosphatidylserine and phosphatidic acid. Phosphatidic acid regulates the translocation of Raf-1 in 12-O-tetradecanoyl-13-acetate-stimulated Madin–Darby canine kidney cells. J. Biol. Chem., 271, 8472–8480.
9. Mortiz,A., De Graan,P.N., Gispen,W.H. and Wirtz,K.W.A. (1992) Phosphatidic acid is a specific activator of phosphatidylinositol-4-phosphate kinase. J. Biol. Chem., 267, 7207–7210.
10. Jenkins,G.H., Fisette,P.L. and Anderson,R.A. (1994) Type I phosphatidyl- inositol 4-phosphate 5-kinase isoforms are specifically stimulated by phosphatidic acid. J. Biol. Chem., 269, 11547–11554.
11. Van Corven,E.J., Groenink,A., Jalink,K., Eichholtz,T. and Moolenaar,W.H.
(1989) Lysophosphatidate-induced cell proliferation: Identification and dissection of signaling pathways mediated by G proteins. Cell, 59, 45–54.
12. Imamura,F., Horai,T., Mukai,M., Shinkai,K., Sawada,M. and Akedo,H.
(1993) Induction of in vitro tumor invasion of cellular monolayers by lysophosphatidic acid or phospholipase D. Biochem. Biophys. Res.
Commun., 193, 497–503.
13. Nishizuka,Y. (1995) Protein kinase C and lipid signaling for sustained cellular responses. FASEB J., 9, 484–496.
14. Song,J., Pfeeffer,L.M. and Foster,D.A. (1991) v-Src increases diacylglycerol levels via a type D phospholipase-mediated hydrolysis of phosphatidylcholine. Mol. Cell. Biol., 11, 4903–4908.
15. Jiang,H., Lu,Z., Luo,J.-Q., Wolfman,A. and Foster,D.A. (1995) Ras mediates the activation of phospholipase D by v-Src. J. Biol. Chem., 270, 6006–6009.
16. Frankel,P.A., Ramos,M., Flom,J., Bychenok,S., Kerkhoff,E., Rapp,U.R., Feig,L.A. and Foster,D.A. (1999) Ral and Rho dependent activation of phospholipase D in v-Raf transformed cells. Biochem. Biophys. Res.
Commun., 255, 502–507.
17. Jiang,Y.-W., Song,J., Zang,Q. and Foster,D.A. (1994) Phosphatidylcholine- specific phospholipase D activity is elevated in v-Fps-transformed cells.
Biochem. Biophys. Res. Commun., 203, 1195–1203.
18. Urano,T., Emkey,R. and Feig,L.A. (1996) Ral GTPases mediate a distinct downstream signaling pathway from Ras that facilitates cellular transformation. EMBO J., 16, 810–816.
19. Aguirre Ghiso,J., Frankel,P., Lu,Z., Jiang,H., Farias,E., Olsen,A., Feig,L.A., Bal de Kier Joffe,E. and Foster,D.A. (1999) RalA requirement for v-Src- and v-Ras-induced tumorigenicity and overproduction of urokinase-type plasminogen activator and metalloprotease. Oncogene, 18, 4718–4725.
20. Lu,Z., Hornia,A., Joseph,T., Sukezane,T., Frankel,P., Zhong,M., Bychenok,S., Xu,L., Feig,L.A. and Foster,D.A. (2000) Phospholipase D and RalA cooperate with EGF receptor to transform 3Y1 rat fibroblasts.
Mol. Cell. Biol., 20, 462–467.
21. Uchida,N., Okamura,S. and Nagamachi,Y. (1997) Increased phospholipase D activity in human breast cancer. J. Cancer Res. Clin. Oncol., 123, 280–285.
22. Zhao,Y., Ehara,H., Akao,Y., Shamoto,M., Nakagawa,Y., Banno,Y., Deguchi,T., Ohishi,N., Yagi,K. and Nozawa,Y. (2000) Increased activity and intranuclear expression of phospholipase D2 in human renal cancer.
Biochem. Biophys. Res. Commun., 278, 140–143.
23. Uchida,N., Okamura,S. and Kuwano,H. (1999) Phospholipase D activity in human gastric carcinoma. Anticancer Res., 19, 671–676.
24. Yoshida,M., Okamura,S., Kodaki,T., Mori,M. and Yamashita,S. (1998) Enhanced levels of oleate-dependent and arf-dependent phospholipase D isoforms in experimental colon cancer. Oncol. Res., 10, 399–406.
25. Lee,M.-Y., Jo,Y.-H., Chun,M.-H., Chung,J.-W., Kim,M.-S. and Min,D.S.
(2000) Immunohistochemical localization of phospholipase D1 in rat central nervous system. Brain Res., 864, 52–59.
26. Markowitz,D., Golff,S. and Bank,A. (1988) Construction and use of a safe and efficient amphotropic packaging cell line. Virology, 167, 400–406.
27. Lee,S.H., Kim,S.Y., Lee,J.Y., Shin,M.S., Dong,S.M., Na,E.Y., Park,W.S., Kim,K.M., Kim,C.S., Kim,S.H. and Yoo,N.J. (1998) Detection of soluble Fas mRNA using in situ reverse transcription-polymerase chain reaction.
Lab. Invest., 87, 453–459.
28. Fiucci,G., Czarny,M., Lavie,Y., Zhao,D., Berse,B., Blusztajn,J.K. and Liscovitch,M. (2000) Changes of phospholipase D isoform activity and expression in multidrug-resistant human cancer cells. Int. J. Cancer, 85, 882–888.
29. Liscovitch,M. (1997) Crosstalk among multiple signal-activated phospholipases. Trends Biochem. Sci., 17, 393–399.
30. Boarder,M.R. (1994) A role for phospholipase D in control of mitogenesis.
Trends Pharmacol. Sci., 15, 57–62.
31. Gratas,C. and Powis,G. (1993) Inhibition of phospholipase D by agents that inhibit cell growth. Anticancer Res., 13, 1239–1244.
32. Hornia,A., Lu,Z., Sukezane,T., Zhong,M., Joseph,T., Frankel,P. and Foster,D.A. (1999) Antagonistic effects of protein kinase C a and d on both transformation and phospholipase D activity mediated by the epidermal growth factor receptor. Mol. Cell. Biol., 19, 7672–7680.
33. Hong,J.-H., Oh,S.-O., Lee,M., Kim,Y.-R., Kim,D.-U., Hur,G.-M., Lee,J.H., Lim,K., Hwang,B.-D. and Park,S.-K. (2001) Enhancement of lysophosphatidic acid-induced ERK phosphorylation by phospholipase D1 via the formation of phosphatidic acid. Biochem. Biophys. Res. Commun., 281, 1337–1342.
34. Freedman,V.H. and Shin,S. (1974) Cellular tumorigenecity in nude mice:
correlation with cell growth in semi-solid medium. Cell, 3, 355–359.
35. Williger,B.-T., Ho,W.-T. and Exton,J.H. (1999) Phospholipase D mediates matrix metalloprotease-9 secretion in phorbol ester-stimulated human fibrosarcoma cells. J. Biol. Chem., 274, 735–738.
36. Sherr,C.J. (1996) Cancer cell cycles. Science, 274, 1672–1677.
37. Resnitzky,D., Gossen,M., Bujard,H. and Reed,S.I. (1994) Acceleration of the G1/S phase transition by expression of cyclin D1 and E with an inducible system. Mol. Cell. Biol., 14, 1669–1679.
38. Hunter,T. (1997) Oncoprotein networks. Cell, 88, 333–346.
Received March 13, 2001; revised June 4, 2001; accepted July 11, 2001