http://dx.doi.org/10.7840/kics.2013.38B.10.832
Asynchronous Cooperative Spectrum Sensing Scheme on Primary Users with Fast “On/Off” State Variations in Spectrum Sensing
Windows
Jingying Jin, Junrong Gu*, Jae Moung Kim°
ABSTRACT
Cognitive Radio has attracted intensive interests of the researchers, recently. The data rate always increases in the emerging technologies. The increased data rate poses mainly two challenges for spectrum sensing. One is that the state of primary user (PU) is fast and alternatively varying between “on/off” in a spectrum sensing window. The other is that the asynchronicity among the reports in a cooperative spectrum sensing setting becomes more apparent. Both of them would deteriorate the spectrum sensing performance. Thus, we propose an asynchronous cooperative spectrum sensing method to cope with these two challenges. A likelihood ratio test based spectrum sensing is developed for a single cooperator. The likelihood ratio is obtained in the setting of fast varying PU state. The likelihood ratio test is uniformly powerful according to the Neyman-pearson lemma.
Furthermore, the asynchronicity among the cooperators are studied. Two sets of fusion weights are discussed for the asynchronous time among cooperators. One is designed based on the condition probability of the PU state variation and the other one is designed based on the queueing theory. The simulation results are provided with different fusion methods. The performance improvements are demonstrated.
Key Words : asynchronous cooperative spectrum sensing; fast "on/off" varying primary user, cognitive radio
First Author:인하대학교 정보통신공학과 무선전송 연구실, [email protected], 학생회원
° Corresponding Author:인하대학교 정보통신공학과 무선전송 연구실, [email protected], 종신회원
* 인하대학교 정보통신공학과 무선전송 연구실, [email protected]
논문번호:KICS2013-07-302, 접수일자:2013년 7월 23일, 최종논문접수일자:2013년 9월 9일
Ⅰ. Introduction
Cognitive radio is developed to reuse the underutilized spectrum which is licensed to the incumbent user (primary user, PU) in order to improve the utilization efficiency of the wireless frequency resources. Cognitive user (secondary user, SU) is intelligently enabled by the cognitive radio to transmit data on the interested frequency band. Spectrum sensing is one main function to discover the spectrum opportunities. It is continuously conducted to monitor the spectrum state (idle/busy) and then, if it is idle, the SU utilize the discovered spectrum opportunities via
dynamic access. Once the returning of PU is reported, SU would immediately stop its data transmission and vacate its occupation until the interested frequency band is report idle again.
IEEE 802.22 WRAN standard has developed
for CR techniques to share the white space of
TV frequency spectrum
[1]. The nearby radio
environment is sensed, then the spectrum
opportunity is discovered and accessed, so as to
avoid the interference to the original licensed
holders. In addition, the other standards, such as
WiFi (IEEE 802.11), WiMax (IEEE 802.16), and
Zigbee (IEEE 802.15.4) also include some degree
of CR technologies.
Spectrum sensing is one of most important function in CR. The spectrum sensing methods can be roughly classified as energy detector, matched filter and cyclostationary feature detector respectively
[2-4]. The energy detector is widely adopted due to its low computation and implementation complexities. It simply compares the output signal power of energy detector with a threshold to determine the presence of the licensed user. However, it is sensitive to noise.
The matched filter method is known as the optimal detector but require perfect pre-knowledge of the licensed users features. Cyclostationary feature detection is a method for detecting licensed user transmissions by exploiting the cyslostationarity features of the received signals, which is with relatively high computation complexity. Cyclostationary features can assist spectrum sensing because they are caused by the periodicity in the signal or its statistics, such as, the autocorrelation. Moreover, eutrophy based spectrum sensing has been investigated to improve detection performance
[5].
Conventional single node spectrum sensing has limited sensing ability, whose performances are not stable because of, e.g., hidden primary user problem, noise uncertainty, fading or shadowing
[6,7]. For these reasons, cooperative diversity and data fusion technologies are applied to spectrum sensing, which is called cooperative spectrum sensing. Cooperative sensing network can be built by cooperating among cognitive radios.
Since the data rate is always increasing in the newly emerging systems, this phenomenon poses mainly two challenges for (cooperative) spectrum sensing. One is that the state of PU might varies multiple times between "on" and "off" during a spectrum sensing window. As a result, the performance of spectrum sensing would decrease dramatically
[8,9]. The other is that when the PU data rate is relative high, the asynchronous effects among the reports of the cooperators becomes more manifest. At the fusion center, the performance of spectrum sensing would become
unstable. The asynchronicity mainly comes from the observation delay, the drifting of the time clock of each cooperator and the transmission delay.
In the current literatures, these two challenges are not adequately addressed. The fast varying of PU state is considered in reference
[8-11]. In Ref
[8], the PU state is considered only varying once.
Based on it, an improved detector is proposed.
Ref
[9]. compares the performance decreasing of different types of detectors, while the PU state is still considered varying once during a spectrum sensing window. Ref
[10]. designs a new energy detection method based on Bayesian principle, which also only considers a single state changing of PU. The case of multiple states changes is discussed in Ref.
[11]. The performance decreasing is analyzed based on energy detection method, however, no spectrum sensing method is developed. On the other hand, the asynchronicity among the cooperators in the cooperative spectrum sensing is rarely considered.
Thus, we would propose an asynchronous spectrum sensing method to address these two challenges. To cope with the fast varying PU state during a spectrum sensing window, we provide a likelihood ratio test based spectrum sensing method. Especially, the likelihood ratio is obtained for the fast varying case of PU during a spectrum sensing window. According to the Neyman-pearson lemma, the likelihood ratio test based detector is uniformly powerful regarding certain false alarm probability. The close forms of detection probability and the false alarm probability are not presented due to the complexity of the sum of the likelihood ratio. To address the asynchronicity among the cooperators, we propose two weighted cooperative spectrum sensing methods, for which the weights are designed to account for the asynchronicity. One set of weights is designed by utilizing the conditional probability for the PU state change and the other set of weights is designed based on the queueing theory for sequential detection.
Furthermore, the numerical results are given for
the soft fusion and hard fusion respectively. The soft fusion is an extension for above likelihood ratio test based spectrum sensing, thus shares its all merits.
The remains of our work are organized as follows. The preliminaries and system is described in section II. In section III, the novel spectrum sensing method for single user is formulated. In section IV, based on the proposed single user sensing model, we proposed two new asynchronous fusion rule for cooperative spectrum sensing. The numerical results are shown in section V. Finally section VI concludes the paper.
Ⅱ. Preliminaries and System Model
2.1. Preliminaries on PU state evolution Usually, PU resides in the interested frequency band. Its state changing probability is provided next. The state of PU channel observed by a SU is generally follows a continuos-time alternating renewal process
[12], which can be characterized by two probability density functions
and
separately denoting the probability distribution of the busy period
and idle period
. It’s worth pointing out that the widely used Gilbert-Elliot model (a two state Markov chain) is a special case of the alternating renewal process where the on (off) periods are exponentially (in the case of continuous time) or geometrically (in the case of discrete time) distributed
[13]. Here, we assume that the "on/off" period is following exponential distributions through this paper as below
(1)
where
and
. Hence the transition probability of PU channel can be described by a set of conditional probabilities
with ∈ as follow
[13]
(2) where
denote the probability that state
now observed if state was observed time before. And
is termed as channel utilization.
2.2. System Model
A single channel is considered. Cooperative spectrum sensing (CSS) is adopted to guarantee relative high detection accuracy regardless the interested frequency band is influenced by any impairment such as multipath, shadowing or fading. Most existing work relate to CSS need perfect synchronization among the cooperators.
After one sensing interval, every cooperator only has one local test result forwarded to fusion center. Nevertheless, the considerable overhead and implement complexity of synchronization will make CSS not practical sometimes. On the other hand, asynchronous CSS is much more lightweight and easy to implement.
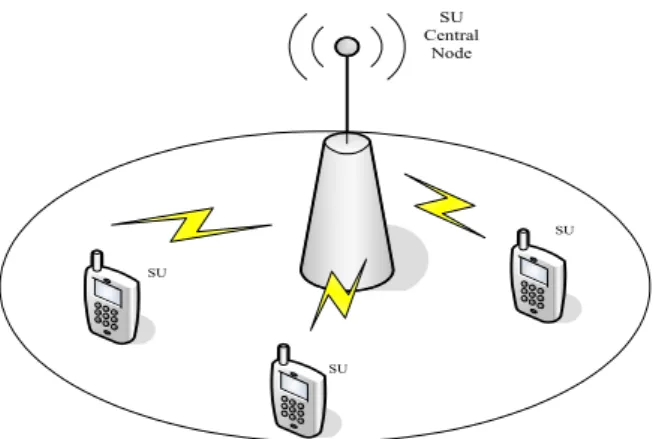
In this paper, a few of SUs is considered working in a centralized manner as shown in Fig.1, n SU central node works as a fusion center to collect sensing results from other SUs (cooperators) and then make final decision from the collected information. We assume every SU node has the same detection ability and perform spectrum sensing independently.
SU
SU
SU
SU Central
Node
Fig. 1. Cooperative spectrum sensing model
Next, we would formulate the likelihood ratio
test based spectrum sensing as a non-cooperative spectrum sensing method. The asynchronous cooperative spectrum sensing is presented based on it. Since the reports asynchronously arrive at the fusion center, we term our method as asynchronous cooperative spectrum sensing. The channel parameters would be introduced and specified wherever needed. The PU signal is considered following Gaussian distribution at the SU spectrums sensing side, where the PU signal can be rayleigh-faded.
Ⅲ. Problem Formulation for the Spectrum Sensing of a Single User
3.1. Conventional energy detector
Fig.2 shows the model of conventional energy detector. Firstly, the received signal is pre-filtered by a band-pass filter with band-width , then the output signal of the band-pass filter is squared and accumulated over a time interval . The output signal of integrator acts as a test statistics and is compared with a threshold to decide whether the primary user is present.
BPF ∑
= N n 1
2
Threshold Device
Fig. 2. Block diagram of conventional energy detector
Denote
as the hypothesis that primary user is absent and
as the hypothesis that primary user is present. Let
be the
received signal vector from the interest frequency band at cognitive radio user. And indexes the received samples, is the sample size used for spectrum sensing. Spectrum sensing can determine the hypothesis by processing the received signal vector. The received signal under
and
can be written as
(3) where
is additive white Gaussian noise
(AWGN) with zero mean and variance
. Let
indicates the PU signal. At
,
is considered follows Gaussan distribution
[14]
.
The conventional energy detector just compares the output test statistics with a threshold
and then estimate the state of interested frequency band, which could be written as
≻
≺
(4)
The test statistics can be viewed as the sum of the squares of Gaussian variables which follows the chi-square distribution. Therefore, the detection probability
and the false alarm probability
can be calculated as
[15]
≻
(5)
≻
(6)
where ∙ is the generalized Marcum function, ∙ is the gamma function and
∙∙ is the incomplete gamma function respectively.
3.2. Likelihood ratio test based spectrum sensing
When the PU has no state change in the spectrum sensing period, the energy detection is equivalent to the likelihood ratio test. However, if the PU with multiple state changes, the energy detector is not the most powerful detector anymore. Here, we provide a likelihood ratio test based spectrum sensing method to achieve better detection performance.
The spectrum sensing should be accuracy and
in time. Thus, the last received sample
in the
spectrum sensing window should be the one being
believed in most. Naturally, at sampling
, PU
can be in either state "on" or state "off". With
above assumption, the likelihood function can be
obtained under
and
, respectively.
3.2.1. Likelihood function in
Note
∙ indicates the channel noise distribution which follows
and ∙
indicates the received signal distribution which follows
.
Supposing at sampling
PU is "on" . Recall
and
denote the probabilities that PU were in state "0" and "1" at time ago when it is in state "1" now. Then, at time ago, the probability of PU in state "0" and "1" are
and
respectively. Therefore, the probability of sampling
could be written as
. The distribution of sampling
is
. Accordingly, the probability of sampling
would be obtained
.
Thus, the likelihood function would be written as
(7)
3.2.2. Likelihood function in
The likelihood function under
can be obtained in a similar way
(8) And the likelihood ratio test based detection method could be written as
≻
≺′
(9) Equation (9) can be simplified by taking the logarithm of both sides. Thus, we have
≻
≺
(10)
To obtain a more simplified form, one might let
and
. Thus
the probability distribution of the sampling
under
and
can be approximated as the Gaussian distribution with zero mean and variance
,
respectively. And then the right side of (10) is obtained
ln′ ln
ln
(11) The left side of (10) could be simplified as a summation as in (11) , which is shown below
≻≺(12) By the reason of the case
≻
or
≺
, the distribution of (12) becomes very complex. It is not Chi-square. Due to the complexity, its not further discussed. For the
and
with a certain threshold, in this case, they could be obtained by testing.
Ⅳ. Asynchronous Cooperative Spectrum Sensing
In this section the asynchronous cooperative spectrum sensing is presented. The "asynchronous"
indicates the asynchronicity of the spectrum
sensing at each cooperator and the arrival time of
the reports at the fusion center. The local
spectrum sensing is performed periodically with
the same period but not synchronized among all
cooperators. We assume that when the cooperator
performs spectrum sensing individually, the report
is sent through a report channel to fusion center
as soon as local spectrum sensing is finished.
Generally, there are two kind of fusion, the hard fusion and the soft fusion
[16]. We would provide the asynchronous cooperative spectrum method accordingly.
4.1. Asynchronous cooperatives spectrum sensing with hard fusion.
In cooperative spectrum sensing, the hard fusion fuses the reports which are an mixture of
"0s"and "1s", which are the received reports indicating the decisions from the cooperators. The received vector from cooperators can be written as
, is indicates the number of cooperators, and we assume that every cooperator can perform spectrum sensing independently. Since we consider the case of asynchronous reporting, the fusion center will receive a series of local reports in sequential.
According the rule of likelihood ratio test for sequential detection, the likelihood ratio function of received vector in fusion center can be written as
(13)
In this paper, the arrival time of every local decision is approximated as exponentially distribution
, and other distribution like Erlang distribution can be examine in the same way. There are two fusion rules which will be discussed next by giving different weight to account for the asynchronicity.
4.1.1. Fusion rule 1
Based on queueing theory, if the arrival time follows an exponentially distribution
, the probability of local decision arrived fusion center should be
. The weight give to every local decision can be written as
(14)
where varies from 1 to , and is the number of cooperators. It is observed that the late-arrival local report will be given larger weight. It is reasonable because late-arrival reports is more reliable in determining the presence of primary user based on our assumption. So that the likelihood ratio function of received reports with considering the weight in fusion center can be written as
(15) Now we discuss how to derive the threshold
. From (13) and (14)
and
can be written as
(16)
(17)
where
indicates the decision domain in
.
has a certain value to every cooperator because the arrival time for each cooperator is known by fusion center. Substitute
≻ to (17), we obtained
≻
(18)
thus
≺
, when we take the upper
limit value
, the likelihood ratio test
can meet the performance requirement of specified
and
in fusion center.
4.1.2. Fusion rule 2
Alternatively, we also can obtain another set of
weights according the channel transition
probability. In hard fusion, the received reports
from each cooperator can only be "0" or "1".
On the one hand, the received reports
is "1", we give weight
to it. Then likelihood ratio of the th report can be derived as
(19) where
and
separately indicates the detection probability and false alarm probability of cooperator .
On the other hand, if the received reports
is "0", we give weight
to it.
Similarly, the likelihood ratio can be written
(20)
In consideration of the complexity of computation, we could assume that all the cooperators have the same detection probability.
Thus, the likelihood ratio can be obtained through (13), (19) and (20),
(21)
is the set of all such that
, and
is the set of all such that
. The threshold in the fusion center can be adjusted corresponding to the specified
and
. Note that if the observed channel has the same mean of "on/off" time, the weight given to every cooperator will be same.
4.2. Asynchronous cooperative spectrum sensing with soft fusion.
In the soft fusion case, the reports from the cooperators are the observed raw data. Instead of the quantized final decision "0s/1s", the cooperator will send the likelihood ratio which based on the proposed spectrum sensing method. The weight is given by
in the same way with
hard fusion rule 1, and the threshold can be adjusted corresponding to the performance requirement too.
Ⅴ. Numerical Results
In this section, numerical results are presented for the likelihood ratio test based spectrum sensing and asynchronous cooperative spectrum sensing, respectively.
5.1. Likelihood ratio test
We have tested the likelihood ratio test based spectrum sensing when the PU state is fast varying during a spectrum sensing window. The receiver operating characteristic (ROC) curve is plotted in Fig.3. Note that the mean holding time of "on/off" are 0.4s and 0.25s separately and
. The sampling interval is 0.002s.
Relatively higher SNR is set with the aim of observing the fast varying channel distinctly. From Fig.3, there are several observations. First, the detection probability increases as the false alarm probability increases. Thus, if we want higher probability of detection, the value of false alarm probability can be set larger. Second, the proposed spectrum sensing method based on the transition probability of interested band can significantly improve the detection performance.
Fig.4 examines the performance of proposed spectrum sensing methods and the conventional energy detector for the varying SNR at a given false alarm probability 0.1. The threshold used in the simulation is according to reference
[11]and equation (11). The performance gain is decreased while the value of SNR increases.
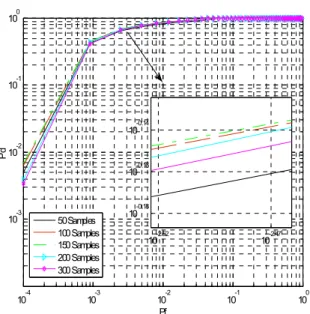
The size of the spectrum sensing window is
also tested in Fig.5. The ROC curve is plotted
with different spectrum sensing window size .
Note that the mean holding time of "on/off" both
are 0.5 seconds. One can see that the detection
probability is improved when varying from 50
to 150, whereas the detection performance
degraded when we keep increasing from 150
to 300. That is because the PU is with a fast
10-4 10-3 10-2 10-1 100 10-3
10-2 10-1 100
Pf
Pd
50 Samples 100 Samples 150 Samples 200 Samples 300 Samples
10-2.52 10-2.47
10-0.18 10-0.16 10-0.14
0 0.1 0.2 0.3 0.4 0.5 0.6 0.7 0.8 0.9 1
0 0.1 0.2 0.3 0.4 0.5 0.6 0.7 0.8 0.9 1
Pf
Pd
Proposed method Conventional method
0 5 10 15
10-4 10-3 10-2 10-1 100
SNR
Pd
Proposed method Conventional method
varying state, a bigger spectrum sensing window does not leads to an improved spectrum sensing performance.
Fig. 3. ROC curves for the likelihood ratio based spectrum sensing and the conventional energy detector for number of samples 100 when the primary user at SNR=10dB.
Fig. 4
.
Curves for likelihood ratio based spectrum sensing for varying SNR5.2. Asynchronous Cooperative Spectrum sensing.
The proposed fusion rules which account for the asynchronicity compared with the existing conventional synchronized fusion rule in Fig.6.
The SNR is set to 1dB, the interested channel mean holding time of "on" and "off" are 0.2s and 0.1s respectively. For saving simulation time, in
Fig. 5. ROC curves for likelihood ratio based spectrum sensing and the conventional detector for different number of samples at SNR=4dB.
this paper we just tested for cooperators.
One can see that the proposed hard fusion rule 1 (star line) and 2 (trangle line) can enhance the performance, and the soft fusion rule (dot line) give the best performance. The reason why hard fusion rule 1 outperforms hard fusion rule 2 can be clearly seen by comparing the two sets of weight. The weight difference of each cooperator in fusion rule 2 changing slightly when the arriving time difference is small.
We assumed all cognitive users have the same detection probability for simplicity above, but this situation is not proper for real cognitive radio networks. Reference
[17]proposed a cooperative spectrum sensing algorithm based on SNR comparison in fusion center for cognitive radio.
Due to the primary user signal transmission
suffers the different fading and every cooperator
has the different distance away from the primary
user, the received SNR of each cooperator should
be different, which will lead to the different
reliability of each cooperator. In Ref.
[17], every
cooperator sends both local decision and estimated
SNR to fusion center, the fusion center will select
the cooperator with better SNR and then make
the decision according to the designed rule. Based
10-4 10-3 10-2 10-1 100 10-3
10-2 10-1 100
Pf
Pd
Hard fusion 1 Hard fusion 2 Soft Fusion Coventioanl fusion rule
10-3 10-2 10-1 100
10-2 10-1 100
Pf
Pd
Hard fusion1 Hard fusion2 Soft fusion SNR comparison fusion
on the fusion rule of Ref.
[17], we assume that the SNRs of cooperators received signals are -2dB, -1dB, 1dB, 3dB, 5dB respectively, and the interested channel mean holding time of "on" and
"off" are 0.2s and 0.1s. Fig.7 is the comparison for the proposed fusion rule (hard fusion rule 1:
star line, hard fusion rule 2: triangle line, soft fusion tule: dot line) in this paper and the spectrum sensing algorithms in Ref.
[17](SNR comparison fusion). Fig. 7 shows that our proposed fusion rules still outperforms the existing fusion rule
[16]which is based on the SNR comparison in fusion center when each cooperator have different detection probability. By comparing the Fig. 6 and Fig. 7, we can see that when every cooperator has different detection probability, the performance of cooperative spectrum sensing will be degraded.
Fig. 6 ROC curves in fusion center for different fusion rule with same SNR from each cooperator
Ⅵ. Conclusion
In this paper, we design a cooperative spectrum sensing method to cope with the challenges when the PU is with relative high data rate. That is likelihood ratio test based spectrum sensing to cope with the fast varying PU state during a spectrum sensing window and asynchronous cooperative spectrums sensing to address the
Fig. 7. ROC curves in fusion center which every cooperator has different detection probability and SNR values.
asynchronous arrival of the reports. The design is based on likelihood ratio test, thus shares all the merits of Neyman-pearson lemma. Our work is meaningful and helpful for the cognitive radio in the current and future system with a relatively high data rate. In the future work, we will try to derive the exact formulation of
and
, and also the optimal spectrum sensing window for single user. The optimum numbers of cooperators for asynchronous cooperative spectrum will be further considered.
References
[1] J. Wang, M. Ghosh, and K. Challapali,
“Emerging cognitive radio applications: a survey,” IEEE Commun. Mag., vol. 49, no. 3, pp. 74-81, Mar. 2011.
[2] T. Yucek and H. Arslan, “A survey of spectrum sensing algorithms for cognitive radio applications,” IEEE Commun. Surveys Tutorials, vol. 11, no. 1, pp. 116-130, First Quarter, 2009.
[3] S. Haykin, D. J. Thomson, and J. H. Reed,
“Spectrum sensing for cognitive radio,” Proc.
IEEE, vol. 97, no. 5, pp. 849-877, May 2009.
[4] D. Cabric, S. M. Mishra, and R. W. Brodersen,
“Implementation issues in spectrum sensing for cognitive radios,” in Proc. 38
th Asilomar Conf.Signals, Syst. Comput., vol. 1, pp. 772-776,
Pacific Grove, U.S.A., Nov. 2004.
[5] H. Lee, J. Gu, S. H. Sohn, S. J. Jang, and J.
M. Kim, “An improved entropy based sensing by exploring phase information,” J. KICS, vol.
35, no. 9, pp. 896-905, Sep. 2010.
[6] S. Haykin “Cognitive radio: brain-empowered wireless communications,” IEEE J. Sel. Areas
Commun., vol. 23, no. 2, pp. 201-220, Feb. 2005.[7] D. Cabric, A. Tkachenko, and R. Brodersen,
“Spectrum sensing measurements of pilot, energy, and collaborative detection,” in Proc.
IEEE Military Commun. Conf., pp. 1-7,
Washington D.C., U.S.A., Oct. 2006.
[8] T. S. Shehata and M. El-Tanany, “A novel adaptive structure of the energy detector applied to cognitive radio networks,” in Proc. Canadian
Workshop Inform. Theory (CWIT 2009), pp.95-98, Ottawa, Canada, May 2009.
[9] T. Wang, Y. Chen, E. L. Hines, and B. Zhao,
“Analysis of effect of primary user traffic on spectrum sensing performance,” in Proc.
Chinacom 2009, pp. 1–5, Xian, China, Aug.
2009.
[10] J.-Y. Wu, C.-H. Wang, and T.-Y. Wang,
“Performance analysis of energy detection based spectrum sensing with unknown primary signal arrival time,” IEEE Trans. Commun., vol. 59, no. 7, pp. 1779-1784, July 2011.
[11]L. Tang, Y. Chen, E. L. Hines, and M.-S Alouini,
“Performance analysis of spectrum sensing with multiple status changes in primary user traffic,”
IEEE Commun. Lett., vol. 16, no. 6, pp.874-877,
June 2012.
[12] H. Kim and K. G. Shin, “Efficient discovery of spectrum opportunities with MAC-layer sensing in cognitive radio networks,” IEEE
Trans. Mobile Comput., vol. 7, no. 5, pp. 533-545,May 2008.
[13] Q. Liang, M. Liu, and D. Yuan, “Channel estimation for opportunistic spectrum access:
uniform and random sensing,” IEEE Trans.
Mobile Comput., vol. 11, no. 8, pp. 1304-1316,
June 2012.
[14] J. Ma, G. Zhao, and Y. Li, “Soft combination and detection for cooperative spectrum sensing in cognitive radio networks,” IEEE Trans.
Wireless Commun., vol. 7, no. 11, pp. 4502-4507,
Nov. 2008.
[15] F. F. Digham, M.-S. Alouini, and M. K. Simon,
“On the energy detection of unknown signals over fading channels,” IEEE Trans. Commun., vol. 55, no. 1, pp. 21–24, Jan. 2007.
[16] Z. Chair and P. K. Varshney, “Optimal data fusion in multiple sensor detection systems,”
IEEE Trans. Aerosp. Electron. Syst., vol.
AES-22, no. 1, pp. 98-101, Jan. 1986.
[17] Y. Zheng, X. Xie, and L. Yang, “Cooperative spectrum sensing based on SNR comparison in fusion center for cognitive radio,” in Proc. Int.
Conf. Advanced Comput. Control (ICACC'09),
pp. 212-216, Singapore, Jan. 2009.
김 정 영
(Jingying Jin)
2010년 7월 중국 지린 건축 대학교 전자통신공학과 졸업 2011년 9월~현재 인하대학교
정보통신공학과 석사 과정
<관심분야> 이동통신, 무선인 지기술
구 준 롱
(Junrong Gu)
2005년 7월 중국 동북대학교 통신공학 졸업
2008년 2월 중국 대련이공대학 교 통신정보계통공학 석사 2012년 2월 인하대학교 정보통
신대학원 박사
2012년 3월~2013년 3월 서울 대학교 박사 후 연구원
2013년 4월~현재 인하대학교 박사 후 연구원
<관심분야> 이동통신, 무선인지기술
김 재 명