J. Fish Pathol., 34(1) : 009~015 http://dx.doi.org/10.7847/jfp.2021.34.1.009
Introduction
Megalocytivirus isolates from many different fishes have been divided into three major subgroups based on the phylogenetic analysis with the major capsid protein (MCP): genotype I includes rock bream irido- virus (RBIV) (Nakajima and Kurita, 2012). In Korea, an outbreak of RBIV in rock bream (Oplegnathus fas- ciatus) was first reported in the summer of 1998 in southern coastal areas (Jung and Oh, 2000). After the first report, high mortality of rock bream due to RBIV
infection occurs annually. Recently, immunological and physical responses of rock bream to RBIV have been evaluated (Jung et al., 2014; Jung and Jung, 2017). In addition, a large-scale cDNA shotgun se- quencing for transcriptome analysis and a microarray analysis of RBIV infected fish have been performed to find genetic information of RBIV resistant fish (Jung et al., 2014; Jung and Jung, 2017). However, immune defensive mechanisms of rock bream against RBIV disease progression remain unclear. Under- standing host-RBIV interactions will be useful for de- veloping strategies to control RBIV infections in cul- tured fish and for developing long-term control and preventive measures against RBIV infections to sup-
Microsatellite marker distribution pattern in rock bream iridovirus (RBIV) infected rock bream, Oplegnathus fasciatus
Myung-Hwa Jung* and Sung-Ju Jung**†
*Department of Marine Bio and Medical Sciences, Hanseo University, Seosan 31962, Korea
**Department of Aqualife Medicine, Chonnam National University, Yeosu 59626, Korea
Rock bream (Oplegnathus fasciatus) is a highly valued aquaculture species in Korea. However, the aquaculture industry suffers huge economic losses due to rock bream iridovirus (RBIV) infection in summer. The objective of this study was to determine genetic diversity and relationships of DNAs isolated from two groups of rock bream after RBIV infection using five microsatellite (MS) markers.
The first group of fish died early and the second group of fish died later after RBIV infection. In this experiment, 90 fish (5.1±1.0 cm and 4.1±1.3 g) were injected with 50 μl of RBIV (104 TCID50/ml) and maintained at 26°C for 15 days. Genomic DNAs were extracted from fins of 20 fish that died earlier or later after RBIV infection. These DNAs were subjected to genotyping using five MS markers (CA-03, CA3-05, CA3-06, CA-10, and CA3-36). Of these markers, CA3-05 (early death group), CA3-06 (late death group), and CA3-36 (both early and late death groups) showed different alleles distribution rates. In-depth studies are needed to provide valuable information for selecting RBIV-re- sistant fish. In conclusion, microsatellite marker distribution pattern differences between early- and late- death groups of rock bream after RBIV infection showing different RBIV susceptibilities were determined using MS markers and genotyping. Results of this study suggest that MS markers could be used to facilitate the selection of RBIV resistant rock bream.
Key words: rock bream iridovirus, rock bream, microsatellite (MS) marker, disease resistance, genotyp- ing
†Corresponding author: Sung-Ju Jung Tel: +82-61-659-7175; Fax: +82-61-659-7179 E-mail: [email protected]
port rock bream aquaculture production.
Molecular markers such as microsatellites (MS) of- fer new possibilities in plant and animal breeding (Lim et al., 2005; Kitamura et al., 2009). Disease re- sistance is one of the most desirable traits in breeding programs because mass mortality due to diseases strongly influences the success of aquaculture. MS markers have been used in analyses of genetic diver- sity and genetic variations of rock bream (An et al., 2006; Kim et al., 2008; Xu et al., 2008). However, to the best of our knowledge, differences in genetic diversity between susceptible and resistant of rock bream for selective breeding programs have not been reported yet. Thus, the objective of this study was to determine genetic diversity and relationships of DNAs isolated from two groups of rock bream after RBIV infection using five microsatellite (MS) mark- ers. The first group of fish died early and the second group of fish died later after RBIV infection.
Materials and Methods
Experimental infection
The virus used in the present study was originally isolated from RBIV-infected rock bream in 2010 as described previously (Jung et al., 2014). Virus was cultured in a grunt fin (GF) cell line maintained in Dulbecco's Modified Eagle Medium (DMEM) (Gibco, USA) supplemented with 10% (v/v) fetal bovine se- rum (Gibco, USA), 100 IU/ml of penicillin G, and 100 μg/ml of streptomycin at 25°C. Virus infectivity was titrated using 96-well microplates seeded with susceptible cells. After 10–14 days of culturing at 25°C, cytopathic effects (CPEs) were evaluated to de- termine the 50% tissue culture infectious dose (TCID50).
RBIV having a virus titer of 104 TCID50/ml.
For the artificial infection experiments, pathogen- free rock bream samples were obtained from a local hatchery; the absence of RBIV by virus gene copy numbers. To measure the absolute virus copy number, genomic DNA was extracted from whole spleen (5~
15 mg) samples using an AccuPrep®Genomic DNA extraction kit (Bioneer, Korea) according to the man- ufacturer’s protocol. A standard curve was generated to determine the major capsid protein (MCP) gene copy number by quantitative real-time polymerase chain reaction (qRT-PCR) as previously described (Jung et al., 2014). The virus copy number was de- termined from 1 μl of genomic DNA taken from 100 μl of total genomic DNA.
Fish (5.1 ± 1.0 cm and 4.1 ± 1.3 g) were intra-peri- toneally (i.p.) injected with either RBIV (104 TCID50/ 50 μl/fish) or phosphate-buffered saline (PBS) (50 μl/
fish). Each groups of 90 fish were maintained in a circulating aquaria containing 250 L of UV-treated seawater at 26°C for 15 days. Overall daily seawater exchange rate was 10% of system volume per day (25 L/day). To determine distribution patterns of MS markers in rock bream after RBIV infection, all dead fishes were sampled for fin and preserved in 100%
ethanol.
Genotyping
Fins have been used to evaluate the DNA genetic markers (Norris et al., 1999; Alam and Islam, 2005).
Genomic DNAs were isolated from fins (15~20 mg) of each rock bream using an AccuPrep®Genomic DNA extraction kit (Bioneer, Korea) according to the manufacturer’s instructions. Polymerase chain reac- tion (PCR) reactions were performed using Accu Power® PCR PreMix (Bioneer, Korea) in a final re- action volume of 20 μl containing 1 μl of each primer (10 µM), 13 μl of DEPC-treated water, and 5 μl of the template (genomic DNA) on an ABI 2720 Ther- mal Cycler (Applied Biosystem, Foster City, CA, USA). PCR amplification conditions were as follows:
95°C for 5 min, 35 cycles of 95°C for 1min, 54 or 60°C for 1 min, and 72°C for 1 min, followed by a final extension at 72°C for 5 min. PCR products were electrophoresed on an ABI 3730xl Genetic Analyzer (Applied Biosystems, USA) using a POP7 gel matrix with GeneScan™–500 LIZ® Size Standard
(Applied Biosystems, USA). GenSeScan Analysis software (V.3.7, Applied Biosystems, USA) was used to score microsatellite alleles. Allele size was man- ually verified. Five MS marker (CA1-03, CA1-10, CA3-05, CA3-06, and CA3-36) were selected from our previous research (Kim et al., 2011). Microsatell- ite loci are summarized in Table 1.
Results and Discussion
To prevent disease, attempts have been made to develop genetic markers for selecting disease resistant individuals recently. Accumulation of genetic infor- mation of a particular species (individual) is necessary.
MS markers have been used to analyze genetic diver- sity within species, population genetic structure, and genomic mapping of fish (McConnell et al., 1995;
Perez- Enriquez et al., 1999; Moen et al., 2004). In our previous studies, we have obtained a large quan- tity of mRNA information using GS-FLEX (Jung et al., 2014; Jung and Jung, 2017). The aim of this work was to develop markers for detecting specific RBIV- resistant individuals with the available genetic infor- mation.
In the present study, genotyping was performed us- ing MS markers to find alleles associated with resist- ance to RBIV using two groups of fish (20 fish in the group with early death and 20 fish in the group with later death after RBIV infection). Mortality was
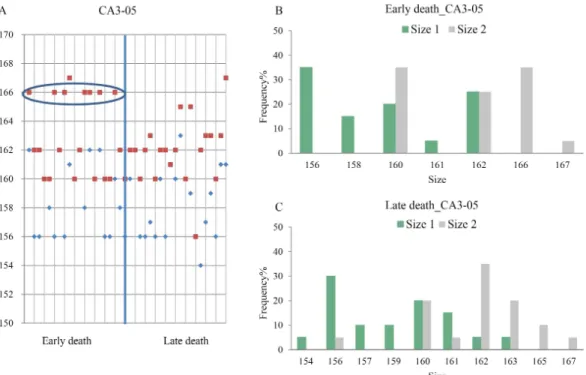
observed at 4 days post infection (dpi). The infected fish showed a dark body colour with typical signs of RBIV infection, such as enlarged basophilic cells in the spleen and kidney imprints. The mortality reached 100% mortality at 15 dpi (Fig. 1). None of the control fish died throughout the experimental period. Excessive hypertrophy of the spleen and kid- ney of virus infected rock bream was found, leading to mass mortality. Fish DNAs were used for genotyp- ing using five MS markers (CA1-03, CA1-10, CA3- 05, CA3-06, and CA3-36). Of these markers, CA3-05, CA3-06, and CA3-36 showed different allele dis- tributions in both early and late death groups (Table 2; Fig. 2, 3, and 4). For the CA3-05 marker, the allele distribution had 156 bases to 167 bases, with high
Table 1. Microsatellite markers used for analysis in this study
Locus Sequence Ta Repeat motif Size(bp)
CA1-03 F CATCATGTTGGCAGGTTCAT
R GTTGAATCTCAGGGCTGCTC 54 (AC)40 146-224
CA1-10 F CAGAGGTGGAAACGACAGTG
R GCCTGCATGTGACTATGTGAA 60 (CA)34 120-155
CA3-05 F AAGGCACCGACTCACGTAGGG
R CGGATCACTTTCAGCCTCACATC 60 (TG)32 147-167
CA3-06 F TGAAAGACAAGAAGCAACAGTGCAA
R TGGAAAGGACAGATCCCTGCAT 60 (TG)28 143-173
CA3-36 F TTGCTTGCTGCTTGTTCGTTTC
R GGGCTTCCCTGCTTTGCTTG 60 (TG)24 159-194
Fig. 1. Cumulative mortality of rock bream intra-peri- toneally (i.p.) injected with RBIV (104 TCID50/50 μl/
fish) at 26°C. Early death and late death groups of fish were used for microsatellite marker analysis.
distribution alleles having 156, 160, 162, and 166 bas- es in the early and late death groups (Fig. 2A, 2B, and 2C). Furthermore, the high distribution allele hav- ing 166 bases was observed only in the early death group (Fig. 2B). For the CA3-36 marker, the allele distribution had 158-196 bases, with high distribution alleles having 169 and 171 bases in the early and late death groups (Fig. 4A, 4B, and 4C). In the early death group, high distribution allele (196 bases) rates were observed (Fig. 4B). For the CA3-06 marker, the
allele distribution had 150-171 bases, with high dis- tribution alleles having 158 and 162 bases in both early and late death groups (Fig. 3A, 3B, and 3C).
Interestingly, high distribution allele having 169 bases in the early death group while high distribution allele had 154 bases in the late death group (Fig. 3B and 3C). This indicates that the CA3-06 marker dis- tribution rates were positively co-related with RBIV resistance or susceptibility. A similar observation has been reported for infectious hematopoietic necrosis Table 2. Results of microsatellite marker analysis for RBIV-infected rock bream in early death group (sample E) and late death group (sample L)
Sample Name
CA1-03 CA1-10 CA3-05 CA3-06 CA3-36
Size 1 Size 2 Size 1 Size 2 Size 1 Size 2 Size 1 Size 2 Size 1 Size 2 E_01
E_02 E_03 E_04 E_05 E_06 E_07 E_08 E_09 E_10 E_11 E_12 E_13 E_14 E_15 E_16 E_17 E_18 E_19 E_20 L_01 L_02 L_03 L_04 L_05 L_06 L_07 L_08 L_09 L_10 L_11 L_12 L_13 L_14 L_15 L_16 L_17 L_18 L_19 L_20
165 179 177 179 178 154 177 154 200 165 177 154 188 182 154 154 154 154 180 196 178 178 196 179 179 177 155 152 154 167 192 152 165 179 179 177 180 165 167 177
201 192 182 182 190 216 201 156 201 178 184 190 200 216 154 156 156 154 203 205 182 178 207 179 188 179 155 152 154 179 228 152 198 196 218 177 196 165 177 181
138 137 138 126 151 134 140 134 126 146 139 126 134 137 126 134 134 134 126 152 137 146 137 137 138 138 128 137 142 126 137 137 146 130 126 138 126 144 137 128
138 137 151 152 151 148 151 148 142 150 151 151 135 142 151 148 142 142 144 152 151 151 139 137 138 142 154 144 151 151 146 137 152 138 151 151 152 146 137 148
162 156 156 160 158 156 162 156 161 160 162 158 162 160 162 156 156 160 158 156 160 162 156 156 157 156 160 156 161 160 163 160 159 156 154 157 159 156 161 161
166 162 162 160 160 166 162 166 167 160 162 166 166 160 166 160 160 166 162 160 162 162 160 162 163 160 162 162 161 162 165 160 165 156 162 163 163 160 163 167
162 156 158 162 162 158 156 156 156 154 158 158 158 157 158 162 158 162 162 162 158 154 162 154 154 154 154 156 154 154 154 150 162 158 158 154 154 154 156 154
163 162 162 169 171 162 158 169 169 154 158 162 162 163 162 169 162 169 169 169 162 158 162 156 158 158 154 168 162 156 162 154 171 162 162 156 162 166 162 162
0 169 161 179 169 173 171 173 171 175 171 169 158 171 169 173 170 194 171 159 169 179 169 168 171 169 169 165 158 159 165 159 177 169 159 171 177 169 159 169
0 186 179 184 181 196 179 196 194 184 179 171 196 194 171 196 194 196 177 175 179 181 186 168 186 186 171 177 169 179 171 159 194 186 179 179 184 169 186 173
Fig. 2. Distribution patterns of microsatellite marker (CA3-05) in RBIV-infected rock bream. Circles indicates high distribution alleles (◆ Size 1, ■ Size 2).
Fig. 3. Distribution patterns of microsatellite marker (CA3-06) in RBIV-infected rock bream. Circles indicates high distribution alleles (◆ Size 1, ■ Size 2).
virus (IHNV)-infected steelhead trout (Oncorhynchus mykiss) (i.e. They found six microsatellite markers distributed in three linkage groups (Sire LG11, 20, and 25) showing association with IHNV resistance in one of ten families studied) (Rodriguez et al., 2004).
When the three MS markers (CA3-05, CA3-06, and CA3-36) were analyzed together, the two groups (early and late death) were not separated perfectly us- ing these markers. However, CA3-06 marker showed different allele distribution for fish died early and late after RBIV infection. Therefore, more detailed studies are required to find a MS marker that can facilitate the selection of RBIV resistant rock bream.
Acknowledgements
This research was a part of a project entitled ‘Fish Vaccine Research Center’ funded by the Ministry of Oceans and Fisheries, Republic of Korea.
References
Kurita, J. and Nakajima, K.: Megalocytiviruses. Viruses, 4: 521-538, 2012.
Jung, S.J. and Oh, M.J.: Iridovirus-like infection asso- ciated with high mortalities of striped beak perch, Oplegnathus fasciatus (Temminck et Schlegel), in southern coastal areas of the Korea peninsula. J Fish Dis, 23: 223-236, 2000.
Lim, H.T., Min, H.S., Moon, W.G., Lee, J.B., Kim, J.H., Cho, I.C. and Jeon, J.T.: Analysis and selection of microsatellites markers for individual traceability system in hanwoo. J Anim Sci Technol, 47: 491- 500, 2005.
Kitamura, K., Saitoh, T., Matsuo, A. and Suyama, Y.:
Development of microsatellite markers for the dwarf bamboo species Sasa cernua and Sasa kurilensis (Poaceae) in northern Japan. Mol Ecol Resour, 9:
1470-1472, 2009.
Jung, M.H., Nikapitiya, C., Song, J.Y., Lee, J.H., Lee, J.H., Oh, M.J. and Jung, S.J.: Gene expression of pro- and anti-apoptotic proteins in rock bream (Oplegnathus fasciatus) infected with megalocytivi- Fig. 4. Distribution patterns of microsatellite marker (CA3-36) in RBIV-infected rock bream. Circles indicates high distribution alleles (◆ Size 1, ■ Size 2).
rus (family Iridoviridae). Fish Shellfish Immunol, 37: 122-130, 2014.
Jung, M.H. and Jung, S.J.: Gene expression regulation of the TLR9 and MyD88-dependent pathway in rock bream against rock bream iridovirus (RBIV) infec- tion. Fish Shellfish Immunol, 70: 507-514, 2017.
An, H.S., Kim, J.W. and Park, J.Y.: Microsatellite DNA loci in the rock bream Oplegnathus fasciatus. Mol Ecol Notes, 6: 44-46, 2006.
Kim, M.J., An, H.S., Hong, S.W. and Park, J.Y.: Investi- gation of Genetic Diversity between Wild-caught and Hatchery-reared Rock Bream (Oplegnthus fas- ciatus) Using Microsatellite DNA Analysis. J Fis Sci Technol, 11: 82-87, 2008.
Xu, T., Shoa, C., Lioa, X., Ji, X. and Chen, S.: Isolation and characterization of polymorphic microsatellite DNA markers in the rock bream (Oplegnathus fas- ciatus). Conserv Genet 10, 527-529, 2008.
Norris, A.T., Bradley, D.G. and Cunningham, E.P.:
Microsatellite genetic variation between and within farmed and wild Atlantic salmon (Salmo salar) pop- ulations. Aquaculture, 180: 247-264, 1999.
Alam, M.S. and Islam, M.S.: Population genetic struc- ture of Catla catla (Hamilton) revealed by micro- satellite DNA markers. Aquaculture, 246: 151-160, 2005.
Kim, J.O., Jung, S.J., L, J.H., Kim, C.H., Yang, B.G., Kim, B.S. and Oh, M.J.: Seventeen microsatellite lo- ci for the rock bream, Oplegnathus fasciatus. Mol Ecol Notes, 11: 418-421, 2011.
McConnell, S.K., O'Reilly, P., Hamilton, L., Wright, J.M.
and Bentzen, P.: Polymorphic microsatellite loci from Atlantic salmon (Salmo salar): genetic differ- entiation of North American and European popula- tions. Can J Fish Aquat Sci, 52: 1863-1872, 1995.
Perez-Enriquez R., Takagi M. and Taniguchi N.: Genetic variability and pedigree tracing of a hatchery-reared stock of red sea bream (Pagrus major) used for stock enhancement, based on microsatellite DNA markers. Aquaculture, 173: 413-423, 1999.
Moen, T., Hoyheim, G., Munck, H. and Gomes-Raya, L.: A linkage map of Atlantic salmon (Salmo salar) reveals an uncommonly large difference in recombi- nation rate between the sexes. Ani Genet, 35: 81-92, 2004.
Rodriguez, M.F., LaPatra, S., Williams, S., Famula, T.
and May, B.: Genetic markers associated with resist- ance to infectious hematopoietic necrosis in rainbow and steelhead trout (Oncorhynchus mykiss) back- crosses. Aquaculture, 241: 93-115, 2004.
Manuscript Received : Jun 09, 2021 Revised : Jun 15, 2021 Accepted : Jun 15, 2021